Immigrants from Uruguay vs White/Caucasian Wage/Income Gap
COMPARE
Immigrants from Uruguay
White/Caucasian
Wage/Income Gap
Wage/Income Gap Comparison
Immigrants from Uruguay
Whites/Caucasians
24.6%
WAGE/INCOME GAP
93.8/ 100
METRIC RATING
126th/ 347
METRIC RANK
28.5%
WAGE/INCOME GAP
0.1/ 100
METRIC RATING
306th/ 347
METRIC RANK
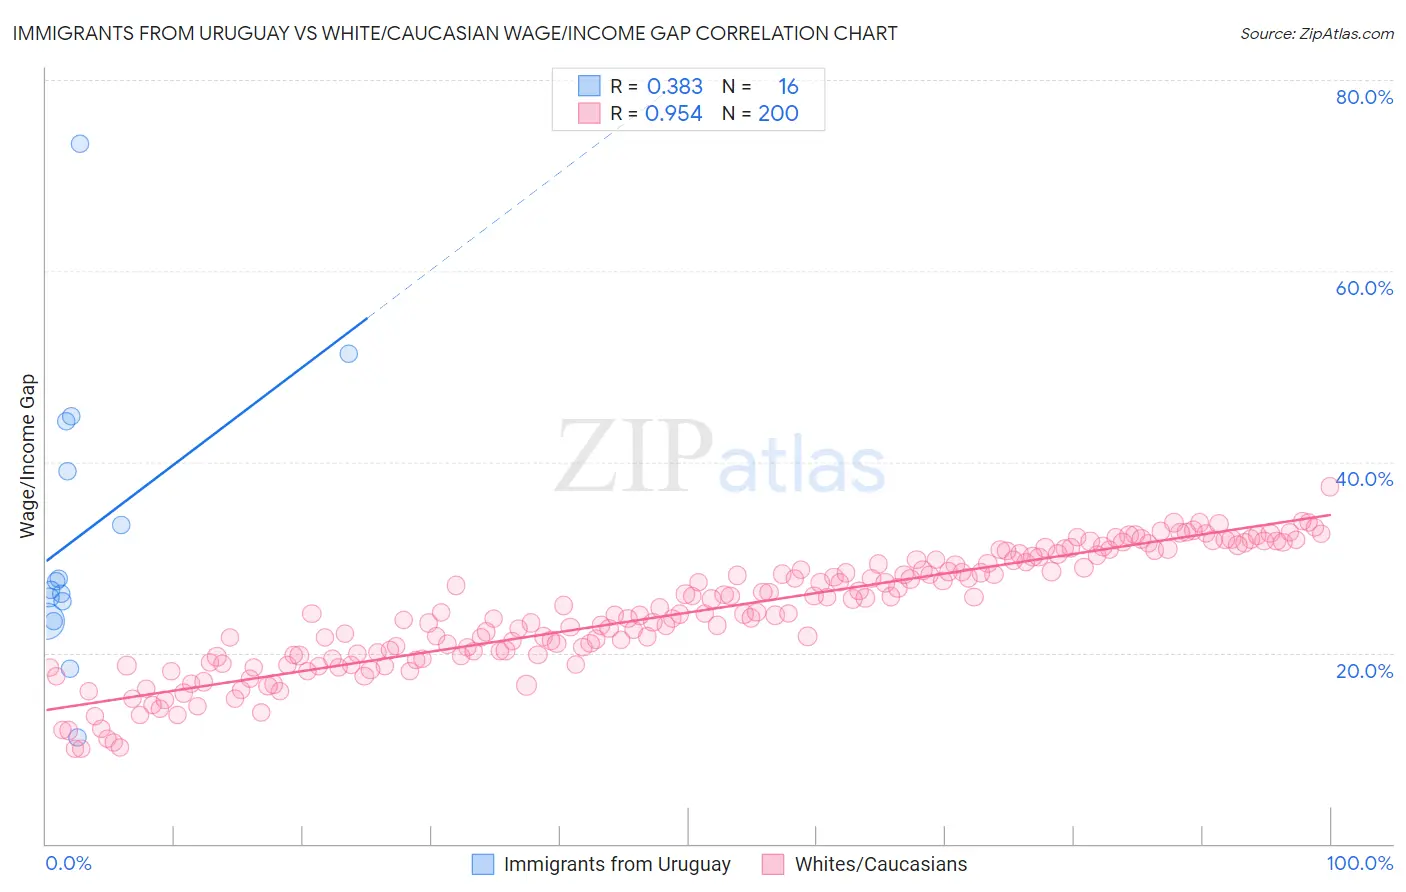
Immigrants from Uruguay vs White/Caucasian Wage/Income Gap Correlation Chart
The statistical analysis conducted on geographies consisting of 133,243,894 people shows a mild positive correlation between the proportion of Immigrants from Uruguay and wage/income gap percentage in the United States with a correlation coefficient (R) of 0.383 and weighted average of 24.6%. Similarly, the statistical analysis conducted on geographies consisting of 580,089,064 people shows a perfect positive correlation between the proportion of Whites/Caucasians and wage/income gap percentage in the United States with a correlation coefficient (R) of 0.954 and weighted average of 28.5%, a difference of 15.8%.
Wage/Income Gap Correlation Summary
| Measurement | Immigrants from Uruguay | White/Caucasian |
| Minimum | 11.1% | 9.9% |
| Maximum | 73.3% | 37.4% |
| Range | 62.2% | 27.5% |
| Mean | 32.6% | 24.2% |
| Median | 27.1% | 24.1% |
| Interquartile 25% (IQ1) | 24.3% | 19.6% |
| Interquartile 75% (IQ3) | 41.7% | 29.7% |
| Interquartile Range (IQR) | 17.3% | 10.1% |
| Standard Deviation (Sample) | 15.1% | 6.2% |
| Standard Deviation (Population) | 14.6% | 6.2% |
Similar Demographics by Wage/Income Gap
Demographics Similar to Immigrants from Uruguay by Wage/Income Gap
In terms of wage/income gap, the demographic groups most similar to Immigrants from Uruguay are German Russian (24.6%, a difference of 0.010%), Spanish American (24.6%, a difference of 0.020%), Immigrants from South America (24.6%, a difference of 0.040%), Immigrants from Central America (24.6%, a difference of 0.070%), and Yup'ik (24.7%, a difference of 0.13%).
| Demographics | Rating | Rank | Wage/Income Gap |
| Kenyans | 95.8 /100 | #119 | Exceptional 24.5% |
| Cree | 95.6 /100 | #120 | Exceptional 24.5% |
| Immigrants | Thailand | 94.9 /100 | #121 | Exceptional 24.5% |
| Apache | 94.8 /100 | #122 | Exceptional 24.5% |
| Natives/Alaskans | 94.6 /100 | #123 | Exceptional 24.6% |
| Immigrants | South America | 93.9 /100 | #124 | Exceptional 24.6% |
| Spanish Americans | 93.8 /100 | #125 | Exceptional 24.6% |
| Immigrants | Uruguay | 93.8 /100 | #126 | Exceptional 24.6% |
| German Russians | 93.7 /100 | #127 | Exceptional 24.6% |
| Immigrants | Central America | 93.5 /100 | #128 | Exceptional 24.6% |
| Yup'ik | 93.3 /100 | #129 | Exceptional 24.7% |
| Alsatians | 93.2 /100 | #130 | Exceptional 24.7% |
| Immigrants | Philippines | 93.0 /100 | #131 | Exceptional 24.7% |
| Immigrants | Costa Rica | 92.4 /100 | #132 | Exceptional 24.7% |
| Colombians | 92.4 /100 | #133 | Exceptional 24.7% |
Demographics Similar to Whites/Caucasians by Wage/Income Gap
In terms of wage/income gap, the demographic groups most similar to Whites/Caucasians are Immigrants from Denmark (28.5%, a difference of 0.010%), Immigrants from South Africa (28.5%, a difference of 0.050%), Immigrants from Netherlands (28.5%, a difference of 0.060%), Polish (28.5%, a difference of 0.080%), and Scotch-Irish (28.5%, a difference of 0.14%).
| Demographics | Rating | Rank | Wage/Income Gap |
| Immigrants | North Macedonia | 0.2 /100 | #299 | Tragic 28.4% |
| Immigrants | Northern Europe | 0.2 /100 | #300 | Tragic 28.5% |
| Immigrants | Canada | 0.2 /100 | #301 | Tragic 28.5% |
| Scotch-Irish | 0.2 /100 | #302 | Tragic 28.5% |
| Irish | 0.2 /100 | #303 | Tragic 28.5% |
| Immigrants | Netherlands | 0.2 /100 | #304 | Tragic 28.5% |
| Immigrants | South Africa | 0.1 /100 | #305 | Tragic 28.5% |
| Whites/Caucasians | 0.1 /100 | #306 | Tragic 28.5% |
| Immigrants | Denmark | 0.1 /100 | #307 | Tragic 28.5% |
| Poles | 0.1 /100 | #308 | Tragic 28.5% |
| Macedonians | 0.1 /100 | #309 | Tragic 28.6% |
| Finns | 0.1 /100 | #310 | Tragic 28.6% |
| Immigrants | Lithuania | 0.1 /100 | #311 | Tragic 28.6% |
| Eastern Europeans | 0.1 /100 | #312 | Tragic 28.6% |
| French | 0.1 /100 | #313 | Tragic 28.7% |