Immigrants from Uruguay 2 or more Vehicles in Household
COMPARE
Immigrants from Uruguay
Select to Compare
2 or more Vehicles in Household
Immigrants from Uruguay 2 or more Vehicles in Household
51.4%
2+ VEHICLES AVAILABLE
0.1/ 100
METRIC RATING
285th/ 347
METRIC RANK
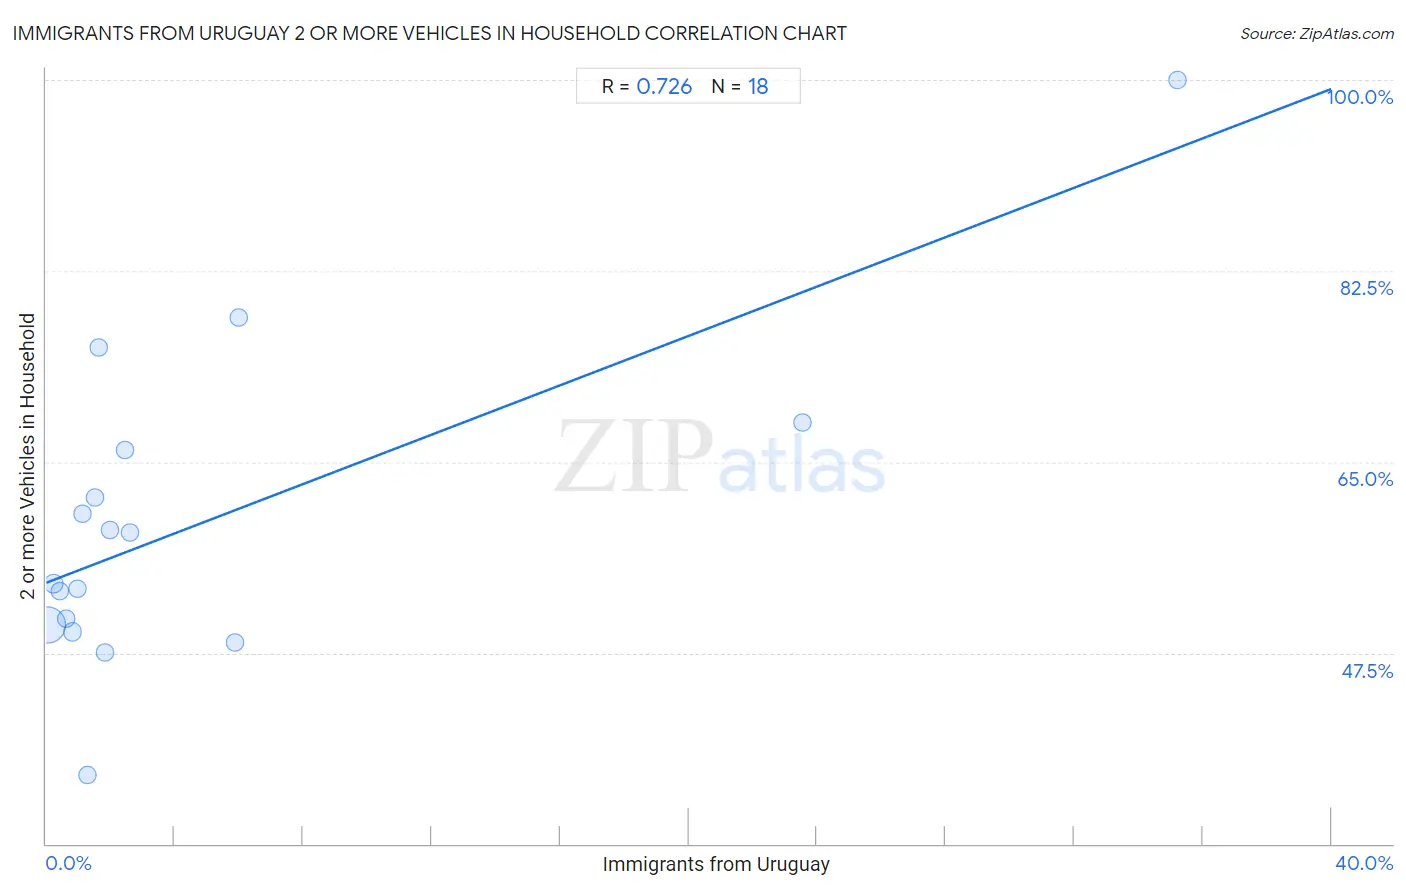
Immigrants from Uruguay 2 or more Vehicles in Household Correlation Chart
The statistical analysis conducted on geographies consisting of 133,245,142 people shows a strong positive correlation between the proportion of Immigrants from Uruguay and percentage of households with 2 or more vehicles available in the United States with a correlation coefficient (R) of 0.726 and weighted average of 51.4%. On average, for every 1% (one percent) increase in Immigrants from Uruguay within a typical geography, there is an increase of 1.1% in percentage of households with 2 or more vehicles available.
It is essential to understand that the correlation between the percentage of Immigrants from Uruguay and percentage of households with 2 or more vehicles available does not imply a direct cause-and-effect relationship. It remains uncertain whether the presence of Immigrants from Uruguay influences an upward or downward trend in the level of percentage of households with 2 or more vehicles available within an area, or if Immigrants from Uruguay simply ended up residing in those areas with higher or lower levels of percentage of households with 2 or more vehicles available due to other factors.
Demographics Similar to Immigrants from Uruguay by 2 or more Vehicles in Household
In terms of 2 or more vehicles in household, the demographic groups most similar to Immigrants from Uruguay are Immigrants from Liberia (51.3%, a difference of 0.14%), Immigrants from Zaire (51.5%, a difference of 0.16%), Immigrants from Serbia (51.3%, a difference of 0.17%), Immigrants from China (51.5%, a difference of 0.20%), and Bahamian (51.5%, a difference of 0.28%).
| Demographics | Rating | Rank | 2 or more Vehicles in Household |
| Yuman | 0.1 /100 | #278 | Tragic 51.7% |
| Liberians | 0.1 /100 | #279 | Tragic 51.7% |
| Immigrants from Eastern Europe | 0.1 /100 | #280 | Tragic 51.7% |
| Immigrants from Kazakhstan | 0.1 /100 | #281 | Tragic 51.6% |
| Bahamians | 0.1 /100 | #282 | Tragic 51.5% |
| Immigrants from China | 0.1 /100 | #283 | Tragic 51.5% |
| Immigrants from Zaire | 0.1 /100 | #284 | Tragic 51.5% |
| Immigrants from Uruguay | 0.1 /100 | #285 | Tragic 51.4% |
| Immigrants from Liberia | 0.1 /100 | #286 | Tragic 51.3% |
| Immigrants from Serbia | 0.1 /100 | #287 | Tragic 51.3% |
| Okinawans | 0.1 /100 | #288 | Tragic 51.2% |
| Somalis | 0.0 /100 | #289 | Tragic 51.1% |
| Immigrants from Panama | 0.0 /100 | #290 | Tragic 51.1% |
| Belizeans | 0.0 /100 | #291 | Tragic 51.0% |
| Immigrants from Ukraine | 0.0 /100 | #292 | Tragic 50.9% |
Immigrants from Uruguay 2 or more Vehicles in Household Correlation Summary
| Measurement | Immigrants from Uruguay Data | 2 or more Vehicles in Household Data |
| Minimum | 0.035% | 36.3% |
| Maximum | 35.2% | 100.0% |
| Range | 35.2% | 63.7% |
| Mean | 4.9% | 59.5% |
| Median | 1.6% | 56.2% |
| Interquartile 25% (IQ1) | 0.81% | 50.1% |
| Interquartile 75% (IQ3) | 2.6% | 66.0% |
| Interquartile Range (IQR) | 1.8% | 16.0% |
| Standard Deviation (Sample) | 9.3% | 14.5% |
| Standard Deviation (Population) | 9.0% | 14.1% |
Correlation Details
| Immigrants from Uruguay Percentile | Sample Size | 2 or more Vehicles in Household |
[ 0.0% - 0.5% ] 0.035% | 119,951,399 | 50.1% |
[ 0.0% - 0.5% ] 0.24% | 8,941,367 | 53.8% |
[ 0.0% - 0.5% ] 0.41% | 2,020,061 | 53.2% |
[ 0.5% - 1.0% ] 0.61% | 1,020,006 | 50.6% |
[ 0.5% - 1.0% ] 0.81% | 589,924 | 49.4% |
[ 0.5% - 1.0% ] 0.98% | 195,403 | 53.4% |
[ 1.0% - 1.5% ] 1.13% | 208,287 | 60.3% |
[ 1.0% - 1.5% ] 1.30% | 124,606 | 36.3% |
[ 1.5% - 2.0% ] 1.52% | 28,137 | 61.8% |
[ 1.5% - 2.0% ] 1.63% | 3,868 | 75.5% |
[ 1.5% - 2.0% ] 1.84% | 145,531 | 47.6% |
[ 1.5% - 2.0% ] 2.00% | 9,119 | 58.8% |
[ 2.0% - 2.5% ] 2.46% | 3,864 | 66.0% |
[ 2.5% - 3.0% ] 2.60% | 1,849 | 58.5% |
[ 5.5% - 6.0% ] 5.87% | 1,192 | 48.4% |
[ 6.0% - 6.5% ] 6.00% | 250 | 78.2% |
[ 23.5% - 24.0% ] 23.56% | 191 | 68.6% |
[ 35.0% - 35.5% ] 35.23% | 88 | 100.0% |