Immigrants from Uruguay vs Immigrants from St. Vincent and the Grenadines Wage/Income Gap
COMPARE
Immigrants from Uruguay
Immigrants from St. Vincent and the Grenadines
Wage/Income Gap
Wage/Income Gap Comparison
Immigrants from Uruguay
Immigrants from St. Vincent and the Grenadines
24.6%
WAGE/INCOME GAP
93.8/ 100
METRIC RATING
126th/ 347
METRIC RANK
16.4%
WAGE/INCOME GAP
100.0/ 100
METRIC RATING
2nd/ 347
METRIC RANK
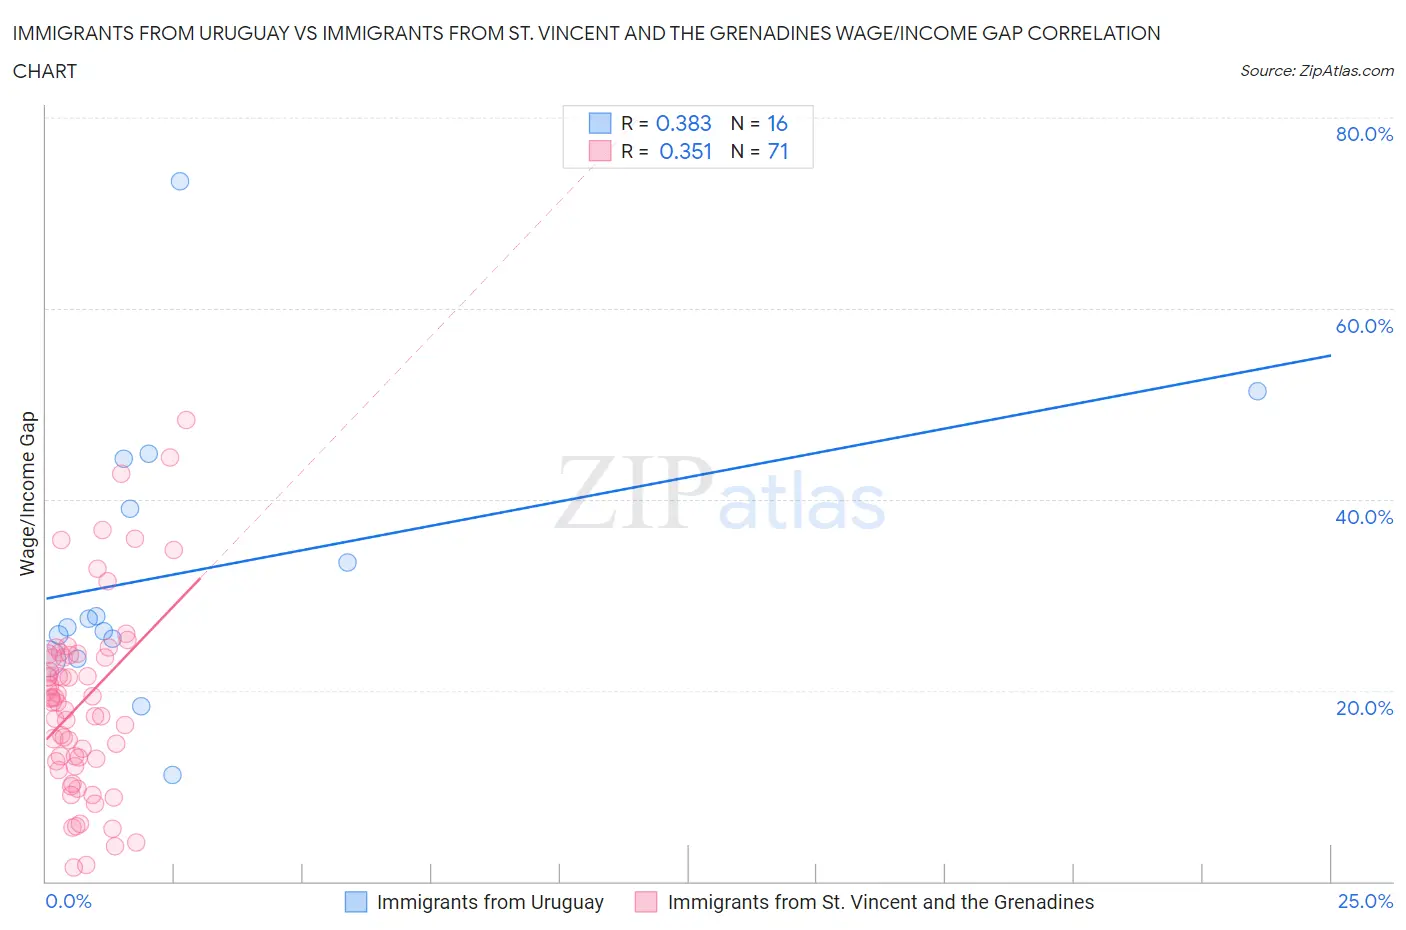
Immigrants from Uruguay vs Immigrants from St. Vincent and the Grenadines Wage/Income Gap Correlation Chart
The statistical analysis conducted on geographies consisting of 133,243,894 people shows a mild positive correlation between the proportion of Immigrants from Uruguay and wage/income gap percentage in the United States with a correlation coefficient (R) of 0.383 and weighted average of 24.6%. Similarly, the statistical analysis conducted on geographies consisting of 56,186,231 people shows a mild positive correlation between the proportion of Immigrants from St. Vincent and the Grenadines and wage/income gap percentage in the United States with a correlation coefficient (R) of 0.351 and weighted average of 16.4%, a difference of 50.0%.
Wage/Income Gap Correlation Summary
| Measurement | Immigrants from Uruguay | Immigrants from St. Vincent and the Grenadines |
| Minimum | 11.1% | 1.4% |
| Maximum | 73.3% | 48.3% |
| Range | 62.2% | 46.9% |
| Mean | 32.6% | 18.8% |
| Median | 27.1% | 18.8% |
| Interquartile 25% (IQ1) | 24.3% | 12.5% |
| Interquartile 75% (IQ3) | 41.7% | 23.7% |
| Interquartile Range (IQR) | 17.3% | 11.2% |
| Standard Deviation (Sample) | 15.1% | 9.8% |
| Standard Deviation (Population) | 14.6% | 9.8% |
Similar Demographics by Wage/Income Gap
Demographics Similar to Immigrants from Uruguay by Wage/Income Gap
In terms of wage/income gap, the demographic groups most similar to Immigrants from Uruguay are German Russian (24.6%, a difference of 0.010%), Spanish American (24.6%, a difference of 0.020%), Immigrants from South America (24.6%, a difference of 0.040%), Immigrants from Central America (24.6%, a difference of 0.070%), and Yup'ik (24.7%, a difference of 0.13%).
| Demographics | Rating | Rank | Wage/Income Gap |
| Kenyans | 95.8 /100 | #119 | Exceptional 24.5% |
| Cree | 95.6 /100 | #120 | Exceptional 24.5% |
| Immigrants | Thailand | 94.9 /100 | #121 | Exceptional 24.5% |
| Apache | 94.8 /100 | #122 | Exceptional 24.5% |
| Natives/Alaskans | 94.6 /100 | #123 | Exceptional 24.6% |
| Immigrants | South America | 93.9 /100 | #124 | Exceptional 24.6% |
| Spanish Americans | 93.8 /100 | #125 | Exceptional 24.6% |
| Immigrants | Uruguay | 93.8 /100 | #126 | Exceptional 24.6% |
| German Russians | 93.7 /100 | #127 | Exceptional 24.6% |
| Immigrants | Central America | 93.5 /100 | #128 | Exceptional 24.6% |
| Yup'ik | 93.3 /100 | #129 | Exceptional 24.7% |
| Alsatians | 93.2 /100 | #130 | Exceptional 24.7% |
| Immigrants | Philippines | 93.0 /100 | #131 | Exceptional 24.7% |
| Immigrants | Costa Rica | 92.4 /100 | #132 | Exceptional 24.7% |
| Colombians | 92.4 /100 | #133 | Exceptional 24.7% |
Demographics Similar to Immigrants from St. Vincent and the Grenadines by Wage/Income Gap
In terms of wage/income gap, the demographic groups most similar to Immigrants from St. Vincent and the Grenadines are Immigrants from Grenada (16.2%, a difference of 1.5%), Immigrants from Barbados (17.8%, a difference of 8.6%), British West Indian (18.0%, a difference of 9.7%), Guyanese (18.3%, a difference of 11.5%), and Immigrants from Guyana (18.4%, a difference of 11.8%).
| Demographics | Rating | Rank | Wage/Income Gap |
| Immigrants | Grenada | 100.0 /100 | #1 | Exceptional 16.2% |
| Immigrants | St. Vincent and the Grenadines | 100.0 /100 | #2 | Exceptional 16.4% |
| Immigrants | Barbados | 100.0 /100 | #3 | Exceptional 17.8% |
| British West Indians | 100.0 /100 | #4 | Exceptional 18.0% |
| Guyanese | 100.0 /100 | #5 | Exceptional 18.3% |
| Immigrants | Guyana | 100.0 /100 | #6 | Exceptional 18.4% |
| Puerto Ricans | 100.0 /100 | #7 | Exceptional 18.7% |
| Immigrants | Jamaica | 100.0 /100 | #8 | Exceptional 18.8% |
| Barbadians | 100.0 /100 | #9 | Exceptional 19.0% |
| Crow | 100.0 /100 | #10 | Exceptional 19.1% |
| Immigrants | Haiti | 100.0 /100 | #11 | Exceptional 19.2% |
| Immigrants | West Indies | 100.0 /100 | #12 | Exceptional 19.2% |
| Trinidadians and Tobagonians | 100.0 /100 | #13 | Exceptional 19.3% |
| Immigrants | Trinidad and Tobago | 100.0 /100 | #14 | Exceptional 19.3% |
| West Indians | 100.0 /100 | #15 | Exceptional 19.6% |