Immigrants from Trinidad and Tobago Disability Age Under 5
COMPARE
Immigrants from Trinidad and Tobago
Select to Compare
Disability Age Under 5
Immigrants from Trinidad and Tobago Disability Age Under 5
1.1%
DISABILITY | AGE UNDER 5
98.0/ 100
METRIC RATING
80th/ 347
METRIC RANK
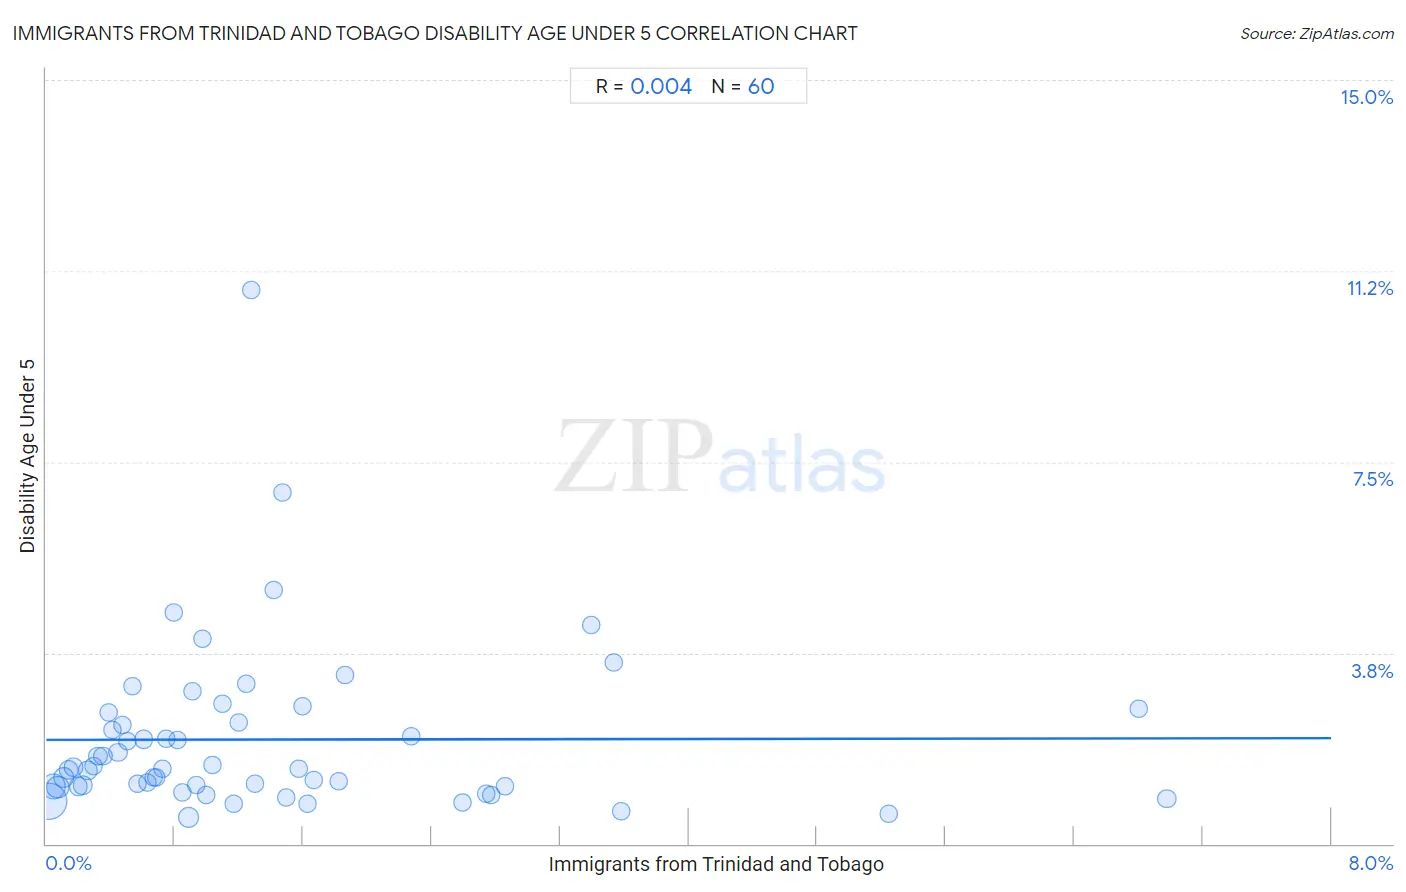
Immigrants from Trinidad and Tobago Disability Age Under 5 Correlation Chart
The statistical analysis conducted on geographies consisting of 139,979,956 people shows no correlation between the proportion of Immigrants from Trinidad and Tobago and percentage of population with a disability under the age of 5 in the United States with a correlation coefficient (R) of 0.004 and weighted average of 1.1%. On average, for every 1% (one percent) increase in Immigrants from Trinidad and Tobago within a typical geography, there is an increase of 0.0045% in percentage of population with a disability under the age of 5.
It is essential to understand that the correlation between the percentage of Immigrants from Trinidad and Tobago and percentage of population with a disability under the age of 5 does not imply a direct cause-and-effect relationship. It remains uncertain whether the presence of Immigrants from Trinidad and Tobago influences an upward or downward trend in the level of percentage of population with a disability under the age of 5 within an area, or if Immigrants from Trinidad and Tobago simply ended up residing in those areas with higher or lower levels of percentage of population with a disability under the age of 5 due to other factors.
Demographics Similar to Immigrants from Trinidad and Tobago by Disability Age Under 5
In terms of disability age under 5, the demographic groups most similar to Immigrants from Trinidad and Tobago are Hmong (1.1%, a difference of 0.020%), Turkish (1.1%, a difference of 0.020%), West Indian (1.1%, a difference of 0.040%), Immigrants from Jordan (1.1%, a difference of 0.13%), and Immigrants from Syria (1.1%, a difference of 0.14%).
| Demographics | Rating | Rank | Disability Age Under 5 |
| Immigrants from Sri Lanka | 98.5 /100 | #73 | Exceptional 1.1% |
| Jordanians | 98.5 /100 | #74 | Exceptional 1.1% |
| Immigrants from Pakistan | 98.4 /100 | #75 | Exceptional 1.1% |
| Immigrants from Burma/Myanmar | 98.2 /100 | #76 | Exceptional 1.1% |
| Immigrants from Denmark | 98.1 /100 | #77 | Exceptional 1.1% |
| West Indians | 98.0 /100 | #78 | Exceptional 1.1% |
| Hmong | 98.0 /100 | #79 | Exceptional 1.1% |
| Immigrants from Trinidad and Tobago | 98.0 /100 | #80 | Exceptional 1.1% |
| Turks | 98.0 /100 | #81 | Exceptional 1.1% |
| Immigrants from Jordan | 97.9 /100 | #82 | Exceptional 1.1% |
| Immigrants from Syria | 97.9 /100 | #83 | Exceptional 1.1% |
| Immigrants from Zaire | 97.8 /100 | #84 | Exceptional 1.1% |
| Sudanese | 97.7 /100 | #85 | Exceptional 1.1% |
| Okinawans | 97.6 /100 | #86 | Exceptional 1.1% |
| Ugandans | 97.5 /100 | #87 | Exceptional 1.1% |
Immigrants from Trinidad and Tobago Disability Age Under 5 Correlation Summary
| Measurement | Immigrants from Trinidad and Tobago Data | Disability Age Under 5 Data |
| Minimum | 0.015% | 0.53% |
| Maximum | 7.0% | 10.9% |
| Range | 7.0% | 10.3% |
| Mean | 1.4% | 2.0% |
| Median | 0.92% | 1.5% |
| Interquartile 25% (IQ1) | 0.46% | 1.1% |
| Interquartile 75% (IQ3) | 1.6% | 2.5% |
| Interquartile Range (IQR) | 1.2% | 1.4% |
| Standard Deviation (Sample) | 1.5% | 1.7% |
| Standard Deviation (Population) | 1.5% | 1.7% |
Correlation Details
| Immigrants from Trinidad and Tobago Percentile | Sample Size | Disability Age Under 5 |
[ 0.0% - 0.5% ] 0.015% | 59,516,746 | 0.82% |
[ 0.0% - 0.5% ] 0.045% | 22,614,659 | 1.1% |
[ 0.0% - 0.5% ] 0.074% | 14,105,572 | 1.1% |
[ 0.0% - 0.5% ] 0.11% | 7,941,650 | 1.3% |
[ 0.0% - 0.5% ] 0.14% | 4,700,148 | 1.4% |
[ 0.0% - 0.5% ] 0.17% | 5,409,616 | 1.5% |
[ 0.0% - 0.5% ] 0.20% | 2,575,763 | 1.1% |
[ 0.0% - 0.5% ] 0.23% | 2,330,057 | 1.1% |
[ 0.0% - 0.5% ] 0.26% | 1,641,233 | 1.4% |
[ 0.0% - 0.5% ] 0.29% | 1,222,851 | 1.5% |
[ 0.0% - 0.5% ] 0.32% | 1,007,520 | 1.7% |
[ 0.0% - 0.5% ] 0.35% | 964,379 | 1.7% |
[ 0.0% - 0.5% ] 0.39% | 466,405 | 2.6% |
[ 0.0% - 0.5% ] 0.41% | 421,494 | 2.2% |
[ 0.0% - 0.5% ] 0.45% | 732,418 | 1.8% |
[ 0.0% - 0.5% ] 0.48% | 240,477 | 2.3% |
[ 0.5% - 1.0% ] 0.51% | 506,574 | 2.0% |
[ 0.5% - 1.0% ] 0.54% | 295,108 | 3.1% |
[ 0.5% - 1.0% ] 0.56% | 86,733 | 1.2% |
[ 0.5% - 1.0% ] 0.61% | 338,618 | 2.1% |
[ 0.5% - 1.0% ] 0.63% | 167,024 | 1.2% |
[ 0.5% - 1.0% ] 0.67% | 797,775 | 1.3% |
[ 0.5% - 1.0% ] 0.69% | 139,221 | 1.3% |
[ 0.5% - 1.0% ] 0.73% | 61,258 | 1.5% |
[ 0.5% - 1.0% ] 0.75% | 35,318 | 2.1% |
[ 0.5% - 1.0% ] 0.79% | 49,320 | 4.5% |
[ 0.5% - 1.0% ] 0.82% | 100,169 | 2.0% |
[ 0.5% - 1.0% ] 0.85% | 547,391 | 1.0% |
[ 0.5% - 1.0% ] 0.89% | 8,899,983 | 0.53% |
[ 0.5% - 1.0% ] 0.91% | 108,324 | 3.0% |
[ 0.5% - 1.0% ] 0.93% | 95,165 | 1.2% |
[ 0.5% - 1.0% ] 0.97% | 109,383 | 4.0% |
[ 0.5% - 1.0% ] 1.00% | 201,684 | 0.96% |
[ 1.0% - 1.5% ] 1.03% | 91,738 | 1.5% |
[ 1.0% - 1.5% ] 1.10% | 38,301 | 2.7% |
[ 1.0% - 1.5% ] 1.17% | 37,274 | 0.78% |
[ 1.0% - 1.5% ] 1.20% | 60,471 | 2.4% |
[ 1.0% - 1.5% ] 1.24% | 116,088 | 3.1% |
[ 1.0% - 1.5% ] 1.28% | 625 | 10.9% |
[ 1.0% - 1.5% ] 1.30% | 130,965 | 1.2% |
[ 1.0% - 1.5% ] 1.41% | 9,197 | 5.0% |
[ 1.0% - 1.5% ] 1.47% | 6,132 | 6.9% |
[ 1.0% - 1.5% ] 1.50% | 133,235 | 0.92% |
[ 1.5% - 2.0% ] 1.57% | 35,082 | 1.5% |
[ 1.5% - 2.0% ] 1.60% | 40,489 | 2.7% |
[ 1.5% - 2.0% ] 1.63% | 31,200 | 0.79% |
[ 1.5% - 2.0% ] 1.67% | 51,092 | 1.3% |
[ 1.5% - 2.0% ] 1.82% | 108,180 | 1.2% |
[ 1.5% - 2.0% ] 1.86% | 43,396 | 3.3% |
[ 2.0% - 2.5% ] 2.27% | 15,511 | 2.1% |
[ 2.5% - 3.0% ] 2.59% | 62,373 | 0.80% |
[ 2.5% - 3.0% ] 2.74% | 108,992 | 0.99% |
[ 2.5% - 3.0% ] 2.77% | 38,865 | 0.95% |
[ 2.5% - 3.0% ] 2.86% | 44,832 | 1.1% |
[ 3.0% - 3.5% ] 3.39% | 29,820 | 4.3% |
[ 3.5% - 4.0% ] 3.53% | 27,845 | 3.6% |
[ 3.5% - 4.0% ] 3.58% | 100,082 | 0.65% |
[ 5.0% - 5.5% ] 5.24% | 58,476 | 0.59% |
[ 6.5% - 7.0% ] 6.80% | 51,153 | 2.7% |
[ 6.5% - 7.0% ] 6.98% | 78,506 | 0.89% |