Immigrants from Trinidad and Tobago Self-Care Disability
COMPARE
Immigrants from Trinidad and Tobago
Select to Compare
Self-Care Disability
Immigrants from Trinidad and Tobago Self-Care Disability
2.7%
SELF-CARE DISABILITY
0.1/ 100
METRIC RATING
275th/ 347
METRIC RANK
Immigrants from Trinidad and Tobago Self-Care Disability Correlation Chart
The statistical analysis conducted on geographies consisting of 223,419,964 people shows a slight positive correlation between the proportion of Immigrants from Trinidad and Tobago and percentage of population with self-care disability in the United States with a correlation coefficient (R) of 0.067 and weighted average of 2.7%. On average, for every 1% (one percent) increase in Immigrants from Trinidad and Tobago within a typical geography, there is an increase of 0.029% in percentage of population with self-care disability.
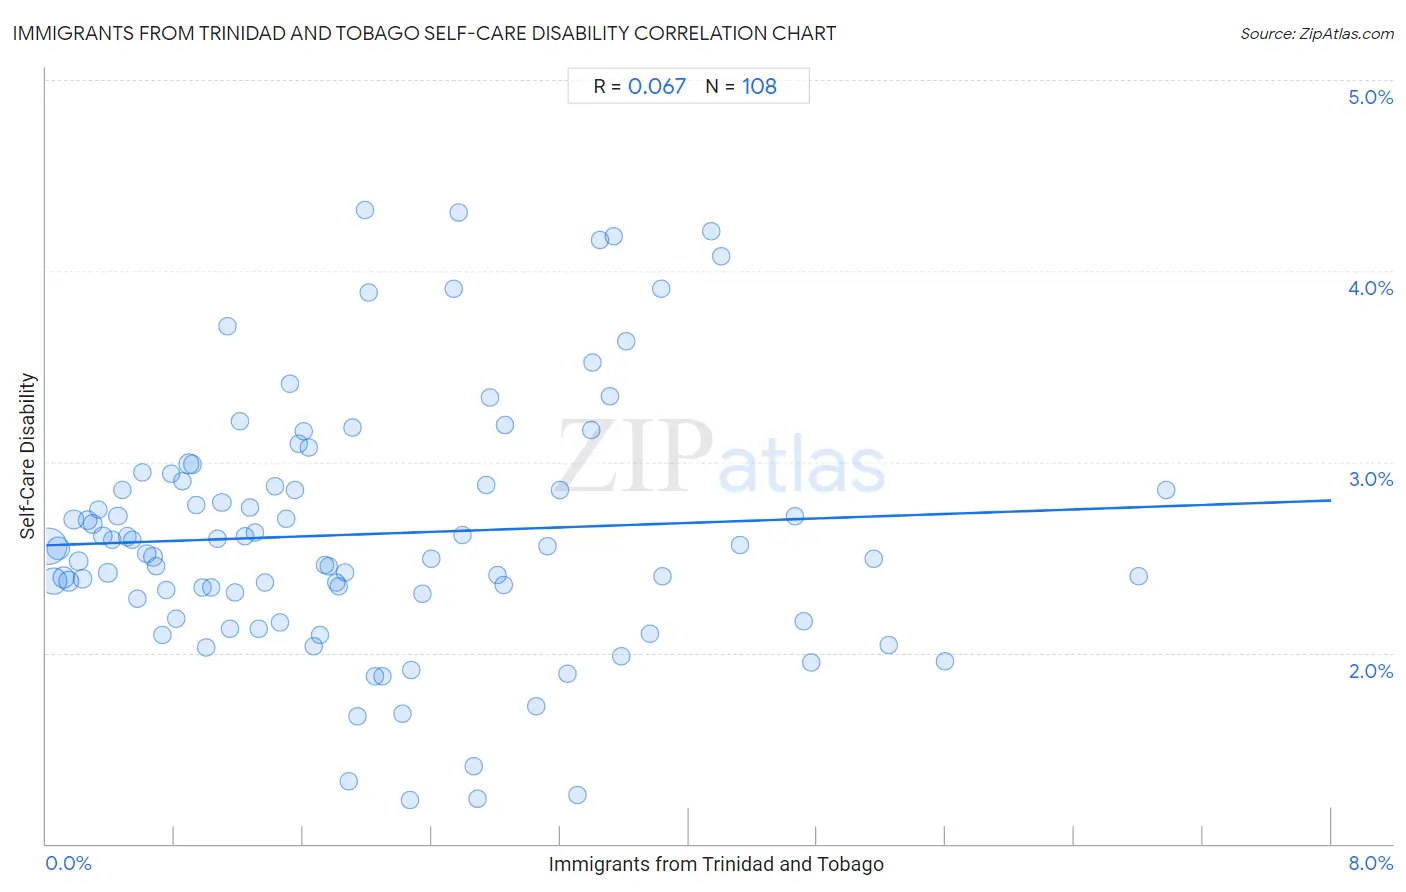
It is essential to understand that the correlation between the percentage of Immigrants from Trinidad and Tobago and percentage of population with self-care disability does not imply a direct cause-and-effect relationship. It remains uncertain whether the presence of Immigrants from Trinidad and Tobago influences an upward or downward trend in the level of percentage of population with self-care disability within an area, or if Immigrants from Trinidad and Tobago simply ended up residing in those areas with higher or lower levels of percentage of population with self-care disability due to other factors.
Demographics Similar to Immigrants from Trinidad and Tobago by Self-Care Disability
In terms of self-care disability, the demographic groups most similar to Immigrants from Trinidad and Tobago are Yakama (2.7%, a difference of 0.0%), Mexican (2.7%, a difference of 0.060%), Japanese (2.7%, a difference of 0.13%), Immigrants from Ukraine (2.7%, a difference of 0.19%), and Immigrants from Laos (2.7%, a difference of 0.20%).
| Demographics | Rating | Rank | Self-Care Disability |
| Immigrants from Mexico | 0.1 /100 | #268 | Tragic 2.7% |
| U.S. Virgin Islanders | 0.1 /100 | #269 | Tragic 2.7% |
| Immigrants from Micronesia | 0.1 /100 | #270 | Tragic 2.7% |
| Trinidadians and Tobagonians | 0.1 /100 | #271 | Tragic 2.7% |
| Immigrants from Laos | 0.1 /100 | #272 | Tragic 2.7% |
| Mexicans | 0.1 /100 | #273 | Tragic 2.7% |
| Yakama | 0.1 /100 | #274 | Tragic 2.7% |
| Immigrants from Trinidad and Tobago | 0.1 /100 | #275 | Tragic 2.7% |
| Japanese | 0.1 /100 | #276 | Tragic 2.7% |
| Immigrants from Ukraine | 0.1 /100 | #277 | Tragic 2.7% |
| Ottawa | 0.1 /100 | #278 | Tragic 2.7% |
| Iroquois | 0.1 /100 | #279 | Tragic 2.7% |
| Hispanics or Latinos | 0.1 /100 | #280 | Tragic 2.7% |
| Immigrants from Iraq | 0.0 /100 | #281 | Tragic 2.7% |
| Apache | 0.0 /100 | #282 | Tragic 2.7% |
Immigrants from Trinidad and Tobago Self-Care Disability Correlation Summary
| Measurement | Immigrants from Trinidad and Tobago Data | Self-Care Disability Data |
| Minimum | 0.016% | 1.2% |
| Maximum | 7.0% | 4.3% |
| Range | 7.0% | 3.1% |
| Mean | 2.0% | 2.6% |
| Median | 1.7% | 2.6% |
| Interquartile 25% (IQ1) | 0.83% | 2.3% |
| Interquartile 75% (IQ3) | 2.9% | 2.9% |
| Interquartile Range (IQR) | 2.0% | 0.59% |
| Standard Deviation (Sample) | 1.5% | 0.66% |
| Standard Deviation (Population) | 1.5% | 0.66% |
Correlation Details
| Immigrants from Trinidad and Tobago Percentile | Sample Size | Self-Care Disability |
[ 0.0% - 0.5% ] 0.016% | 75,514,790 | 2.6% |
[ 0.0% - 0.5% ] 0.045% | 36,376,879 | 2.4% |
[ 0.0% - 0.5% ] 0.075% | 23,585,102 | 2.5% |
[ 0.0% - 0.5% ] 0.11% | 15,382,219 | 2.4% |
[ 0.0% - 0.5% ] 0.14% | 10,201,010 | 2.4% |
[ 0.0% - 0.5% ] 0.17% | 9,351,437 | 2.7% |
[ 0.0% - 0.5% ] 0.20% | 5,509,520 | 2.5% |
[ 0.0% - 0.5% ] 0.23% | 4,979,339 | 2.4% |
[ 0.0% - 0.5% ] 0.26% | 3,817,714 | 2.7% |
[ 0.0% - 0.5% ] 0.29% | 3,180,976 | 2.7% |
[ 0.0% - 0.5% ] 0.32% | 2,894,097 | 2.8% |
[ 0.0% - 0.5% ] 0.35% | 2,697,939 | 2.6% |
[ 0.0% - 0.5% ] 0.38% | 2,156,435 | 2.4% |
[ 0.0% - 0.5% ] 0.41% | 1,770,541 | 2.6% |
[ 0.0% - 0.5% ] 0.45% | 1,813,018 | 2.7% |
[ 0.0% - 0.5% ] 0.47% | 1,002,315 | 2.9% |
[ 0.5% - 1.0% ] 0.51% | 1,257,814 | 2.6% |
[ 0.5% - 1.0% ] 0.54% | 1,372,681 | 2.6% |
[ 0.5% - 1.0% ] 0.57% | 623,153 | 2.3% |
[ 0.5% - 1.0% ] 0.60% | 639,552 | 2.9% |
[ 0.5% - 1.0% ] 0.63% | 614,837 | 2.5% |
[ 0.5% - 1.0% ] 0.66% | 1,012,234 | 2.5% |
[ 0.5% - 1.0% ] 0.69% | 525,449 | 2.5% |
[ 0.5% - 1.0% ] 0.72% | 307,022 | 2.1% |
[ 0.5% - 1.0% ] 0.75% | 210,552 | 2.3% |
[ 0.5% - 1.0% ] 0.78% | 431,028 | 2.9% |
[ 0.5% - 1.0% ] 0.81% | 379,641 | 2.2% |
[ 0.5% - 1.0% ] 0.85% | 779,599 | 2.9% |
[ 0.5% - 1.0% ] 0.89% | 9,105,879 | 3.0% |
[ 0.5% - 1.0% ] 0.91% | 253,348 | 3.0% |
[ 0.5% - 1.0% ] 0.94% | 154,761 | 2.8% |
[ 0.5% - 1.0% ] 0.97% | 201,660 | 2.3% |
[ 0.5% - 1.0% ] 1.00% | 251,033 | 2.0% |
[ 1.0% - 1.5% ] 1.02% | 271,131 | 2.3% |
[ 1.0% - 1.5% ] 1.06% | 129,020 | 2.6% |
[ 1.0% - 1.5% ] 1.09% | 295,756 | 2.8% |
[ 1.0% - 1.5% ] 1.13% | 114,448 | 3.7% |
[ 1.0% - 1.5% ] 1.14% | 104,411 | 2.1% |
[ 1.0% - 1.5% ] 1.18% | 271,442 | 2.3% |
[ 1.0% - 1.5% ] 1.20% | 82,351 | 3.2% |
[ 1.0% - 1.5% ] 1.24% | 259,713 | 2.6% |
[ 1.0% - 1.5% ] 1.27% | 78,880 | 2.8% |
[ 1.0% - 1.5% ] 1.30% | 259,326 | 2.6% |
[ 1.0% - 1.5% ] 1.32% | 22,063 | 2.1% |
[ 1.0% - 1.5% ] 1.36% | 51,452 | 2.4% |
[ 1.0% - 1.5% ] 1.42% | 110,190 | 2.9% |
[ 1.0% - 1.5% ] 1.45% | 75,816 | 2.2% |
[ 1.0% - 1.5% ] 1.49% | 159,013 | 2.7% |
[ 1.5% - 2.0% ] 1.52% | 28,375 | 3.4% |
[ 1.5% - 2.0% ] 1.55% | 131,172 | 2.9% |
[ 1.5% - 2.0% ] 1.57% | 36,359 | 3.1% |
[ 1.5% - 2.0% ] 1.60% | 100,450 | 3.2% |
[ 1.5% - 2.0% ] 1.63% | 35,744 | 3.1% |
[ 1.5% - 2.0% ] 1.67% | 56,182 | 2.0% |
[ 1.5% - 2.0% ] 1.70% | 47,515 | 2.1% |
[ 1.5% - 2.0% ] 1.73% | 40,484 | 2.5% |
[ 1.5% - 2.0% ] 1.76% | 145,080 | 2.5% |
[ 1.5% - 2.0% ] 1.80% | 20,336 | 2.4% |
[ 1.5% - 2.0% ] 1.82% | 115,966 | 2.4% |
[ 1.5% - 2.0% ] 1.86% | 43,396 | 2.4% |
[ 1.5% - 2.0% ] 1.89% | 10,821 | 1.3% |
[ 1.5% - 2.0% ] 1.90% | 29,348 | 3.2% |
[ 1.5% - 2.0% ] 1.94% | 55,114 | 1.7% |
[ 1.5% - 2.0% ] 1.98% | 55,336 | 4.3% |
[ 2.0% - 2.5% ] 2.01% | 40,738 | 3.9% |
[ 2.0% - 2.5% ] 2.05% | 52,000 | 1.9% |
[ 2.0% - 2.5% ] 2.09% | 47,691 | 1.9% |
[ 2.0% - 2.5% ] 2.22% | 4,910 | 1.7% |
[ 2.0% - 2.5% ] 2.27% | 7,104 | 1.2% |
[ 2.0% - 2.5% ] 2.27% | 18,470 | 1.9% |
[ 2.0% - 2.5% ] 2.34% | 898 | 2.3% |
[ 2.0% - 2.5% ] 2.40% | 65,645 | 2.5% |
[ 2.5% - 3.0% ] 2.54% | 2,720 | 3.9% |
[ 2.5% - 3.0% ] 2.57% | 96,801 | 4.3% |
[ 2.5% - 3.0% ] 2.59% | 189,692 | 2.6% |
[ 2.5% - 3.0% ] 2.66% | 10,526 | 1.4% |
[ 2.5% - 3.0% ] 2.68% | 5,740 | 1.2% |
[ 2.5% - 3.0% ] 2.74% | 108,992 | 2.9% |
[ 2.5% - 3.0% ] 2.77% | 79,458 | 3.3% |
[ 2.5% - 3.0% ] 2.81% | 32,296 | 2.4% |
[ 2.5% - 3.0% ] 2.85% | 6,529 | 2.4% |
[ 2.5% - 3.0% ] 2.86% | 66,543 | 3.2% |
[ 3.0% - 3.5% ] 3.05% | 17,400 | 1.7% |
[ 3.0% - 3.5% ] 3.12% | 83,125 | 2.6% |
[ 3.0% - 3.5% ] 3.20% | 9,011 | 2.9% |
[ 3.0% - 3.5% ] 3.24% | 1,726 | 1.9% |
[ 3.0% - 3.5% ] 3.31% | 1,510 | 1.3% |
[ 3.0% - 3.5% ] 3.39% | 29,820 | 3.2% |
[ 3.0% - 3.5% ] 3.40% | 69,131 | 3.5% |
[ 3.0% - 3.5% ] 3.45% | 55,143 | 4.2% |
[ 3.5% - 4.0% ] 3.51% | 84,006 | 3.3% |
[ 3.5% - 4.0% ] 3.53% | 27,845 | 4.2% |
[ 3.5% - 4.0% ] 3.58% | 100,082 | 2.0% |
[ 3.5% - 4.0% ] 3.61% | 3,270 | 3.6% |
[ 3.5% - 4.0% ] 3.76% | 585 | 2.1% |
[ 3.5% - 4.0% ] 3.83% | 58,396 | 3.9% |
[ 3.5% - 4.0% ] 3.84% | 5,938 | 2.4% |
[ 4.0% - 4.5% ] 4.14% | 8,260 | 4.2% |
[ 4.0% - 4.5% ] 4.20% | 8,779 | 4.1% |
[ 4.0% - 4.5% ] 4.32% | 21,349 | 2.6% |
[ 4.5% - 5.0% ] 4.66% | 63,426 | 2.7% |
[ 4.5% - 5.0% ] 4.72% | 101,648 | 2.2% |
[ 4.5% - 5.0% ] 4.77% | 2,980 | 2.0% |
[ 5.0% - 5.5% ] 5.15% | 2,231 | 2.5% |
[ 5.0% - 5.5% ] 5.24% | 58,476 | 2.0% |
[ 5.5% - 6.0% ] 5.59% | 1,055 | 2.0% |
[ 6.5% - 7.0% ] 6.80% | 99,249 | 2.4% |
[ 6.5% - 7.0% ] 6.98% | 78,506 | 2.9% |