Immigrants from Trinidad and Tobago vs Immigrants from West Indies Wage/Income Gap
COMPARE
Immigrants from Trinidad and Tobago
Immigrants from West Indies
Wage/Income Gap
Wage/Income Gap Comparison
Immigrants from Trinidad and Tobago
Immigrants from West Indies
19.3%
WAGE/INCOME GAP
100.0/ 100
METRIC RATING
14th/ 347
METRIC RANK
19.2%
WAGE/INCOME GAP
100.0/ 100
METRIC RATING
12th/ 347
METRIC RANK
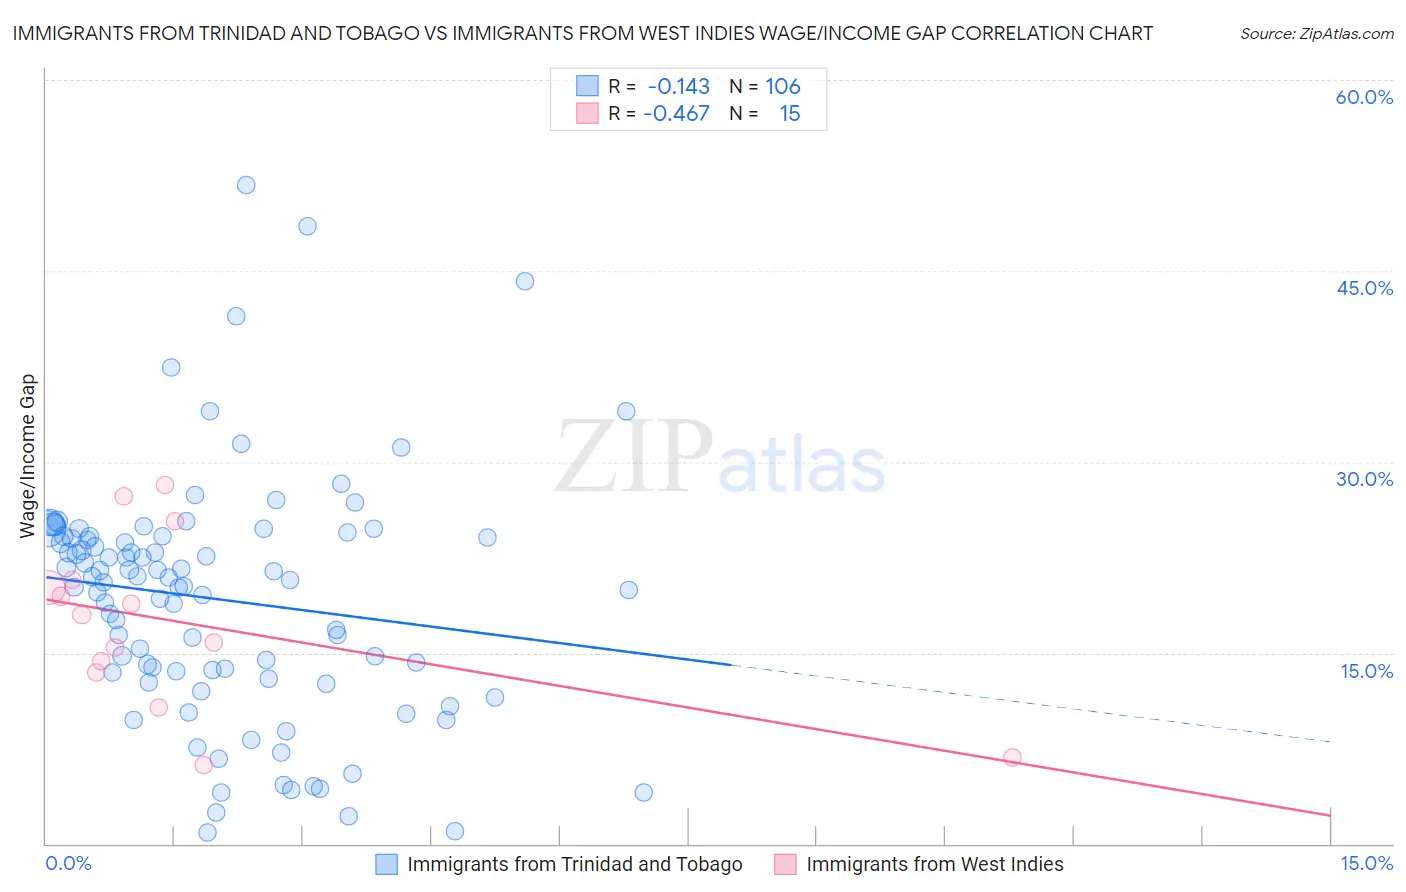
Immigrants from Trinidad and Tobago vs Immigrants from West Indies Wage/Income Gap Correlation Chart
The statistical analysis conducted on geographies consisting of 223,459,768 people shows a poor negative correlation between the proportion of Immigrants from Trinidad and Tobago and wage/income gap percentage in the United States with a correlation coefficient (R) of -0.143 and weighted average of 19.3%. Similarly, the statistical analysis conducted on geographies consisting of 72,447,771 people shows a moderate negative correlation between the proportion of Immigrants from West Indies and wage/income gap percentage in the United States with a correlation coefficient (R) of -0.467 and weighted average of 19.2%, a difference of 0.53%.
Wage/Income Gap Correlation Summary
| Measurement | Immigrants from Trinidad and Tobago | Immigrants from West Indies |
| Minimum | 0.88% | 6.2% |
| Maximum | 51.8% | 28.2% |
| Range | 50.9% | 21.9% |
| Mean | 19.2% | 17.4% |
| Median | 20.6% | 18.0% |
| Interquartile 25% (IQ1) | 13.4% | 13.4% |
| Interquartile 75% (IQ3) | 24.1% | 20.7% |
| Interquartile Range (IQR) | 10.7% | 7.3% |
| Standard Deviation (Sample) | 9.5% | 6.6% |
| Standard Deviation (Population) | 9.5% | 6.4% |
Demographics Similar to Immigrants from Trinidad and Tobago and Immigrants from West Indies by Wage/Income Gap
In terms of wage/income gap, the demographic groups most similar to Immigrants from Trinidad and Tobago are Trinidadian and Tobagonian (19.3%, a difference of 0.050%), Immigrants from Haiti (19.2%, a difference of 0.64%), West Indian (19.6%, a difference of 1.2%), Jamaican (19.6%, a difference of 1.3%), and Crow (19.1%, a difference of 1.4%). Similarly, the demographic groups most similar to Immigrants from West Indies are Immigrants from Haiti (19.2%, a difference of 0.11%), Trinidadian and Tobagonian (19.3%, a difference of 0.48%), Crow (19.1%, a difference of 0.90%), Barbadian (19.0%, a difference of 1.4%), and West Indian (19.6%, a difference of 1.7%).
| Demographics | Rating | Rank | Wage/Income Gap |
| Immigrants | Barbados | 100.0 /100 | #3 | Exceptional 17.8% |
| British West Indians | 100.0 /100 | #4 | Exceptional 18.0% |
| Guyanese | 100.0 /100 | #5 | Exceptional 18.3% |
| Immigrants | Guyana | 100.0 /100 | #6 | Exceptional 18.4% |
| Puerto Ricans | 100.0 /100 | #7 | Exceptional 18.7% |
| Immigrants | Jamaica | 100.0 /100 | #8 | Exceptional 18.8% |
| Barbadians | 100.0 /100 | #9 | Exceptional 19.0% |
| Crow | 100.0 /100 | #10 | Exceptional 19.1% |
| Immigrants | Haiti | 100.0 /100 | #11 | Exceptional 19.2% |
| Immigrants | West Indies | 100.0 /100 | #12 | Exceptional 19.2% |
| Trinidadians and Tobagonians | 100.0 /100 | #13 | Exceptional 19.3% |
| Immigrants | Trinidad and Tobago | 100.0 /100 | #14 | Exceptional 19.3% |
| West Indians | 100.0 /100 | #15 | Exceptional 19.6% |
| Jamaicans | 100.0 /100 | #16 | Exceptional 19.6% |
| Haitians | 100.0 /100 | #17 | Exceptional 19.7% |
| Hopi | 100.0 /100 | #18 | Exceptional 20.0% |
| Immigrants | Dominica | 100.0 /100 | #19 | Exceptional 20.0% |
| Bahamians | 100.0 /100 | #20 | Exceptional 20.2% |
| Immigrants | Caribbean | 100.0 /100 | #21 | Exceptional 20.4% |
| Immigrants | Liberia | 100.0 /100 | #22 | Exceptional 20.6% |
| Immigrants | Dominican Republic | 100.0 /100 | #23 | Exceptional 20.6% |