Immigrants from Russia Married-couple Households
COMPARE
Immigrants from Russia
Select to Compare
Married-couple Households
Immigrants from Russia Married-couple Households
47.0%
MARRIED-COUPLE HOUSEHOLDS
77.6/ 100
METRIC RATING
150th/ 347
METRIC RANK
Immigrants from Russia Married-couple Households Correlation Chart
The statistical analysis conducted on geographies consisting of 347,712,373 people shows a poor positive correlation between the proportion of Immigrants from Russia and percentage of married-couple family households in the United States with a correlation coefficient (R) of 0.187 and weighted average of 47.0%. On average, for every 1% (one percent) increase in Immigrants from Russia within a typical geography, there is an increase of 0.41% in percentage of married-couple family households.
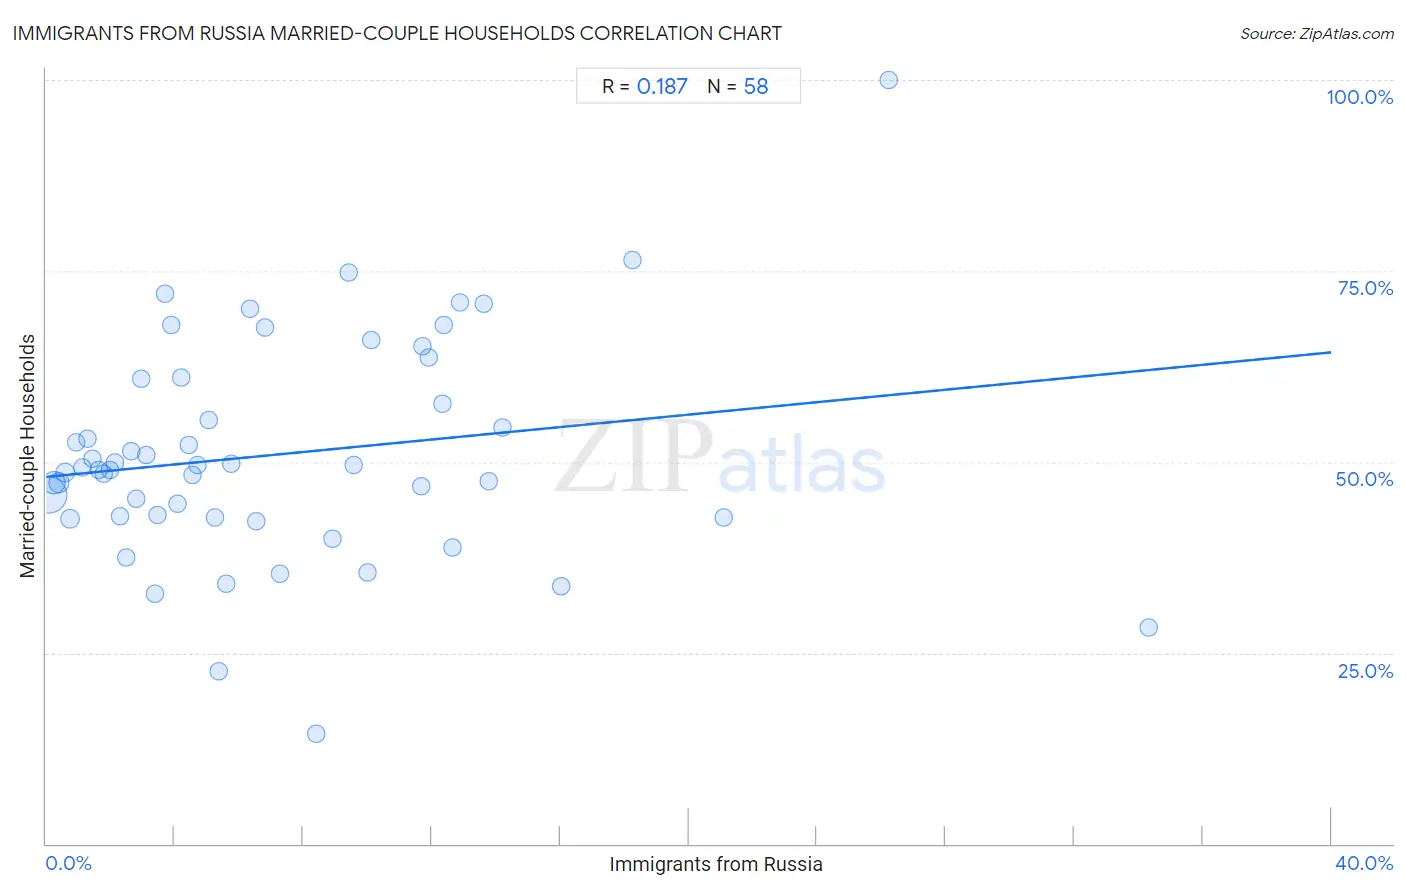
It is essential to understand that the correlation between the percentage of Immigrants from Russia and percentage of married-couple family households does not imply a direct cause-and-effect relationship. It remains uncertain whether the presence of Immigrants from Russia influences an upward or downward trend in the level of percentage of married-couple family households within an area, or if Immigrants from Russia simply ended up residing in those areas with higher or lower levels of percentage of married-couple family households due to other factors.
Demographics Similar to Immigrants from Russia by Married-couple Households
In terms of married-couple households, the demographic groups most similar to Immigrants from Russia are Immigrants from Bulgaria (47.0%, a difference of 0.050%), Paraguayan (47.0%, a difference of 0.060%), Serbian (47.0%, a difference of 0.070%), Hmong (47.0%, a difference of 0.080%), and Immigrants from Western Asia (46.9%, a difference of 0.080%).
| Demographics | Rating | Rank | Married-couple Households |
| Immigrants from Belarus | 83.8 /100 | #143 | Excellent 47.2% |
| Mexicans | 83.4 /100 | #144 | Excellent 47.1% |
| Slovenes | 81.7 /100 | #145 | Excellent 47.1% |
| Immigrants from Western Europe | 81.6 /100 | #146 | Excellent 47.1% |
| Immigrants from Syria | 81.6 /100 | #147 | Excellent 47.1% |
| Icelanders | 79.5 /100 | #148 | Good 47.0% |
| Paraguayans | 78.7 /100 | #149 | Good 47.0% |
| Immigrants from Russia | 77.6 /100 | #150 | Good 47.0% |
| Immigrants from Bulgaria | 76.8 /100 | #151 | Good 47.0% |
| Serbians | 76.3 /100 | #152 | Good 47.0% |
| Hmong | 76.2 /100 | #153 | Good 47.0% |
| Immigrants from Western Asia | 76.1 /100 | #154 | Good 46.9% |
| Arabs | 76.0 /100 | #155 | Good 46.9% |
| Armenians | 75.4 /100 | #156 | Good 46.9% |
| Immigrants from Oceania | 74.8 /100 | #157 | Good 46.9% |
Immigrants from Russia Married-couple Households Correlation Summary
| Measurement | Immigrants from Russia Data | Married-couple Households Data |
| Minimum | 0.071% | 14.4% |
| Maximum | 34.3% | 100.0% |
| Range | 34.2% | 85.6% |
| Mean | 7.2% | 51.0% |
| Median | 5.2% | 49.1% |
| Interquartile 25% (IQ1) | 2.5% | 42.8% |
| Interquartile 75% (IQ3) | 11.7% | 60.9% |
| Interquartile Range (IQR) | 9.2% | 18.1% |
| Standard Deviation (Sample) | 6.7% | 14.5% |
| Standard Deviation (Population) | 6.6% | 14.4% |
Correlation Details
| Immigrants from Russia Percentile | Sample Size | Married-couple Households |
[ 0.0% - 0.5% ] 0.071% | 227,476,201 | 45.7% |
[ 0.0% - 0.5% ] 0.24% | 56,821,541 | 47.3% |
[ 0.0% - 0.5% ] 0.40% | 25,617,966 | 47.3% |
[ 0.5% - 1.0% ] 0.60% | 12,697,608 | 48.6% |
[ 0.5% - 1.0% ] 0.73% | 14,341,749 | 42.5% |
[ 0.5% - 1.0% ] 0.94% | 3,304,702 | 52.5% |
[ 1.0% - 1.5% ] 1.12% | 1,873,118 | 49.3% |
[ 1.0% - 1.5% ] 1.28% | 1,530,335 | 53.0% |
[ 1.0% - 1.5% ] 1.45% | 1,150,650 | 50.5% |
[ 1.5% - 2.0% ] 1.62% | 725,648 | 48.9% |
[ 1.5% - 2.0% ] 1.78% | 289,708 | 48.5% |
[ 1.5% - 2.0% ] 1.99% | 232,677 | 49.0% |
[ 2.0% - 2.5% ] 2.13% | 274,460 | 49.9% |
[ 2.0% - 2.5% ] 2.30% | 150,263 | 42.9% |
[ 2.0% - 2.5% ] 2.49% | 120,260 | 37.5% |
[ 2.5% - 3.0% ] 2.66% | 182,256 | 51.4% |
[ 2.5% - 3.0% ] 2.81% | 263,100 | 45.1% |
[ 2.5% - 3.0% ] 2.97% | 133,358 | 60.9% |
[ 3.0% - 3.5% ] 3.12% | 128,379 | 50.9% |
[ 3.0% - 3.5% ] 3.38% | 11,700 | 32.7% |
[ 3.0% - 3.5% ] 3.46% | 52,850 | 43.0% |
[ 3.5% - 4.0% ] 3.68% | 9,462 | 72.0% |
[ 3.5% - 4.0% ] 3.89% | 5,292 | 68.0% |
[ 4.0% - 4.5% ] 4.07% | 23,266 | 44.5% |
[ 4.0% - 4.5% ] 4.19% | 22,161 | 61.1% |
[ 4.0% - 4.5% ] 4.44% | 2,768 | 52.2% |
[ 4.5% - 5.0% ] 4.54% | 1,321 | 48.3% |
[ 4.5% - 5.0% ] 4.70% | 4,064 | 49.6% |
[ 5.0% - 5.5% ] 5.06% | 9,047 | 55.5% |
[ 5.0% - 5.5% ] 5.25% | 22,677 | 42.7% |
[ 5.0% - 5.5% ] 5.36% | 261 | 22.6% |
[ 5.5% - 6.0% ] 5.58% | 2,704 | 34.1% |
[ 5.5% - 6.0% ] 5.77% | 81,109 | 49.7% |
[ 6.0% - 6.5% ] 6.35% | 63 | 70.0% |
[ 6.5% - 7.0% ] 6.53% | 1,990 | 42.2% |
[ 6.5% - 7.0% ] 6.83% | 1,318 | 67.7% |
[ 7.0% - 7.5% ] 7.28% | 47,893 | 35.3% |
[ 8.0% - 8.5% ] 8.39% | 155 | 14.4% |
[ 8.5% - 9.0% ] 8.89% | 2,564 | 40.0% |
[ 9.0% - 9.5% ] 9.41% | 574 | 74.8% |
[ 9.5% - 10.0% ] 9.59% | 1,523 | 49.6% |
[ 10.0% - 10.5% ] 10.00% | 80 | 35.5% |
[ 10.0% - 10.5% ] 10.13% | 3,338 | 65.9% |
[ 11.5% - 12.0% ] 11.66% | 83,069 | 46.8% |
[ 11.5% - 12.0% ] 11.73% | 341 | 65.1% |
[ 11.5% - 12.0% ] 11.90% | 462 | 63.7% |
[ 12.0% - 12.5% ] 12.34% | 154 | 57.5% |
[ 12.0% - 12.5% ] 12.36% | 437 | 68.0% |
[ 12.5% - 13.0% ] 12.64% | 1,543 | 38.8% |
[ 12.5% - 13.0% ] 12.88% | 427 | 70.9% |
[ 13.5% - 14.0% ] 13.61% | 1,102 | 70.8% |
[ 13.5% - 14.0% ] 13.77% | 138 | 47.4% |
[ 14.0% - 14.5% ] 14.19% | 867 | 54.5% |
[ 16.0% - 16.5% ] 16.02% | 181 | 33.7% |
[ 18.0% - 18.5% ] 18.25% | 126 | 76.5% |
[ 21.0% - 21.5% ] 21.10% | 891 | 42.8% |
[ 26.0% - 26.5% ] 26.24% | 202 | 100.0% |
[ 34.0% - 34.5% ] 34.31% | 274 | 28.4% |