Immigrants from Russia Disability Age 5 to 17
COMPARE
Immigrants from Russia
Select to Compare
Disability Age 5 to 17
Immigrants from Russia Disability Age 5 to 17
5.0%
DISABILITY | AGE 5 TO 17
100.0/ 100
METRIC RATING
43rd/ 347
METRIC RANK
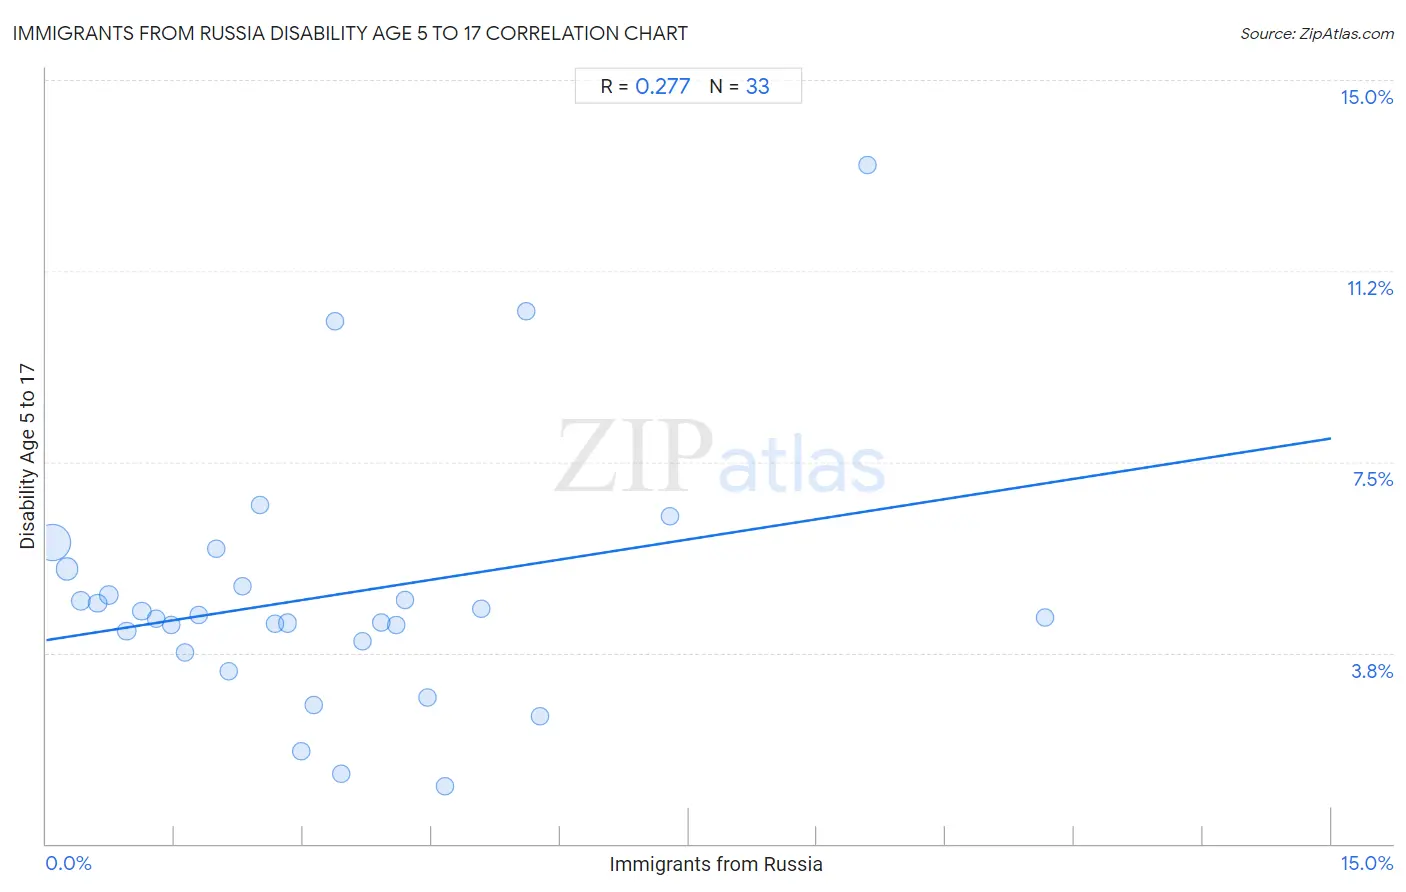
Immigrants from Russia Disability Age 5 to 17 Correlation Chart
The statistical analysis conducted on geographies consisting of 345,279,670 people shows a weak positive correlation between the proportion of Immigrants from Russia and percentage of population with a disability between the ages 5 and 17 in the United States with a correlation coefficient (R) of 0.277 and weighted average of 5.0%. On average, for every 1% (one percent) increase in Immigrants from Russia within a typical geography, there is an increase of 0.26% in percentage of population with a disability between the ages 5 and 17.
It is essential to understand that the correlation between the percentage of Immigrants from Russia and percentage of population with a disability between the ages 5 and 17 does not imply a direct cause-and-effect relationship. It remains uncertain whether the presence of Immigrants from Russia influences an upward or downward trend in the level of percentage of population with a disability between the ages 5 and 17 within an area, or if Immigrants from Russia simply ended up residing in those areas with higher or lower levels of percentage of population with a disability between the ages 5 and 17 due to other factors.
Demographics Similar to Immigrants from Russia by Disability Age 5 to 17
In terms of disability age 5 to 17, the demographic groups most similar to Immigrants from Russia are Egyptian (5.0%, a difference of 0.040%), Tongan (5.0%, a difference of 0.11%), Assyrian/Chaldean/Syriac (5.0%, a difference of 0.18%), Vietnamese (5.1%, a difference of 0.30%), and Immigrants from Sri Lanka (5.0%, a difference of 0.38%).
| Demographics | Rating | Rank | Disability Age 5 to 17 |
| Immigrants from Egypt | 100.0 /100 | #36 | Exceptional 5.0% |
| Immigrants from Belarus | 100.0 /100 | #37 | Exceptional 5.0% |
| Immigrants from Philippines | 100.0 /100 | #38 | Exceptional 5.0% |
| Immigrants from Argentina | 100.0 /100 | #39 | Exceptional 5.0% |
| Okinawans | 100.0 /100 | #40 | Exceptional 5.0% |
| Immigrants from Australia | 100.0 /100 | #41 | Exceptional 5.0% |
| Immigrants from Sri Lanka | 100.0 /100 | #42 | Exceptional 5.0% |
| Immigrants from Russia | 100.0 /100 | #43 | Exceptional 5.0% |
| Egyptians | 100.0 /100 | #44 | Exceptional 5.0% |
| Tongans | 100.0 /100 | #45 | Exceptional 5.0% |
| Assyrians/Chaldeans/Syriacs | 100.0 /100 | #46 | Exceptional 5.0% |
| Vietnamese | 100.0 /100 | #47 | Exceptional 5.1% |
| Koreans | 100.0 /100 | #48 | Exceptional 5.1% |
| Immigrants from Western Asia | 100.0 /100 | #49 | Exceptional 5.1% |
| Argentineans | 99.9 /100 | #50 | Exceptional 5.1% |
Immigrants from Russia Disability Age 5 to 17 Correlation Summary
| Measurement | Immigrants from Russia Data | Disability Age 5 to 17 Data |
| Minimum | 0.071% | 1.1% |
| Maximum | 11.7% | 13.3% |
| Range | 11.6% | 12.2% |
| Mean | 3.3% | 4.9% |
| Median | 2.8% | 4.4% |
| Interquartile 25% (IQ1) | 1.4% | 3.9% |
| Interquartile 75% (IQ3) | 4.3% | 5.2% |
| Interquartile Range (IQR) | 2.9% | 1.4% |
| Standard Deviation (Sample) | 2.6% | 2.5% |
| Standard Deviation (Population) | 2.6% | 2.4% |
Correlation Details
| Immigrants from Russia Percentile | Sample Size | Disability Age 5 to 17 |
[ 0.0% - 0.5% ] 0.071% | 226,896,120 | 5.9% |
[ 0.0% - 0.5% ] 0.24% | 56,178,662 | 5.4% |
[ 0.0% - 0.5% ] 0.40% | 25,328,087 | 4.8% |
[ 0.5% - 1.0% ] 0.60% | 12,447,929 | 4.7% |
[ 0.5% - 1.0% ] 0.73% | 14,189,541 | 4.9% |
[ 0.5% - 1.0% ] 0.94% | 3,196,396 | 4.2% |
[ 1.0% - 1.5% ] 1.12% | 1,792,686 | 4.6% |
[ 1.0% - 1.5% ] 1.28% | 1,472,221 | 4.4% |
[ 1.0% - 1.5% ] 1.45% | 1,090,043 | 4.3% |
[ 1.5% - 2.0% ] 1.62% | 713,093 | 3.8% |
[ 1.5% - 2.0% ] 1.78% | 259,446 | 4.5% |
[ 1.5% - 2.0% ] 1.99% | 198,650 | 5.8% |
[ 2.0% - 2.5% ] 2.13% | 257,292 | 3.4% |
[ 2.0% - 2.5% ] 2.30% | 135,660 | 5.0% |
[ 2.0% - 2.5% ] 2.49% | 113,554 | 6.7% |
[ 2.5% - 3.0% ] 2.67% | 177,052 | 4.3% |
[ 2.5% - 3.0% ] 2.81% | 252,878 | 4.3% |
[ 2.5% - 3.0% ] 2.97% | 129,962 | 1.8% |
[ 3.0% - 3.5% ] 3.12% | 125,417 | 2.7% |
[ 3.0% - 3.5% ] 3.37% | 10,258 | 10.3% |
[ 3.0% - 3.5% ] 3.45% | 45,074 | 1.4% |
[ 3.5% - 4.0% ] 3.69% | 6,447 | 4.0% |
[ 3.5% - 4.0% ] 3.91% | 1,457 | 4.3% |
[ 4.0% - 4.5% ] 4.09% | 19,063 | 4.3% |
[ 4.0% - 4.5% ] 4.19% | 17,669 | 4.8% |
[ 4.0% - 4.5% ] 4.44% | 2,768 | 2.9% |
[ 4.5% - 5.0% ] 4.66% | 1,138 | 1.1% |
[ 5.0% - 5.5% ] 5.08% | 7,049 | 4.6% |
[ 5.5% - 6.0% ] 5.60% | 464 | 10.4% |
[ 5.5% - 6.0% ] 5.77% | 81,109 | 2.5% |
[ 7.0% - 7.5% ] 7.28% | 47,893 | 6.4% |
[ 9.5% - 10.0% ] 9.59% | 1,523 | 13.3% |
[ 11.5% - 12.0% ] 11.66% | 83,069 | 4.4% |