Immigrants from Russia GED/Equivalency
COMPARE
Immigrants from Russia
Select to Compare
GED/Equivalency
Immigrants from Russia GED/Equivalency
87.4%
GED/EQUIVALENCY
97.8/ 100
METRIC RATING
94th/ 347
METRIC RANK
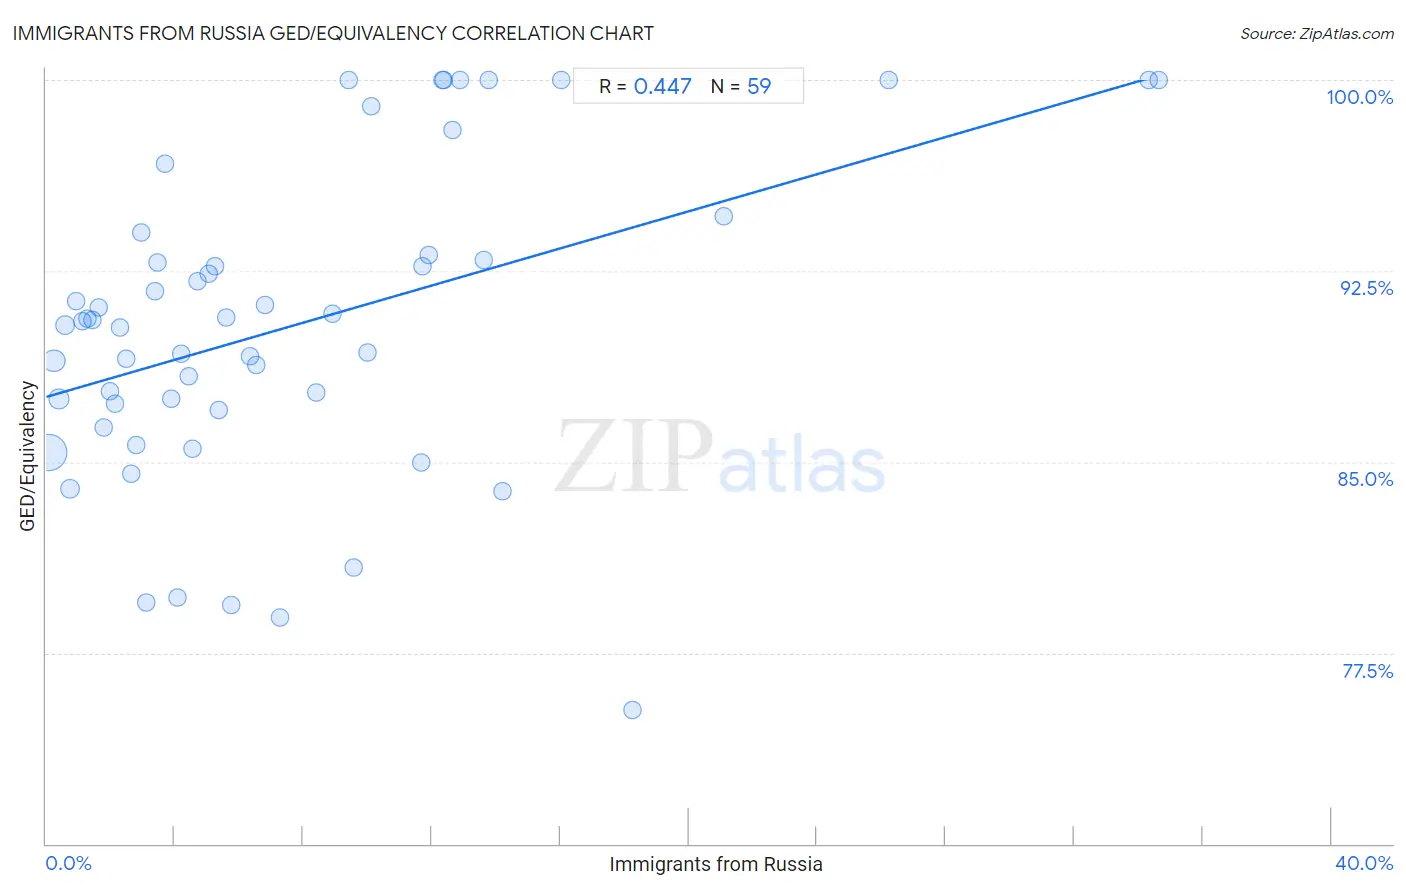
Immigrants from Russia GED/Equivalency Correlation Chart
The statistical analysis conducted on geographies consisting of 347,948,494 people shows a moderate positive correlation between the proportion of Immigrants from Russia and percentage of population with at least ged/equivalency education in the United States with a correlation coefficient (R) of 0.447 and weighted average of 87.4%. On average, for every 1% (one percent) increase in Immigrants from Russia within a typical geography, there is an increase of 0.36% in percentage of population with at least ged/equivalency education.
It is essential to understand that the correlation between the percentage of Immigrants from Russia and percentage of population with at least ged/equivalency education does not imply a direct cause-and-effect relationship. It remains uncertain whether the presence of Immigrants from Russia influences an upward or downward trend in the level of percentage of population with at least ged/equivalency education within an area, or if Immigrants from Russia simply ended up residing in those areas with higher or lower levels of percentage of population with at least ged/equivalency education due to other factors.
Demographics Similar to Immigrants from Russia by GED/Equivalency
In terms of ged/equivalency, the demographic groups most similar to Immigrants from Russia are Immigrants from North Macedonia (87.4%, a difference of 0.0%), Israeli (87.4%, a difference of 0.010%), Immigrants from Eastern Asia (87.4%, a difference of 0.020%), Immigrants from Greece (87.4%, a difference of 0.020%), and Hungarian (87.4%, a difference of 0.030%).
| Demographics | Rating | Rank | GED/Equivalency |
| Native Hawaiians | 98.1 /100 | #87 | Exceptional 87.5% |
| Immigrants from Norway | 98.1 /100 | #88 | Exceptional 87.5% |
| Hungarians | 97.9 /100 | #89 | Exceptional 87.4% |
| Welsh | 97.9 /100 | #90 | Exceptional 87.4% |
| Immigrants from Eastern Asia | 97.9 /100 | #91 | Exceptional 87.4% |
| Israelis | 97.8 /100 | #92 | Exceptional 87.4% |
| Immigrants from North Macedonia | 97.8 /100 | #93 | Exceptional 87.4% |
| Immigrants from Russia | 97.8 /100 | #94 | Exceptional 87.4% |
| Immigrants from Greece | 97.7 /100 | #95 | Exceptional 87.4% |
| Czechoslovakians | 97.6 /100 | #96 | Exceptional 87.4% |
| Immigrants from Western Europe | 97.3 /100 | #97 | Exceptional 87.3% |
| Immigrants from Croatia | 96.9 /100 | #98 | Exceptional 87.3% |
| Immigrants from Belarus | 96.9 /100 | #99 | Exceptional 87.3% |
| Palestinians | 96.8 /100 | #100 | Exceptional 87.3% |
| Syrians | 96.6 /100 | #101 | Exceptional 87.2% |
Immigrants from Russia GED/Equivalency Correlation Summary
| Measurement | Immigrants from Russia Data | GED/Equivalency Data |
| Minimum | 0.071% | 75.3% |
| Maximum | 34.6% | 100.0% |
| Range | 34.5% | 24.7% |
| Mean | 7.7% | 90.4% |
| Median | 5.2% | 90.5% |
| Interquartile 25% (IQ1) | 2.5% | 87.0% |
| Interquartile 75% (IQ3) | 11.7% | 93.1% |
| Interquartile Range (IQR) | 9.2% | 6.1% |
| Standard Deviation (Sample) | 7.5% | 6.1% |
| Standard Deviation (Population) | 7.5% | 6.1% |
Correlation Details
| Immigrants from Russia Percentile | Sample Size | GED/Equivalency |
[ 0.0% - 0.5% ] 0.071% | 227,529,550 | 85.4% |
[ 0.0% - 0.5% ] 0.24% | 56,894,037 | 89.0% |
[ 0.0% - 0.5% ] 0.40% | 25,670,497 | 87.5% |
[ 0.5% - 1.0% ] 0.60% | 12,711,352 | 90.4% |
[ 0.5% - 1.0% ] 0.73% | 14,365,465 | 83.9% |
[ 0.5% - 1.0% ] 0.94% | 3,304,702 | 91.3% |
[ 1.0% - 1.5% ] 1.12% | 1,880,496 | 90.5% |
[ 1.0% - 1.5% ] 1.28% | 1,532,313 | 90.6% |
[ 1.0% - 1.5% ] 1.45% | 1,150,856 | 90.6% |
[ 1.5% - 2.0% ] 1.62% | 725,648 | 91.1% |
[ 1.5% - 2.0% ] 1.78% | 289,878 | 86.3% |
[ 1.5% - 2.0% ] 1.99% | 238,057 | 87.8% |
[ 2.0% - 2.5% ] 2.13% | 274,731 | 87.3% |
[ 2.0% - 2.5% ] 2.30% | 150,263 | 90.3% |
[ 2.0% - 2.5% ] 2.49% | 120,260 | 89.0% |
[ 2.5% - 3.0% ] 2.66% | 184,500 | 84.5% |
[ 2.5% - 3.0% ] 2.81% | 264,974 | 85.7% |
[ 2.5% - 3.0% ] 2.97% | 133,358 | 94.0% |
[ 3.0% - 3.5% ] 3.12% | 128,379 | 79.5% |
[ 3.0% - 3.5% ] 3.38% | 11,700 | 91.7% |
[ 3.0% - 3.5% ] 3.46% | 52,850 | 92.8% |
[ 3.5% - 4.0% ] 3.68% | 9,462 | 96.7% |
[ 3.5% - 4.0% ] 3.89% | 5,292 | 87.5% |
[ 4.0% - 4.5% ] 4.07% | 23,266 | 79.7% |
[ 4.0% - 4.5% ] 4.19% | 22,161 | 89.2% |
[ 4.0% - 4.5% ] 4.44% | 2,768 | 88.4% |
[ 4.5% - 5.0% ] 4.54% | 1,321 | 85.5% |
[ 4.5% - 5.0% ] 4.70% | 4,064 | 92.1% |
[ 5.0% - 5.5% ] 5.06% | 9,047 | 92.4% |
[ 5.0% - 5.5% ] 5.25% | 23,435 | 92.7% |
[ 5.0% - 5.5% ] 5.36% | 261 | 87.0% |
[ 5.5% - 6.0% ] 5.58% | 2,704 | 90.7% |
[ 5.5% - 6.0% ] 5.77% | 81,109 | 79.4% |
[ 6.0% - 6.5% ] 6.35% | 63 | 89.1% |
[ 6.5% - 7.0% ] 6.53% | 1,990 | 88.8% |
[ 6.5% - 7.0% ] 6.83% | 1,318 | 91.2% |
[ 7.0% - 7.5% ] 7.28% | 47,893 | 78.9% |
[ 8.0% - 8.5% ] 8.39% | 155 | 87.7% |
[ 8.5% - 9.0% ] 8.89% | 2,564 | 90.8% |
[ 9.0% - 9.5% ] 9.41% | 574 | 100.0% |
[ 9.5% - 10.0% ] 9.59% | 1,523 | 80.8% |
[ 10.0% - 10.5% ] 10.00% | 80 | 89.3% |
[ 10.0% - 10.5% ] 10.13% | 3,338 | 99.0% |
[ 11.5% - 12.0% ] 11.66% | 83,069 | 85.0% |
[ 11.5% - 12.0% ] 11.73% | 341 | 92.7% |
[ 11.5% - 12.0% ] 11.90% | 462 | 93.1% |
[ 12.0% - 12.5% ] 12.34% | 154 | 100.0% |
[ 12.0% - 12.5% ] 12.36% | 437 | 100.0% |
[ 12.5% - 13.0% ] 12.64% | 1,543 | 98.1% |
[ 12.5% - 13.0% ] 12.88% | 427 | 100.0% |
[ 13.5% - 14.0% ] 13.61% | 1,102 | 92.9% |
[ 13.5% - 14.0% ] 13.77% | 138 | 100.0% |
[ 14.0% - 14.5% ] 14.19% | 867 | 83.9% |
[ 16.0% - 16.5% ] 16.02% | 181 | 100.0% |
[ 18.0% - 18.5% ] 18.25% | 126 | 75.3% |
[ 21.0% - 21.5% ] 21.10% | 891 | 94.6% |
[ 26.0% - 26.5% ] 26.24% | 202 | 100.0% |
[ 34.0% - 34.5% ] 34.31% | 274 | 100.0% |
[ 34.5% - 35.0% ] 34.62% | 26 | 100.0% |