Immigrants from Nicaragua vs Canadian Wage/Income Gap
COMPARE
Immigrants from Nicaragua
Canadian
Wage/Income Gap
Wage/Income Gap Comparison
Immigrants from Nicaragua
Canadians
23.0%
WAGE/INCOME GAP
99.9/ 100
METRIC RATING
79th/ 347
METRIC RANK
28.1%
WAGE/INCOME GAP
0.3/ 100
METRIC RATING
289th/ 347
METRIC RANK
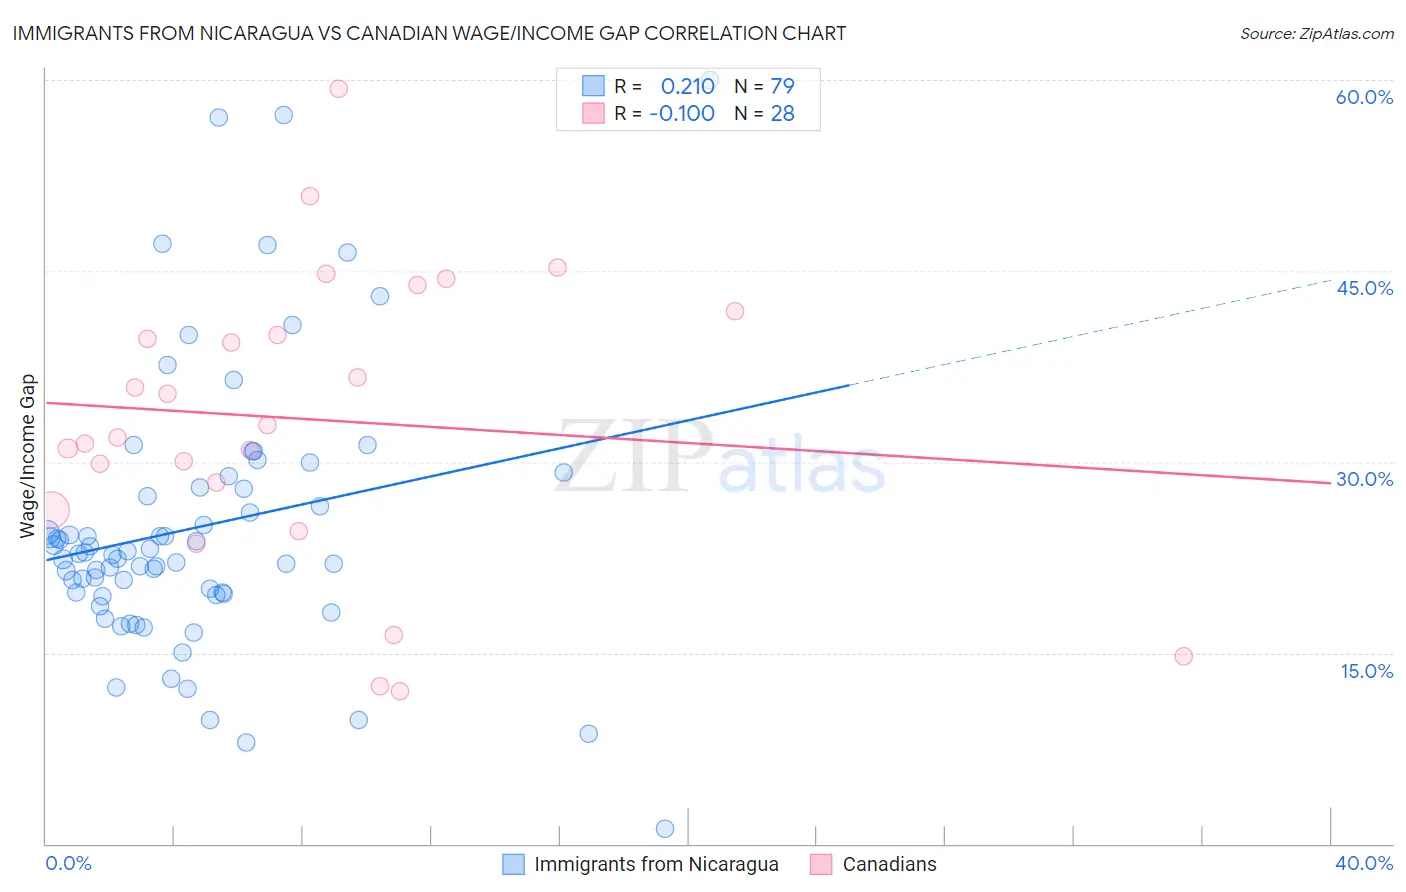
Immigrants from Nicaragua vs Canadian Wage/Income Gap Correlation Chart
The statistical analysis conducted on geographies consisting of 236,266,480 people shows a weak positive correlation between the proportion of Immigrants from Nicaragua and wage/income gap percentage in the United States with a correlation coefficient (R) of 0.210 and weighted average of 23.0%. Similarly, the statistical analysis conducted on geographies consisting of 437,073,113 people shows a slight negative correlation between the proportion of Canadians and wage/income gap percentage in the United States with a correlation coefficient (R) of -0.100 and weighted average of 28.1%, a difference of 22.5%.
Wage/Income Gap Correlation Summary
| Measurement | Immigrants from Nicaragua | Canadian |
| Minimum | 1.2% | 12.0% |
| Maximum | 60.0% | 59.3% |
| Range | 58.8% | 47.3% |
| Mean | 24.9% | 33.3% |
| Median | 22.8% | 32.4% |
| Interquartile 25% (IQ1) | 19.6% | 27.3% |
| Interquartile 75% (IQ3) | 28.0% | 40.9% |
| Interquartile Range (IQR) | 8.4% | 13.6% |
| Standard Deviation (Sample) | 10.8% | 11.4% |
| Standard Deviation (Population) | 10.7% | 11.2% |
Similar Demographics by Wage/Income Gap
Demographics Similar to Immigrants from Nicaragua by Wage/Income Gap
In terms of wage/income gap, the demographic groups most similar to Immigrants from Nicaragua are Salvadoran (23.0%, a difference of 0.070%), Nigerian (23.0%, a difference of 0.090%), African (22.9%, a difference of 0.19%), Ecuadorian (22.9%, a difference of 0.33%), and Fijian (22.9%, a difference of 0.34%).
| Demographics | Rating | Rank | Wage/Income Gap |
| Sub-Saharan Africans | 99.9 /100 | #72 | Exceptional 22.8% |
| Immigrants | Eastern Africa | 99.9 /100 | #73 | Exceptional 22.8% |
| Immigrants | Burma/Myanmar | 99.9 /100 | #74 | Exceptional 22.8% |
| Fijians | 99.9 /100 | #75 | Exceptional 22.9% |
| Ecuadorians | 99.9 /100 | #76 | Exceptional 22.9% |
| Africans | 99.9 /100 | #77 | Exceptional 22.9% |
| Nigerians | 99.9 /100 | #78 | Exceptional 23.0% |
| Immigrants | Nicaragua | 99.9 /100 | #79 | Exceptional 23.0% |
| Salvadorans | 99.9 /100 | #80 | Exceptional 23.0% |
| Bermudans | 99.8 /100 | #81 | Exceptional 23.1% |
| Central Americans | 99.8 /100 | #82 | Exceptional 23.1% |
| Immigrants | Africa | 99.8 /100 | #83 | Exceptional 23.2% |
| Cubans | 99.7 /100 | #84 | Exceptional 23.3% |
| Immigrants | Cambodia | 99.7 /100 | #85 | Exceptional 23.3% |
| Cheyenne | 99.7 /100 | #86 | Exceptional 23.3% |
Demographics Similar to Canadians by Wage/Income Gap
In terms of wage/income gap, the demographic groups most similar to Canadians are Choctaw (28.1%, a difference of 0.030%), Okinawan (28.1%, a difference of 0.070%), Australian (28.2%, a difference of 0.090%), Immigrants from Austria (28.1%, a difference of 0.11%), and Italian (28.1%, a difference of 0.14%).
| Demographics | Rating | Rank | Wage/Income Gap |
| South Africans | 0.5 /100 | #282 | Tragic 28.0% |
| French Canadians | 0.4 /100 | #283 | Tragic 28.1% |
| Immigrants | Sweden | 0.4 /100 | #284 | Tragic 28.1% |
| Italians | 0.4 /100 | #285 | Tragic 28.1% |
| Immigrants | Austria | 0.4 /100 | #286 | Tragic 28.1% |
| Okinawans | 0.4 /100 | #287 | Tragic 28.1% |
| Choctaw | 0.4 /100 | #288 | Tragic 28.1% |
| Canadians | 0.3 /100 | #289 | Tragic 28.1% |
| Australians | 0.3 /100 | #290 | Tragic 28.2% |
| Czechoslovakians | 0.3 /100 | #291 | Tragic 28.2% |
| Immigrants | Australia | 0.3 /100 | #292 | Tragic 28.2% |
| Immigrants | Israel | 0.3 /100 | #293 | Tragic 28.2% |
| Greeks | 0.3 /100 | #294 | Tragic 28.2% |
| Slovenes | 0.3 /100 | #295 | Tragic 28.3% |
| Northern Europeans | 0.3 /100 | #296 | Tragic 28.3% |