Immigrants from Moldova 2 or more Vehicles in Household

COMPARE

Immigrants from Moldova
Race
Ancestry
AfghanAfricanAlaska NativeAlaskan AthabascanAlbanianAleutAlsatianAmericanApacheArabArapahoArgentineanArmenianAssyrian/Chaldean/SyriacAustralianAustrianBahamianBangladeshiBarbadianBasqueBelgianBelizeanBermudanBhutaneseBlackfeetBolivianBrazilianBritishBritish West IndianBulgarianBurmeseCajunCambodianCanadianCape VerdeanCarpatho RusynCelticCentral AmericanCentral American IndianCherokeeCheyenneChickasawChileanChineseChippewaChoctawColombianColvilleComancheCosta RicanCreeCreekCroatianCrowCubanCypriotCzechCzechoslovakianDanishDelawareDominicanDutchDutch West IndianEastern EuropeanEcuadorianEgyptianEnglishEstonianEthiopianEuropeanFijianFilipinoFinnishFrenchFrench American IndianFrench CanadianGermanGerman RussianGhanaianGreekGuamanian/ChamorroGuatemalanGuyaneseHaitianHmongHonduranHopiHoumaHungarianIcelanderIndian (Asian)IndonesianInupiatIranianIraqiIrishIroquoisIsraeliItalianJamaicanJapaneseJordanianKenyanKiowaKoreanLaotianLatvianLebaneseLiberianLithuanianLumbeeLuxembourgerMacedonianMalaysianMalteseMarshalleseMenomineeMexicanMexican American IndianMongolianMoroccanNative HawaiianNavajoNepaleseNew ZealanderNicaraguanNigerianNorthern EuropeanNorwegianOkinawanOsageOttawaPaiutePakistaniPalestinianPanamanianParaguayanPennsylvania GermanPeruvianPimaPolishPortuguesePotawatomiPuebloPuerto RicanPuget Sound SalishRomanianRussianSalvadoranSamoanScandinavianScotch-IrishScottishSeminoleSenegaleseSerbianShoshoneSierra LeoneanSiouxSlavicSlovakSloveneSomaliSouth AfricanSouth AmericanSouth American IndianSoviet UnionSpaniardSpanishSpanish AmericanSpanish American IndianSri LankanSubsaharan AfricanSudaneseSwedishSwissSyrianTaiwaneseThaiTlingit-HaidaTohono O'OdhamTonganTrinidadian and TobagonianTsimshianTurkishU.S. Virgin IslanderUgandanUkrainianUruguayanUteVenezuelanVietnameseWelshWest IndianYakamaYaquiYugoslavianYumanYup'ikZimbabwean
Immigration
NonimmigrantsImmigrantsAfghanistanAfricaAlbaniaArgentinaArmeniaAsiaAustraliaAustriaBahamasBangladeshBarbadosBelarusBelgiumBelizeBoliviaBosnia and HerzegovinaBrazilBulgariaBurma/MyanmarCabo VerdeCambodiaCameroonCanadaCaribbeanCentral AmericaChileChinaColombiaCongoCosta RicaCroatiaCubaCzechoslovakiaDenmarkDominicaDominican RepublicEastern AfricaEastern AsiaEastern EuropeEcuadorEgyptEl SalvadorEnglandEritreaEthiopiaEuropeFijiFranceGermanyGhanaGreeceGrenadaGuatemalaGuyanaHaitiHondurasHong KongHungaryIndiaIndonesiaIranIraqIrelandIsraelItalyJamaicaJapanJordanKazakhstanKenyaKoreaKuwaitLaosLatin AmericaLatviaLebanonLiberiaLithuaniaMalaysiaMexicoMicronesiaMiddle AfricaMoldovaMoroccoNepalNetherlandsNicaraguaNigeriaNorth AmericaNorth MacedoniaNorthern AfricaNorthern EuropeNorwayOceaniaPakistanPanamaPeruPhilippinesPolandPortugalRomaniaRussiaSaudi ArabiaScotlandSenegalSerbiaSierra LeoneSingaporeSomaliaSouth AfricaSouth AmericaSouth Central AsiaSouth Eastern AsiaSouthern EuropeSpainSri LankaSt. Vincent and the GrenadinesSudanSwedenSwitzerlandSyriaTaiwanThailandTrinidad and TobagoTurkeyUgandaUkraineUruguayUzbekistanVenezuelaVietnamWest IndiesWestern AfricaWestern AsiaWestern EuropeYemenZaireZimbabweAzores
Select to Compare
Race
Ancestry
AfghanAfricanAlaska NativeAlaskan AthabascanAlbanianAleutAlsatianAmericanApacheArabArapahoArgentineanArmenianAssyrian/Chaldean/SyriacAustralianAustrianBahamianBangladeshiBarbadianBasqueBelgianBelizeanBermudanBhutaneseBlackfeetBolivianBrazilianBritishBritish West IndianBulgarianBurmeseCajunCambodianCanadianCape VerdeanCarpatho RusynCelticCentral AmericanCentral American IndianCherokeeCheyenneChickasawChileanChineseChippewaChoctawColombianColvilleComancheCosta RicanCreeCreekCroatianCrowCubanCypriotCzechCzechoslovakianDanishDelawareDominicanDutchDutch West IndianEastern EuropeanEcuadorianEgyptianEnglishEstonianEthiopianEuropeanFijianFilipinoFinnishFrenchFrench American IndianFrench CanadianGermanGerman RussianGhanaianGreekGuamanian/ChamorroGuatemalanGuyaneseHaitianHmongHonduranHopiHoumaHungarianIcelanderIndian (Asian)IndonesianInupiatIranianIraqiIrishIroquoisIsraeliItalianJamaicanJapaneseJordanianKenyanKiowaKoreanLaotianLatvianLebaneseLiberianLithuanianLumbeeLuxembourgerMacedonianMalaysianMalteseMarshalleseMenomineeMexicanMexican American IndianMongolianMoroccanNative HawaiianNavajoNepaleseNew ZealanderNicaraguanNigerianNorthern EuropeanNorwegianOkinawanOsageOttawaPaiutePakistaniPalestinianPanamanianParaguayanPennsylvania GermanPeruvianPimaPolishPortuguesePotawatomiPuebloPuerto RicanPuget Sound SalishRomanianRussianSalvadoranSamoanScandinavianScotch-IrishScottishSeminoleSenegaleseSerbianShoshoneSierra LeoneanSiouxSlavicSlovakSloveneSomaliSouth AfricanSouth AmericanSouth American IndianSoviet UnionSpaniardSpanishSpanish AmericanSpanish American IndianSri LankanSubsaharan AfricanSudaneseSwedishSwissSyrianTaiwaneseThaiTlingit-HaidaTohono O'OdhamTonganTrinidadian and TobagonianTsimshianTurkishU.S. Virgin IslanderUgandanUkrainianUruguayanUteVenezuelanVietnameseWelshWest IndianYakamaYaquiYugoslavianYumanYup'ikZimbabwean
Immigration
NonimmigrantsImmigrantsAfghanistanAfricaAlbaniaArgentinaArmeniaAsiaAustraliaAustriaBahamasBangladeshBarbadosBelarusBelgiumBelizeBoliviaBosnia and HerzegovinaBrazilBulgariaBurma/MyanmarCabo VerdeCambodiaCameroonCanadaCaribbeanCentral AmericaChileChinaColombiaCongoCosta RicaCroatiaCubaCzechoslovakiaDenmarkDominicaDominican RepublicEastern AfricaEastern AsiaEastern EuropeEcuadorEgyptEl SalvadorEnglandEritreaEthiopiaEuropeFijiFranceGermanyGhanaGreeceGrenadaGuatemalaGuyanaHaitiHondurasHong KongHungaryIndiaIndonesiaIranIraqIrelandIsraelItalyJamaicaJapanJordanKazakhstanKenyaKoreaKuwaitLaosLatin AmericaLatviaLebanonLiberiaLithuaniaMalaysiaMexicoMicronesiaMiddle AfricaMoroccoNepalNetherlandsNicaraguaNigeriaNorth AmericaNorth MacedoniaNorthern AfricaNorthern EuropeNorwayOceaniaPakistanPanamaPeruPhilippinesPolandPortugalRomaniaRussiaSaudi ArabiaScotlandSenegalSerbiaSierra LeoneSingaporeSomaliaSouth AfricaSouth AmericaSouth Central AsiaSouth Eastern AsiaSouthern EuropeSpainSri LankaSt. Vincent and the GrenadinesSudanSwedenSwitzerlandSyriaTaiwanThailandTrinidad and TobagoTurkeyUgandaUkraineUruguayUzbekistanVenezuelaVietnamWest IndiesWestern AfricaWestern AsiaWestern EuropeYemenZaireZimbabweAzores
2 or more Vehicles in Household
Income
Poverty
Unemployment
Labor Participation
Family Structure
Vehicle Availability
Education Level
Disability

Immigrants from Moldova 2 or more Vehicles in Household
Excellent

56.1%
2+ VEHICLES AVAILABLE
80.2/ 100
METRIC RATING
148th/ 347
METRIC RANK

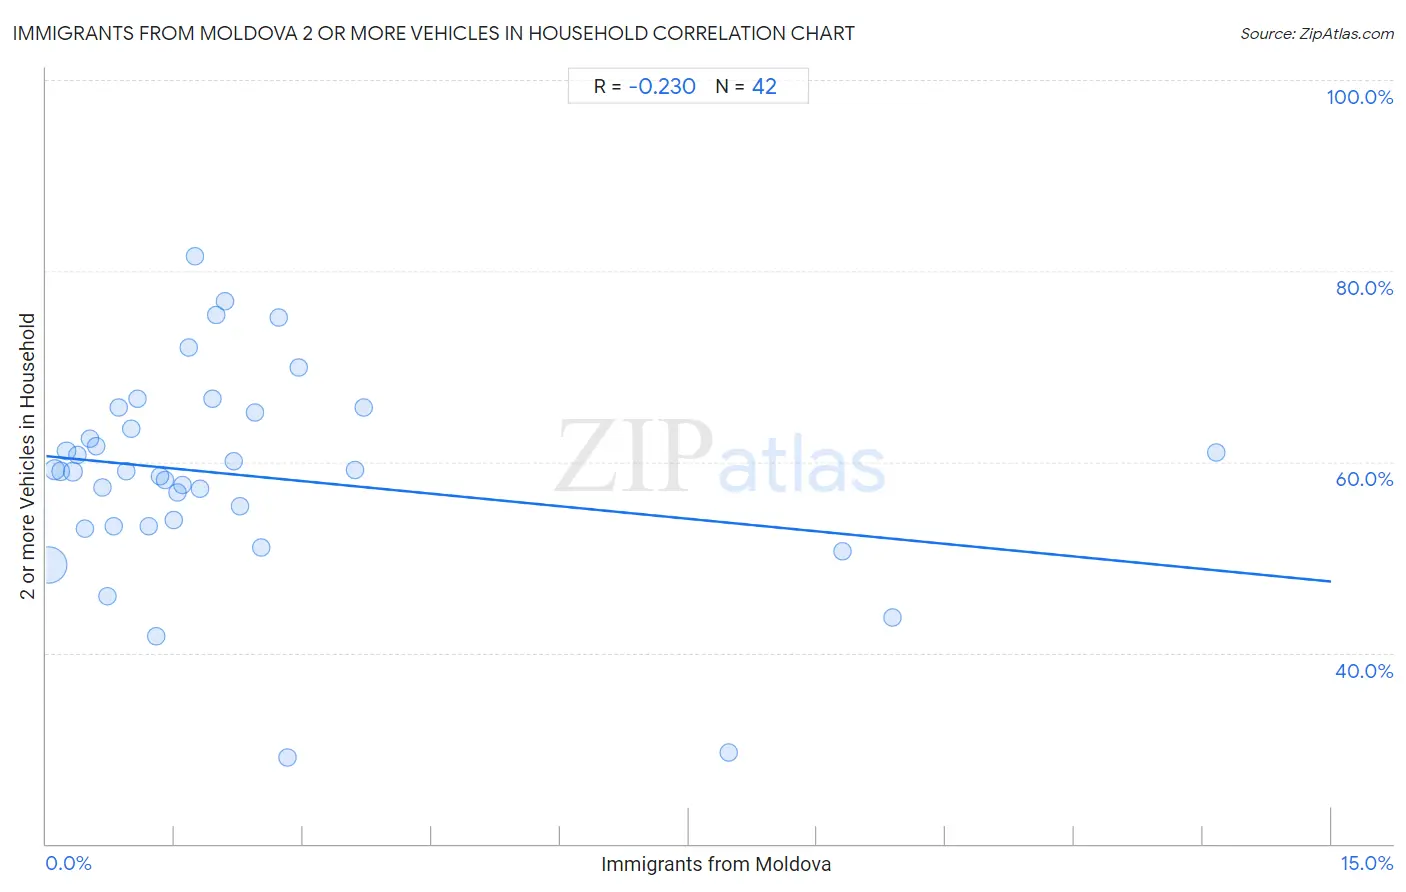
Immigrants from Moldova 2 or more Vehicles in Household Correlation Chart

The statistical analysis conducted on geographies consisting of 124,285,245 people shows a weak negative correlation between the proportion of Immigrants from Moldova and percentage of households with 2 or more vehicles available in the United States with a correlation coefficient (R) of -0.230 and weighted average of 56.1%. On average, for every 1% (one percent) increase in Immigrants from Moldova within a typical geography, there is a decrease of 0.88% in percentage of households with 2 or more vehicles available.
Immigrants from Moldova 2 or more Vehicles in Household
It is essential to understand that the correlation between the percentage of Immigrants from Moldova and percentage of households with 2 or more vehicles available does not imply a direct cause-and-effect relationship. It remains uncertain whether the presence of Immigrants from Moldova influences an upward or downward trend in the level of percentage of households with 2 or more vehicles available within an area, or if Immigrants from Moldova simply ended up residing in those areas with higher or lower levels of percentage of households with 2 or more vehicles available due to other factors.

Demographics Similar to Immigrants from Moldova by 2 or more Vehicles in Household

In terms of 2 or more vehicles in household, the demographic groups most similar to Immigrants from Moldova are Serbian (56.1%, a difference of 0.0%), Chilean (56.1%, a difference of 0.0%), Nicaraguan (56.1%, a difference of 0.020%), Venezuelan (56.1%, a difference of 0.030%), and Syrian (56.2%, a difference of 0.060%).
DemographicsRating | Rank2 or more Vehicles in Household
Immigrants from Cambodia
83.6
/100
|
#141
Excellent
56.2%
South Africans
83.1
/100
|
#142
Excellent
56.2%
Seminole
81.7
/100
|
#143
Excellent
56.2%
Immigrants from Syria
81.4
/100
|
#144
Excellent
56.2%
Syrians
81.2
/100
|
#145
Excellent
56.2%
Venezuelans
80.7
/100
|
#146
Excellent
56.1%
Serbians
80.3
/100
|
#147
Excellent
56.1%
Immigrants from Moldova
80.2
/100
|
#148
Excellent
56.1%
Chileans
80.2
/100
|
#149
Excellent
56.1%
Nicaraguans
79.9
/100
|
#150
Good
56.1%
Immigrants from Northern Europe
78.7
/100
|
#151
Good
56.1%
Immigrants from Pakistan
78.1
/100
|
#152
Good
56.1%
Lumbee
71.9
/100
|
#153
Good
55.9%
Ukrainians
70.8
/100
|
#154
Good
55.8%
Immigrants from Venezuela
70.7
/100
|
#155
Good
55.8%

Immigrants from Moldova 2 or more Vehicles in Household Correlation Summary

MeasurementImmigrants from Moldova Data2 or more Vehicles in Household Data
Minimum0.026%29.0%
Maximum13.7%81.6%
Range13.6%52.5%
Mean2.3%58.6%
Median1.5%59.0%
Interquartile 25% (IQ1)0.71%53.2%
Interquartile 75% (IQ3)2.4%65.1%
Interquartile Range (IQR)1.7%11.9%
Standard Deviation (Sample)2.8%10.8%
Standard Deviation (Population)2.8%10.7%

Correlation Details

Immigrants from Moldova PercentileSample Size2 or more Vehicles in Household
[
0.0%
-
0.5%
]
0.026%
92,797,93149.2%
[
0.0%
-
0.5%
]
0.098%
15,289,06959.2%
[
0.0%
-
0.5%
]
0.17%
5,599,16059.0%
[
0.0%
-
0.5%
]
0.24%
3,433,08361.2%
[
0.0%
-
0.5%
]
0.31%
2,217,58259.0%
[
0.0%
-
0.5%
]
0.37%
859,21460.7%
[
0.0%
-
0.5%
]
0.45%
1,061,39253.0%
[
0.5%
-
1.0%
]
0.52%
444,02662.4%
[
0.5%
-
1.0%
]
0.59%
471,46361.7%
[
0.5%
-
1.0%
]
0.66%
295,43757.3%
[
0.5%
-
1.0%
]
0.71%
300,12546.0%
[
0.5%
-
1.0%
]
0.79%
268,97153.2%
[
0.5%
-
1.0%
]
0.85%
132,70765.6%
[
0.5%
-
1.0%
]
0.93%
173,01959.0%
[
0.5%
-
1.0%
]
1.00%
223,20163.4%
[
1.0%
-
1.5%
]
1.07%
45,05466.7%
[
1.0%
-
1.5%
]
1.20%
47,93453.2%
[
1.0%
-
1.5%
]
1.28%
132,62441.7%
[
1.0%
-
1.5%
]
1.33%
25,77958.5%
[
1.0%
-
1.5%
]
1.39%
72,60158.2%
[
1.0%
-
1.5%
]
1.49%
47053.9%
[
1.5%
-
2.0%
]
1.54%
184,78256.9%
[
1.5%
-
2.0%
]
1.59%
129,85057.6%
[
1.5%
-
2.0%
]
1.67%
6,00472.0%
[
1.5%
-
2.0%
]
1.74%
17,52681.6%
[
1.5%
-
2.0%
]
1.80%
3,62057.2%
[
1.5%
-
2.0%
]
1.94%
21,08466.6%
[
1.5%
-
2.0%
]
1.98%
1,00975.4%
[
2.0%
-
2.5%
]
2.09%
2,58376.8%
[
2.0%
-
2.5%
]
2.19%
7,21860.0%
[
2.0%
-
2.5%
]
2.26%
2,56855.3%
[
2.0%
-
2.5%
]
2.43%
37065.1%
[
2.5%
-
3.0%
]
2.51%
95651.1%
[
2.5%
-
3.0%
]
2.72%
4,92675.1%
[
2.5%
-
3.0%
]
2.81%
2,63129.0%
[
2.5%
-
3.0%
]
2.94%
68069.9%
[
3.5%
-
4.0%
]
3.61%
38859.2%
[
3.5%
-
4.0%
]
3.71%
2,64465.7%
[
7.5%
-
8.0%
]
7.97%
2,56029.5%
[
9.0%
-
9.5%
]
9.30%
1,99050.7%
[
9.5%
-
10.0%
]
9.88%
64843.7%
[
13.5%
-
14.0%
]
13.66%
36661.0%