Immigrants from Moldova vs Liberian Wage/Income Gap
COMPARE
Immigrants from Moldova
Liberian
Wage/Income Gap
Wage/Income Gap Comparison
Immigrants from Moldova
Liberians
26.2%
WAGE/INCOME GAP
26.6/ 100
METRIC RATING
189th/ 347
METRIC RANK
21.4%
WAGE/INCOME GAP
100.0/ 100
METRIC RATING
41st/ 347
METRIC RANK
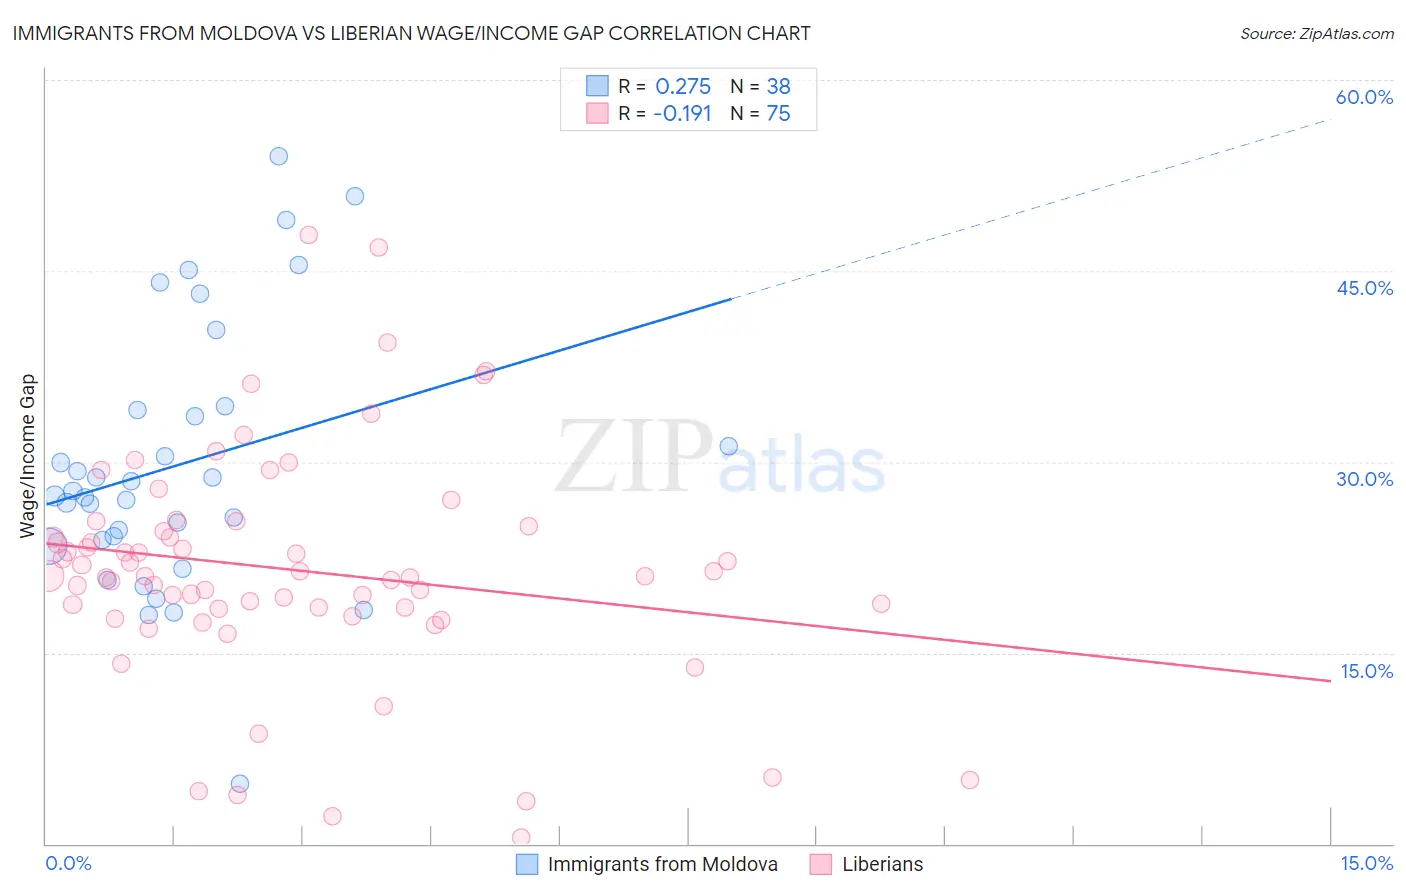
Immigrants from Moldova vs Liberian Wage/Income Gap Correlation Chart
The statistical analysis conducted on geographies consisting of 124,386,174 people shows a weak positive correlation between the proportion of Immigrants from Moldova and wage/income gap percentage in the United States with a correlation coefficient (R) of 0.275 and weighted average of 26.2%. Similarly, the statistical analysis conducted on geographies consisting of 118,089,218 people shows a poor negative correlation between the proportion of Liberians and wage/income gap percentage in the United States with a correlation coefficient (R) of -0.191 and weighted average of 21.4%, a difference of 22.2%.
Wage/Income Gap Correlation Summary
| Measurement | Immigrants from Moldova | Liberian |
| Minimum | 4.7% | 0.44% |
| Maximum | 54.0% | 47.8% |
| Range | 49.3% | 47.4% |
| Mean | 29.8% | 21.5% |
| Median | 27.5% | 21.0% |
| Interquartile 25% (IQ1) | 23.8% | 18.5% |
| Interquartile 75% (IQ3) | 34.0% | 25.0% |
| Interquartile Range (IQR) | 10.2% | 6.5% |
| Standard Deviation (Sample) | 10.4% | 9.0% |
| Standard Deviation (Population) | 10.3% | 9.0% |
Similar Demographics by Wage/Income Gap
Demographics Similar to Immigrants from Moldova by Wage/Income Gap
In terms of wage/income gap, the demographic groups most similar to Immigrants from Moldova are Immigrants from Croatia (26.2%, a difference of 0.15%), Immigrants from Venezuela (26.2%, a difference of 0.17%), Palestinian (26.1%, a difference of 0.26%), Immigrants from Egypt (26.1%, a difference of 0.26%), and Immigrants from Bulgaria (26.3%, a difference of 0.35%).
| Demographics | Rating | Rank | Wage/Income Gap |
| Immigrants | Serbia | 35.4 /100 | #182 | Fair 26.0% |
| Immigrants | Kazakhstan | 35.2 /100 | #183 | Fair 26.0% |
| Mexicans | 34.4 /100 | #184 | Fair 26.0% |
| Pakistanis | 33.7 /100 | #185 | Fair 26.1% |
| Immigrants | Indonesia | 32.5 /100 | #186 | Fair 26.1% |
| Palestinians | 29.9 /100 | #187 | Fair 26.1% |
| Immigrants | Egypt | 29.9 /100 | #188 | Fair 26.1% |
| Immigrants | Moldova | 26.6 /100 | #189 | Fair 26.2% |
| Immigrants | Croatia | 24.8 /100 | #190 | Fair 26.2% |
| Immigrants | Venezuela | 24.7 /100 | #191 | Fair 26.2% |
| Immigrants | Bulgaria | 22.5 /100 | #192 | Fair 26.3% |
| Immigrants | Jordan | 22.4 /100 | #193 | Fair 26.3% |
| Chileans | 22.3 /100 | #194 | Fair 26.3% |
| Immigrants | Malaysia | 22.2 /100 | #195 | Fair 26.3% |
| Immigrants | Western Asia | 21.7 /100 | #196 | Fair 26.3% |
Demographics Similar to Liberians by Wage/Income Gap
In terms of wage/income gap, the demographic groups most similar to Liberians are Immigrants from Sierra Leone (21.4%, a difference of 0.0%), Sierra Leonean (21.4%, a difference of 0.060%), Immigrants from Eritrea (21.4%, a difference of 0.080%), Lumbee (21.3%, a difference of 0.48%), and U.S. Virgin Islander (21.5%, a difference of 0.52%).
| Demographics | Rating | Rank | Wage/Income Gap |
| Pima | 100.0 /100 | #34 | Exceptional 21.1% |
| Somalis | 100.0 /100 | #35 | Exceptional 21.2% |
| Belizeans | 100.0 /100 | #36 | Exceptional 21.2% |
| Immigrants | Somalia | 100.0 /100 | #37 | Exceptional 21.2% |
| Immigrants | Belize | 100.0 /100 | #38 | Exceptional 21.3% |
| Colville | 100.0 /100 | #39 | Exceptional 21.3% |
| Lumbee | 100.0 /100 | #40 | Exceptional 21.3% |
| Liberians | 100.0 /100 | #41 | Exceptional 21.4% |
| Immigrants | Sierra Leone | 100.0 /100 | #42 | Exceptional 21.4% |
| Sierra Leoneans | 100.0 /100 | #43 | Exceptional 21.4% |
| Immigrants | Eritrea | 100.0 /100 | #44 | Exceptional 21.4% |
| U.S. Virgin Islanders | 100.0 /100 | #45 | Exceptional 21.5% |
| Immigrants | Ethiopia | 100.0 /100 | #46 | Exceptional 21.6% |
| Immigrants | Congo | 100.0 /100 | #47 | Exceptional 21.7% |
| Blacks/African Americans | 100.0 /100 | #48 | Exceptional 21.7% |