Immigrants from Moldova vs Cuban Wage/Income Gap
COMPARE
Immigrants from Moldova
Cuban
Wage/Income Gap
Wage/Income Gap Comparison
Immigrants from Moldova
Cubans
26.2%
WAGE/INCOME GAP
26.6/ 100
METRIC RATING
189th/ 347
METRIC RANK
23.3%
WAGE/INCOME GAP
99.7/ 100
METRIC RATING
84th/ 347
METRIC RANK
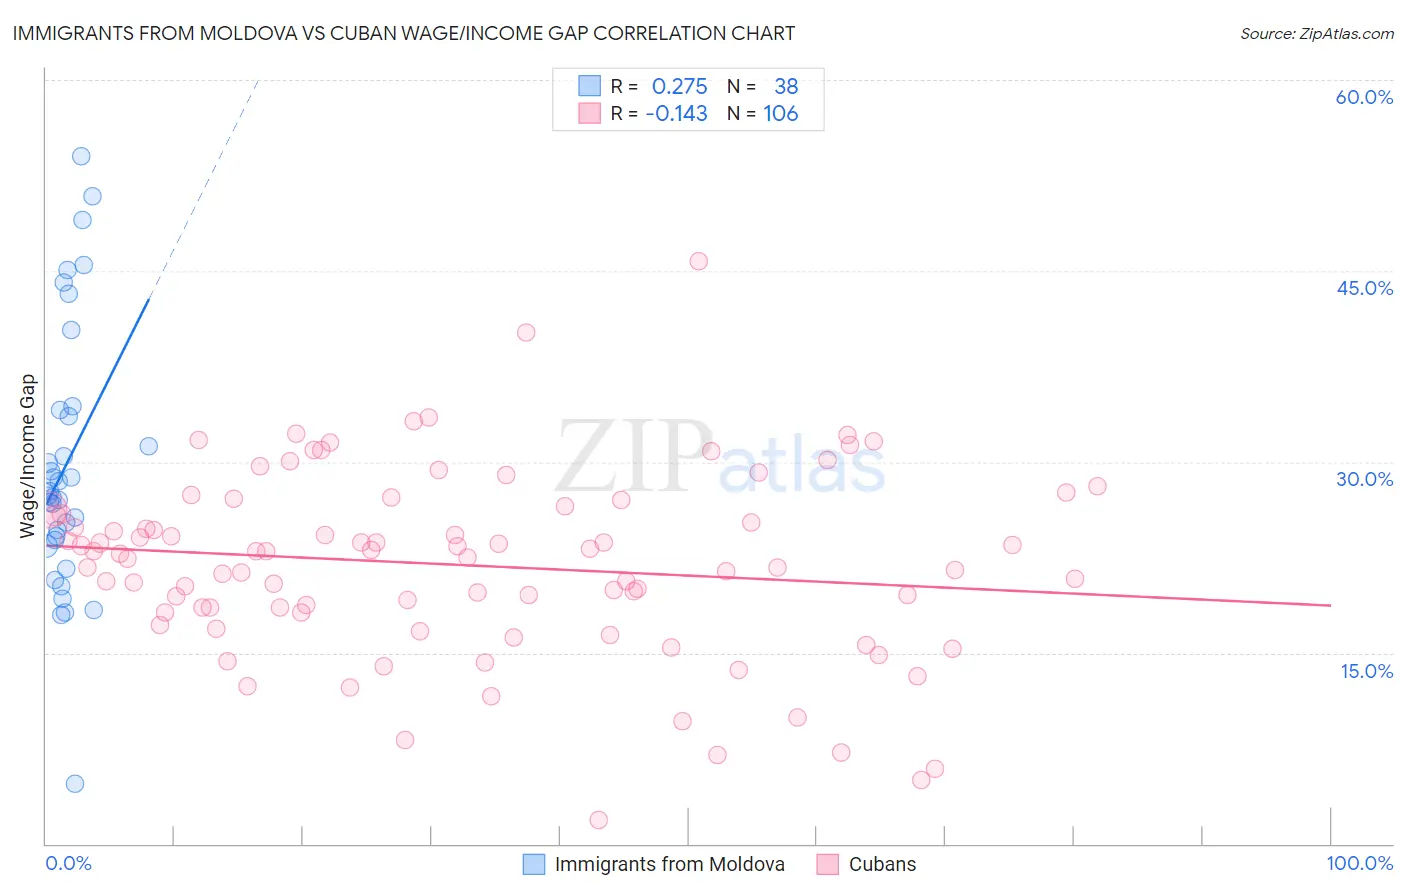
Immigrants from Moldova vs Cuban Wage/Income Gap Correlation Chart
The statistical analysis conducted on geographies consisting of 124,386,174 people shows a weak positive correlation between the proportion of Immigrants from Moldova and wage/income gap percentage in the United States with a correlation coefficient (R) of 0.275 and weighted average of 26.2%. Similarly, the statistical analysis conducted on geographies consisting of 448,898,454 people shows a poor negative correlation between the proportion of Cubans and wage/income gap percentage in the United States with a correlation coefficient (R) of -0.143 and weighted average of 23.3%, a difference of 12.6%.
Wage/Income Gap Correlation Summary
| Measurement | Immigrants from Moldova | Cuban |
| Minimum | 4.7% | 1.9% |
| Maximum | 54.0% | 45.8% |
| Range | 49.3% | 43.9% |
| Mean | 29.8% | 21.9% |
| Median | 27.5% | 22.6% |
| Interquartile 25% (IQ1) | 23.8% | 18.2% |
| Interquartile 75% (IQ3) | 34.0% | 26.2% |
| Interquartile Range (IQR) | 10.2% | 8.0% |
| Standard Deviation (Sample) | 10.4% | 7.3% |
| Standard Deviation (Population) | 10.3% | 7.3% |
Similar Demographics by Wage/Income Gap
Demographics Similar to Immigrants from Moldova by Wage/Income Gap
In terms of wage/income gap, the demographic groups most similar to Immigrants from Moldova are Immigrants from Croatia (26.2%, a difference of 0.15%), Immigrants from Venezuela (26.2%, a difference of 0.17%), Palestinian (26.1%, a difference of 0.26%), Immigrants from Egypt (26.1%, a difference of 0.26%), and Immigrants from Bulgaria (26.3%, a difference of 0.35%).
| Demographics | Rating | Rank | Wage/Income Gap |
| Immigrants | Serbia | 35.4 /100 | #182 | Fair 26.0% |
| Immigrants | Kazakhstan | 35.2 /100 | #183 | Fair 26.0% |
| Mexicans | 34.4 /100 | #184 | Fair 26.0% |
| Pakistanis | 33.7 /100 | #185 | Fair 26.1% |
| Immigrants | Indonesia | 32.5 /100 | #186 | Fair 26.1% |
| Palestinians | 29.9 /100 | #187 | Fair 26.1% |
| Immigrants | Egypt | 29.9 /100 | #188 | Fair 26.1% |
| Immigrants | Moldova | 26.6 /100 | #189 | Fair 26.2% |
| Immigrants | Croatia | 24.8 /100 | #190 | Fair 26.2% |
| Immigrants | Venezuela | 24.7 /100 | #191 | Fair 26.2% |
| Immigrants | Bulgaria | 22.5 /100 | #192 | Fair 26.3% |
| Immigrants | Jordan | 22.4 /100 | #193 | Fair 26.3% |
| Chileans | 22.3 /100 | #194 | Fair 26.3% |
| Immigrants | Malaysia | 22.2 /100 | #195 | Fair 26.3% |
| Immigrants | Western Asia | 21.7 /100 | #196 | Fair 26.3% |
Demographics Similar to Cubans by Wage/Income Gap
In terms of wage/income gap, the demographic groups most similar to Cubans are Immigrants from Cambodia (23.3%, a difference of 0.050%), Cheyenne (23.3%, a difference of 0.26%), Yuman (23.3%, a difference of 0.31%), Immigrants from Africa (23.2%, a difference of 0.37%), and Immigrants from Panama (23.4%, a difference of 0.63%).
| Demographics | Rating | Rank | Wage/Income Gap |
| Africans | 99.9 /100 | #77 | Exceptional 22.9% |
| Nigerians | 99.9 /100 | #78 | Exceptional 23.0% |
| Immigrants | Nicaragua | 99.9 /100 | #79 | Exceptional 23.0% |
| Salvadorans | 99.9 /100 | #80 | Exceptional 23.0% |
| Bermudans | 99.8 /100 | #81 | Exceptional 23.1% |
| Central Americans | 99.8 /100 | #82 | Exceptional 23.1% |
| Immigrants | Africa | 99.8 /100 | #83 | Exceptional 23.2% |
| Cubans | 99.7 /100 | #84 | Exceptional 23.3% |
| Immigrants | Cambodia | 99.7 /100 | #85 | Exceptional 23.3% |
| Cheyenne | 99.7 /100 | #86 | Exceptional 23.3% |
| Yuman | 99.7 /100 | #87 | Exceptional 23.3% |
| Immigrants | Panama | 99.6 /100 | #88 | Exceptional 23.4% |
| Marshallese | 99.6 /100 | #89 | Exceptional 23.4% |
| Nicaraguans | 99.6 /100 | #90 | Exceptional 23.4% |
| Arapaho | 99.6 /100 | #91 | Exceptional 23.5% |