Immigrants from Moldova vs Immigrants from Taiwan Wage/Income Gap
COMPARE
Immigrants from Moldova
Immigrants from Taiwan
Wage/Income Gap
Wage/Income Gap Comparison
Immigrants from Moldova
Immigrants from Taiwan
26.2%
WAGE/INCOME GAP
26.6/ 100
METRIC RATING
189th/ 347
METRIC RANK
29.5%
WAGE/INCOME GAP
0.0/ 100
METRIC RATING
335th/ 347
METRIC RANK
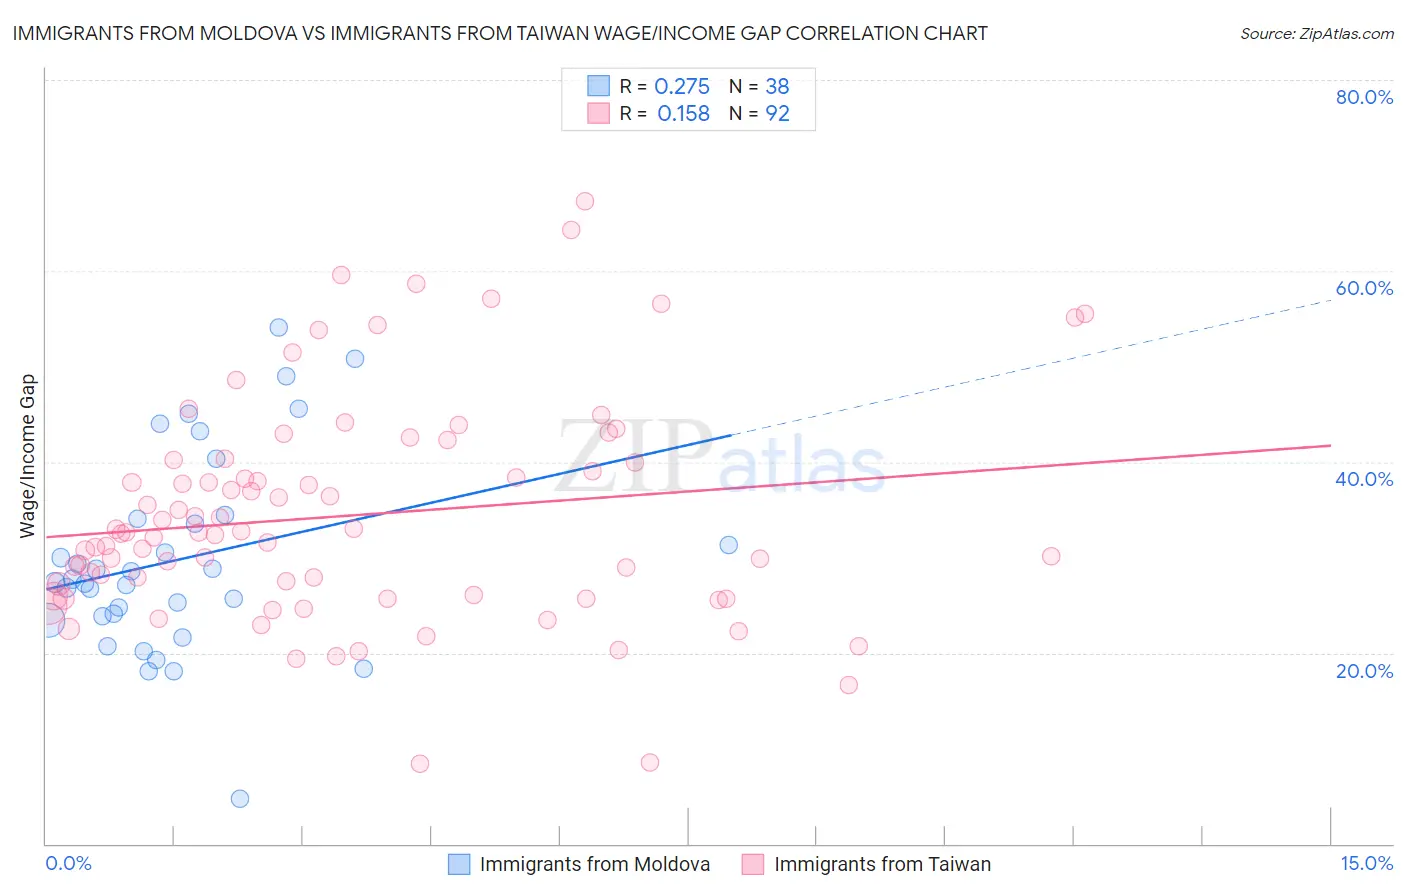
Immigrants from Moldova vs Immigrants from Taiwan Wage/Income Gap Correlation Chart
The statistical analysis conducted on geographies consisting of 124,386,174 people shows a weak positive correlation between the proportion of Immigrants from Moldova and wage/income gap percentage in the United States with a correlation coefficient (R) of 0.275 and weighted average of 26.2%. Similarly, the statistical analysis conducted on geographies consisting of 298,208,657 people shows a poor positive correlation between the proportion of Immigrants from Taiwan and wage/income gap percentage in the United States with a correlation coefficient (R) of 0.158 and weighted average of 29.5%, a difference of 12.5%.
Wage/Income Gap Correlation Summary
| Measurement | Immigrants from Moldova | Immigrants from Taiwan |
| Minimum | 4.7% | 8.4% |
| Maximum | 54.0% | 67.2% |
| Range | 49.3% | 58.8% |
| Mean | 29.8% | 34.4% |
| Median | 27.5% | 32.5% |
| Interquartile 25% (IQ1) | 23.8% | 26.0% |
| Interquartile 75% (IQ3) | 34.0% | 40.1% |
| Interquartile Range (IQR) | 10.2% | 14.1% |
| Standard Deviation (Sample) | 10.4% | 11.6% |
| Standard Deviation (Population) | 10.3% | 11.5% |
Similar Demographics by Wage/Income Gap
Demographics Similar to Immigrants from Moldova by Wage/Income Gap
In terms of wage/income gap, the demographic groups most similar to Immigrants from Moldova are Immigrants from Croatia (26.2%, a difference of 0.15%), Immigrants from Venezuela (26.2%, a difference of 0.17%), Palestinian (26.1%, a difference of 0.26%), Immigrants from Egypt (26.1%, a difference of 0.26%), and Immigrants from Bulgaria (26.3%, a difference of 0.35%).
| Demographics | Rating | Rank | Wage/Income Gap |
| Immigrants | Serbia | 35.4 /100 | #182 | Fair 26.0% |
| Immigrants | Kazakhstan | 35.2 /100 | #183 | Fair 26.0% |
| Mexicans | 34.4 /100 | #184 | Fair 26.0% |
| Pakistanis | 33.7 /100 | #185 | Fair 26.1% |
| Immigrants | Indonesia | 32.5 /100 | #186 | Fair 26.1% |
| Palestinians | 29.9 /100 | #187 | Fair 26.1% |
| Immigrants | Egypt | 29.9 /100 | #188 | Fair 26.1% |
| Immigrants | Moldova | 26.6 /100 | #189 | Fair 26.2% |
| Immigrants | Croatia | 24.8 /100 | #190 | Fair 26.2% |
| Immigrants | Venezuela | 24.7 /100 | #191 | Fair 26.2% |
| Immigrants | Bulgaria | 22.5 /100 | #192 | Fair 26.3% |
| Immigrants | Jordan | 22.4 /100 | #193 | Fair 26.3% |
| Chileans | 22.3 /100 | #194 | Fair 26.3% |
| Immigrants | Malaysia | 22.2 /100 | #195 | Fair 26.3% |
| Immigrants | Western Asia | 21.7 /100 | #196 | Fair 26.3% |
Demographics Similar to Immigrants from Taiwan by Wage/Income Gap
In terms of wage/income gap, the demographic groups most similar to Immigrants from Taiwan are English (29.5%, a difference of 0.010%), Swedish (29.4%, a difference of 0.13%), European (29.4%, a difference of 0.27%), Immigrants from South Central Asia (29.3%, a difference of 0.46%), and Dutch (29.6%, a difference of 0.59%).
| Demographics | Rating | Rank | Wage/Income Gap |
| Scandinavians | 0.0 /100 | #328 | Tragic 29.1% |
| Scottish | 0.0 /100 | #329 | Tragic 29.1% |
| Germans | 0.0 /100 | #330 | Tragic 29.2% |
| Czechs | 0.0 /100 | #331 | Tragic 29.2% |
| Immigrants | South Central Asia | 0.0 /100 | #332 | Tragic 29.3% |
| Europeans | 0.0 /100 | #333 | Tragic 29.4% |
| Swedes | 0.0 /100 | #334 | Tragic 29.4% |
| Immigrants | Taiwan | 0.0 /100 | #335 | Tragic 29.5% |
| English | 0.0 /100 | #336 | Tragic 29.5% |
| Dutch | 0.0 /100 | #337 | Tragic 29.6% |
| Filipinos | 0.0 /100 | #338 | Tragic 29.7% |
| Iranians | 0.0 /100 | #339 | Tragic 29.7% |
| Swiss | 0.0 /100 | #340 | Tragic 30.0% |
| Thais | 0.0 /100 | #341 | Tragic 30.5% |
| Pennsylvania Germans | 0.0 /100 | #342 | Tragic 30.7% |