Immigrants from Hong Kong vs Celtic Wage/Income Gap
COMPARE
Immigrants from Hong Kong
Celtic
Wage/Income Gap
Wage/Income Gap Comparison
Immigrants from Hong Kong
Celtics
25.5%
WAGE/INCOME GAP
64.0/ 100
METRIC RATING
165th/ 347
METRIC RANK
27.3%
WAGE/INCOME GAP
2.8/ 100
METRIC RATING
247th/ 347
METRIC RANK
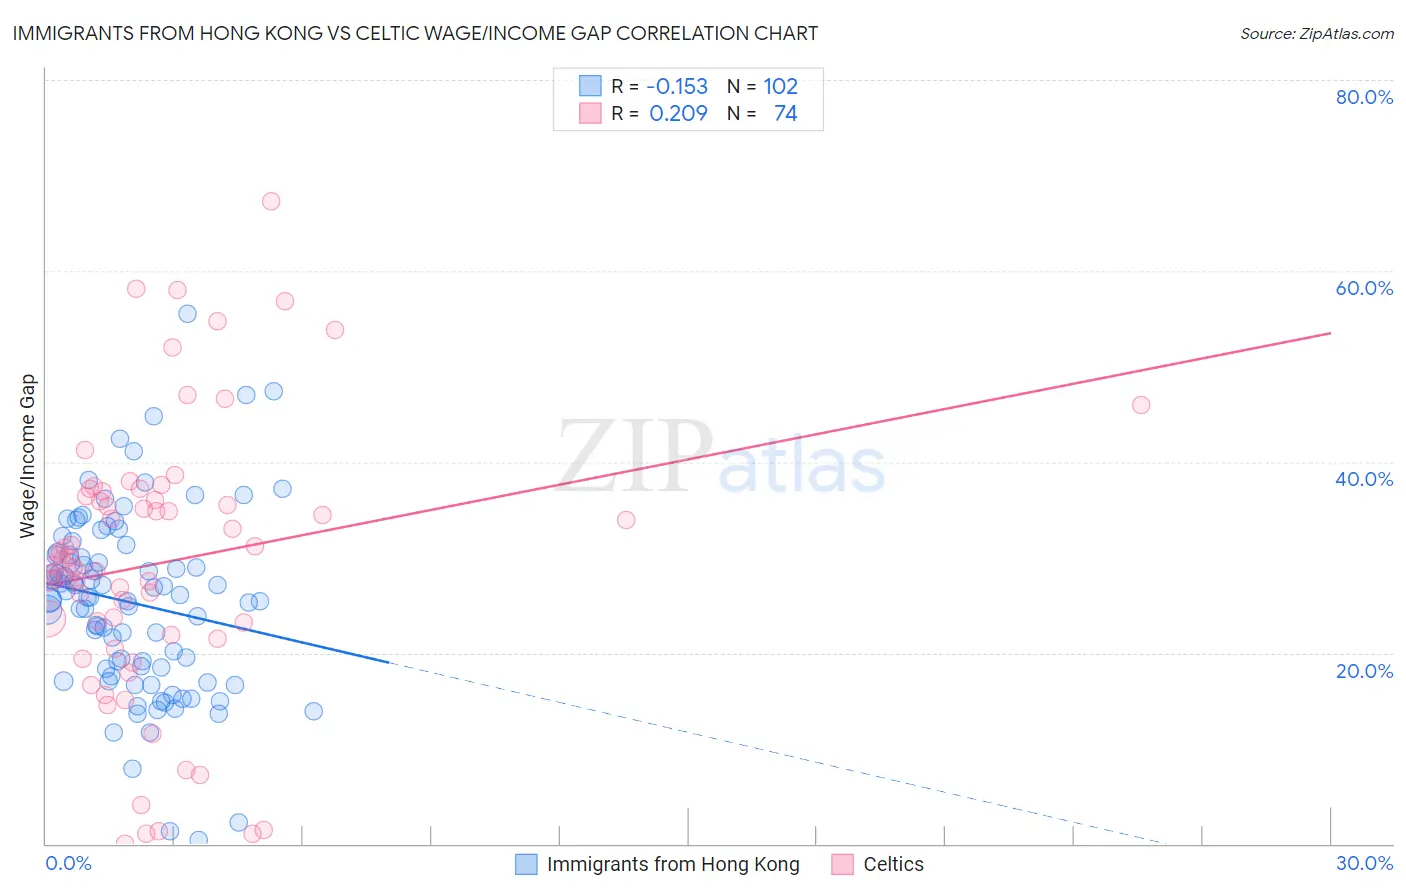
Immigrants from Hong Kong vs Celtic Wage/Income Gap Correlation Chart
The statistical analysis conducted on geographies consisting of 253,936,651 people shows a poor negative correlation between the proportion of Immigrants from Hong Kong and wage/income gap percentage in the United States with a correlation coefficient (R) of -0.153 and weighted average of 25.5%. Similarly, the statistical analysis conducted on geographies consisting of 168,805,315 people shows a weak positive correlation between the proportion of Celtics and wage/income gap percentage in the United States with a correlation coefficient (R) of 0.209 and weighted average of 27.3%, a difference of 6.8%.
Wage/Income Gap Correlation Summary
| Measurement | Immigrants from Hong Kong | Celtic |
| Minimum | 0.36% | 0.040% |
| Maximum | 55.6% | 67.3% |
| Range | 55.2% | 67.3% |
| Mean | 25.2% | 29.4% |
| Median | 25.8% | 29.5% |
| Interquartile 25% (IQ1) | 18.3% | 21.9% |
| Interquartile 75% (IQ3) | 30.3% | 36.4% |
| Interquartile Range (IQR) | 11.9% | 14.5% |
| Standard Deviation (Sample) | 9.6% | 14.3% |
| Standard Deviation (Population) | 9.6% | 14.2% |
Similar Demographics by Wage/Income Gap
Demographics Similar to Immigrants from Hong Kong by Wage/Income Gap
In terms of wage/income gap, the demographic groups most similar to Immigrants from Hong Kong are Immigrants from Ukraine (25.5%, a difference of 0.010%), Paiute (25.5%, a difference of 0.070%), Seminole (25.6%, a difference of 0.090%), Peruvian (25.6%, a difference of 0.27%), and Korean (25.4%, a difference of 0.34%).
| Demographics | Rating | Rank | Wage/Income Gap |
| Immigrants | Zimbabwe | 73.7 /100 | #158 | Good 25.3% |
| Puget Sound Salish | 73.0 /100 | #159 | Good 25.3% |
| French American Indians | 72.5 /100 | #160 | Good 25.4% |
| Albanians | 69.4 /100 | #161 | Good 25.4% |
| Shoshone | 69.0 /100 | #162 | Good 25.4% |
| Native Hawaiians | 69.0 /100 | #163 | Good 25.4% |
| Koreans | 68.6 /100 | #164 | Good 25.4% |
| Immigrants | Hong Kong | 64.0 /100 | #165 | Good 25.5% |
| Immigrants | Ukraine | 63.8 /100 | #166 | Good 25.5% |
| Paiute | 62.9 /100 | #167 | Good 25.5% |
| Seminole | 62.6 /100 | #168 | Good 25.6% |
| Peruvians | 60.1 /100 | #169 | Good 25.6% |
| Immigrants | Oceania | 57.5 /100 | #170 | Average 25.6% |
| Immigrants | Greece | 56.6 /100 | #171 | Average 25.7% |
| Immigrants | Chile | 53.2 /100 | #172 | Average 25.7% |
Demographics Similar to Celtics by Wage/Income Gap
In terms of wage/income gap, the demographic groups most similar to Celtics are Cypriot (27.3%, a difference of 0.010%), Carpatho Rusyn (27.3%, a difference of 0.020%), Immigrants from Czechoslovakia (27.3%, a difference of 0.030%), Immigrants from Norway (27.3%, a difference of 0.14%), and Ukrainian (27.3%, a difference of 0.20%).
| Demographics | Rating | Rank | Wage/Income Gap |
| Immigrants | Europe | 3.8 /100 | #240 | Tragic 27.1% |
| Creek | 3.8 /100 | #241 | Tragic 27.1% |
| Immigrants | Sri Lanka | 3.7 /100 | #242 | Tragic 27.1% |
| Spanish | 3.6 /100 | #243 | Tragic 27.1% |
| Chickasaw | 3.5 /100 | #244 | Tragic 27.2% |
| Immigrants | Azores | 3.5 /100 | #245 | Tragic 27.2% |
| Immigrants | Nonimmigrants | 3.3 /100 | #246 | Tragic 27.2% |
| Celtics | 2.8 /100 | #247 | Tragic 27.3% |
| Cypriots | 2.8 /100 | #248 | Tragic 27.3% |
| Carpatho Rusyns | 2.7 /100 | #249 | Tragic 27.3% |
| Immigrants | Czechoslovakia | 2.7 /100 | #250 | Tragic 27.3% |
| Immigrants | Norway | 2.5 /100 | #251 | Tragic 27.3% |
| Ukrainians | 2.4 /100 | #252 | Tragic 27.3% |
| Portuguese | 2.2 /100 | #253 | Tragic 27.4% |
| Israelis | 2.1 /100 | #254 | Tragic 27.4% |