Immigrants from Hong Kong vs Czech Wage/Income Gap
COMPARE
Immigrants from Hong Kong
Czech
Wage/Income Gap
Wage/Income Gap Comparison
Immigrants from Hong Kong
Czechs
25.5%
WAGE/INCOME GAP
64.0/ 100
METRIC RATING
165th/ 347
METRIC RANK
29.2%
WAGE/INCOME GAP
0.0/ 100
METRIC RATING
331st/ 347
METRIC RANK
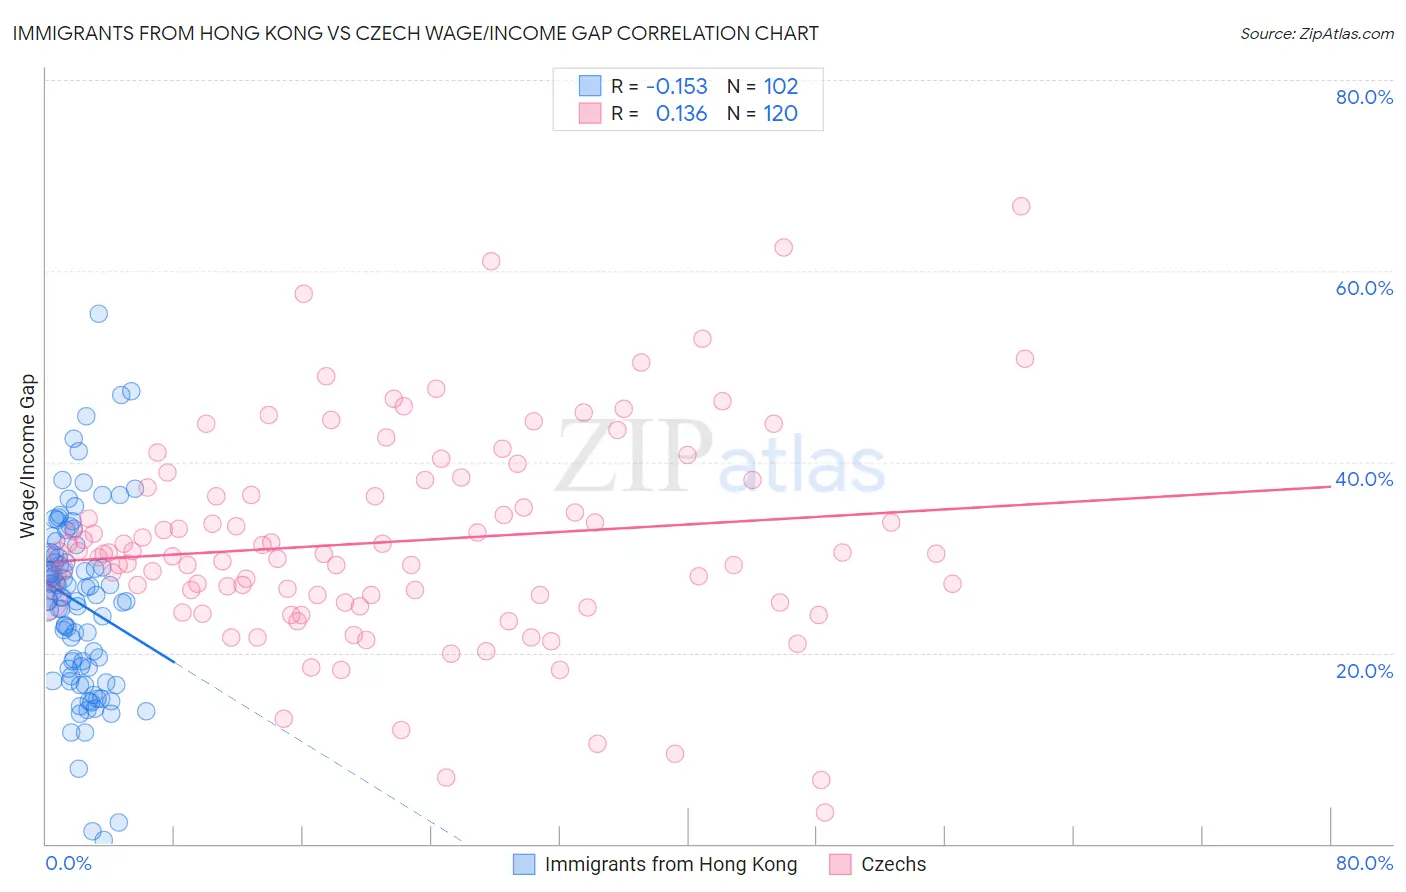
Immigrants from Hong Kong vs Czech Wage/Income Gap Correlation Chart
The statistical analysis conducted on geographies consisting of 253,936,651 people shows a poor negative correlation between the proportion of Immigrants from Hong Kong and wage/income gap percentage in the United States with a correlation coefficient (R) of -0.153 and weighted average of 25.5%. Similarly, the statistical analysis conducted on geographies consisting of 484,001,232 people shows a poor positive correlation between the proportion of Czechs and wage/income gap percentage in the United States with a correlation coefficient (R) of 0.136 and weighted average of 29.2%, a difference of 14.3%.
Wage/Income Gap Correlation Summary
| Measurement | Immigrants from Hong Kong | Czech |
| Minimum | 0.36% | 3.2% |
| Maximum | 55.6% | 66.7% |
| Range | 55.2% | 63.5% |
| Mean | 25.2% | 31.6% |
| Median | 25.8% | 30.4% |
| Interquartile 25% (IQ1) | 18.3% | 25.4% |
| Interquartile 75% (IQ3) | 30.3% | 37.7% |
| Interquartile Range (IQR) | 11.9% | 12.3% |
| Standard Deviation (Sample) | 9.6% | 11.1% |
| Standard Deviation (Population) | 9.6% | 11.0% |
Similar Demographics by Wage/Income Gap
Demographics Similar to Immigrants from Hong Kong by Wage/Income Gap
In terms of wage/income gap, the demographic groups most similar to Immigrants from Hong Kong are Immigrants from Ukraine (25.5%, a difference of 0.010%), Paiute (25.5%, a difference of 0.070%), Seminole (25.6%, a difference of 0.090%), Peruvian (25.6%, a difference of 0.27%), and Korean (25.4%, a difference of 0.34%).
| Demographics | Rating | Rank | Wage/Income Gap |
| Immigrants | Zimbabwe | 73.7 /100 | #158 | Good 25.3% |
| Puget Sound Salish | 73.0 /100 | #159 | Good 25.3% |
| French American Indians | 72.5 /100 | #160 | Good 25.4% |
| Albanians | 69.4 /100 | #161 | Good 25.4% |
| Shoshone | 69.0 /100 | #162 | Good 25.4% |
| Native Hawaiians | 69.0 /100 | #163 | Good 25.4% |
| Koreans | 68.6 /100 | #164 | Good 25.4% |
| Immigrants | Hong Kong | 64.0 /100 | #165 | Good 25.5% |
| Immigrants | Ukraine | 63.8 /100 | #166 | Good 25.5% |
| Paiute | 62.9 /100 | #167 | Good 25.5% |
| Seminole | 62.6 /100 | #168 | Good 25.6% |
| Peruvians | 60.1 /100 | #169 | Good 25.6% |
| Immigrants | Oceania | 57.5 /100 | #170 | Average 25.6% |
| Immigrants | Greece | 56.6 /100 | #171 | Average 25.7% |
| Immigrants | Chile | 53.2 /100 | #172 | Average 25.7% |
Demographics Similar to Czechs by Wage/Income Gap
In terms of wage/income gap, the demographic groups most similar to Czechs are German (29.2%, a difference of 0.050%), Scottish (29.1%, a difference of 0.15%), Scandinavian (29.1%, a difference of 0.29%), Immigrants from Iran (29.1%, a difference of 0.35%), and Immigrants from Belgium (29.0%, a difference of 0.46%).
| Demographics | Rating | Rank | Wage/Income Gap |
| Croatians | 0.0 /100 | #324 | Tragic 29.0% |
| Hungarians | 0.0 /100 | #325 | Tragic 29.0% |
| Immigrants | Belgium | 0.0 /100 | #326 | Tragic 29.0% |
| Immigrants | Iran | 0.0 /100 | #327 | Tragic 29.1% |
| Scandinavians | 0.0 /100 | #328 | Tragic 29.1% |
| Scottish | 0.0 /100 | #329 | Tragic 29.1% |
| Germans | 0.0 /100 | #330 | Tragic 29.2% |
| Czechs | 0.0 /100 | #331 | Tragic 29.2% |
| Immigrants | South Central Asia | 0.0 /100 | #332 | Tragic 29.3% |
| Europeans | 0.0 /100 | #333 | Tragic 29.4% |
| Swedes | 0.0 /100 | #334 | Tragic 29.4% |
| Immigrants | Taiwan | 0.0 /100 | #335 | Tragic 29.5% |
| English | 0.0 /100 | #336 | Tragic 29.5% |
| Dutch | 0.0 /100 | #337 | Tragic 29.6% |
| Filipinos | 0.0 /100 | #338 | Tragic 29.7% |