Immigrants from Hong Kong vs Czechoslovakian Wage/Income Gap
COMPARE
Immigrants from Hong Kong
Czechoslovakian
Wage/Income Gap
Wage/Income Gap Comparison
Immigrants from Hong Kong
Czechoslovakians
25.5%
WAGE/INCOME GAP
64.0/ 100
METRIC RATING
165th/ 347
METRIC RANK
28.2%
WAGE/INCOME GAP
0.3/ 100
METRIC RATING
291st/ 347
METRIC RANK
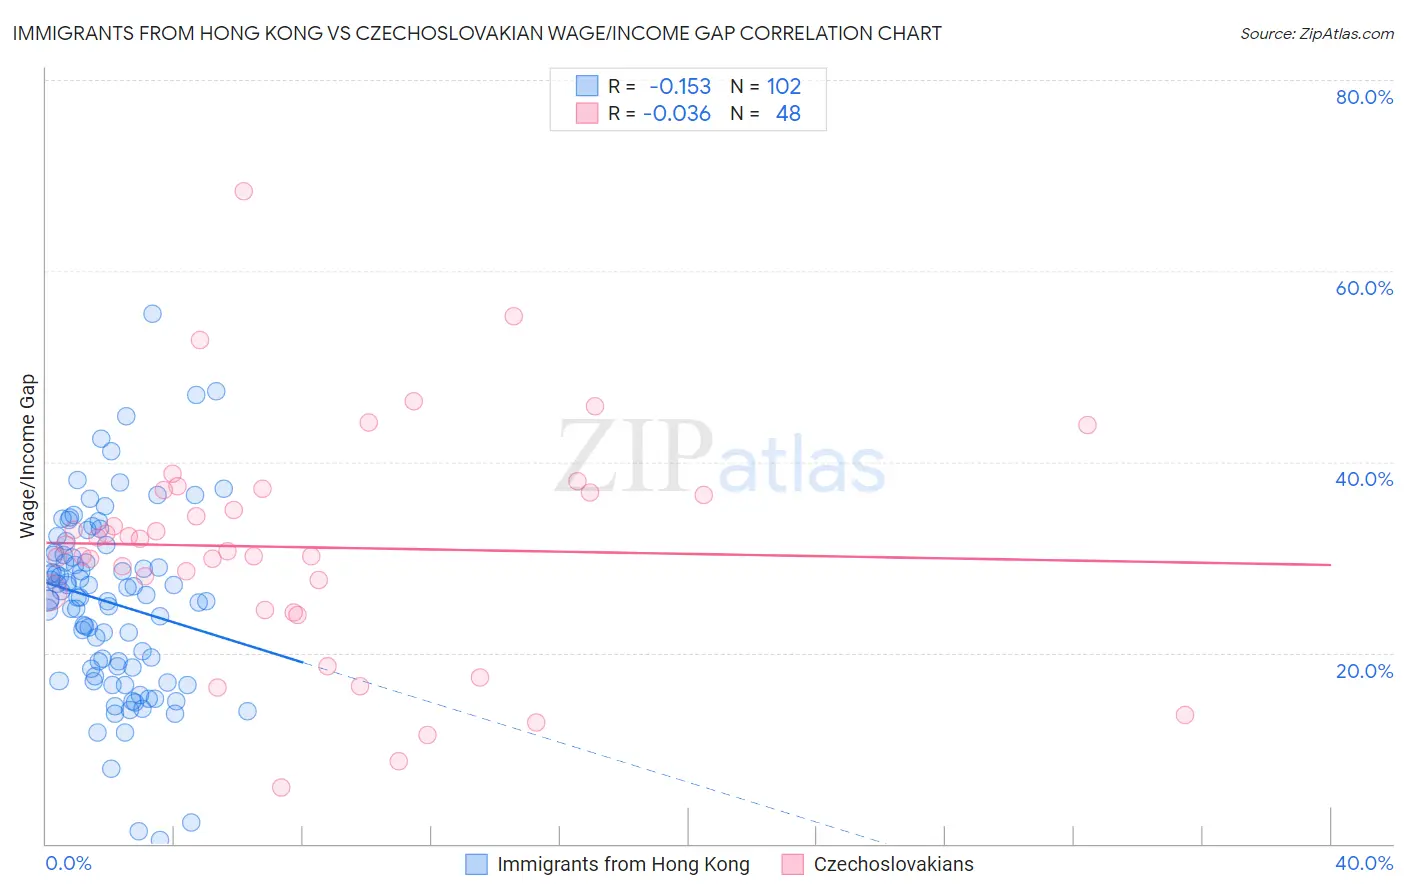
Immigrants from Hong Kong vs Czechoslovakian Wage/Income Gap Correlation Chart
The statistical analysis conducted on geographies consisting of 253,936,651 people shows a poor negative correlation between the proportion of Immigrants from Hong Kong and wage/income gap percentage in the United States with a correlation coefficient (R) of -0.153 and weighted average of 25.5%. Similarly, the statistical analysis conducted on geographies consisting of 368,390,437 people shows no correlation between the proportion of Czechoslovakians and wage/income gap percentage in the United States with a correlation coefficient (R) of -0.036 and weighted average of 28.2%, a difference of 10.4%.
Wage/Income Gap Correlation Summary
| Measurement | Immigrants from Hong Kong | Czechoslovakian |
| Minimum | 0.36% | 6.0% |
| Maximum | 55.6% | 68.3% |
| Range | 55.2% | 62.4% |
| Mean | 25.2% | 31.1% |
| Median | 25.8% | 31.0% |
| Interquartile 25% (IQ1) | 18.3% | 25.4% |
| Interquartile 75% (IQ3) | 30.3% | 36.9% |
| Interquartile Range (IQR) | 11.9% | 11.5% |
| Standard Deviation (Sample) | 9.6% | 11.9% |
| Standard Deviation (Population) | 9.6% | 11.8% |
Similar Demographics by Wage/Income Gap
Demographics Similar to Immigrants from Hong Kong by Wage/Income Gap
In terms of wage/income gap, the demographic groups most similar to Immigrants from Hong Kong are Immigrants from Ukraine (25.5%, a difference of 0.010%), Paiute (25.5%, a difference of 0.070%), Seminole (25.6%, a difference of 0.090%), Peruvian (25.6%, a difference of 0.27%), and Korean (25.4%, a difference of 0.34%).
| Demographics | Rating | Rank | Wage/Income Gap |
| Immigrants | Zimbabwe | 73.7 /100 | #158 | Good 25.3% |
| Puget Sound Salish | 73.0 /100 | #159 | Good 25.3% |
| French American Indians | 72.5 /100 | #160 | Good 25.4% |
| Albanians | 69.4 /100 | #161 | Good 25.4% |
| Shoshone | 69.0 /100 | #162 | Good 25.4% |
| Native Hawaiians | 69.0 /100 | #163 | Good 25.4% |
| Koreans | 68.6 /100 | #164 | Good 25.4% |
| Immigrants | Hong Kong | 64.0 /100 | #165 | Good 25.5% |
| Immigrants | Ukraine | 63.8 /100 | #166 | Good 25.5% |
| Paiute | 62.9 /100 | #167 | Good 25.5% |
| Seminole | 62.6 /100 | #168 | Good 25.6% |
| Peruvians | 60.1 /100 | #169 | Good 25.6% |
| Immigrants | Oceania | 57.5 /100 | #170 | Average 25.6% |
| Immigrants | Greece | 56.6 /100 | #171 | Average 25.7% |
| Immigrants | Chile | 53.2 /100 | #172 | Average 25.7% |
Demographics Similar to Czechoslovakians by Wage/Income Gap
In terms of wage/income gap, the demographic groups most similar to Czechoslovakians are Immigrants from Australia (28.2%, a difference of 0.060%), Australian (28.2%, a difference of 0.070%), Canadian (28.1%, a difference of 0.16%), Immigrants from Israel (28.2%, a difference of 0.16%), and Greek (28.2%, a difference of 0.19%).
| Demographics | Rating | Rank | Wage/Income Gap |
| Immigrants | Sweden | 0.4 /100 | #284 | Tragic 28.1% |
| Italians | 0.4 /100 | #285 | Tragic 28.1% |
| Immigrants | Austria | 0.4 /100 | #286 | Tragic 28.1% |
| Okinawans | 0.4 /100 | #287 | Tragic 28.1% |
| Choctaw | 0.4 /100 | #288 | Tragic 28.1% |
| Canadians | 0.3 /100 | #289 | Tragic 28.1% |
| Australians | 0.3 /100 | #290 | Tragic 28.2% |
| Czechoslovakians | 0.3 /100 | #291 | Tragic 28.2% |
| Immigrants | Australia | 0.3 /100 | #292 | Tragic 28.2% |
| Immigrants | Israel | 0.3 /100 | #293 | Tragic 28.2% |
| Greeks | 0.3 /100 | #294 | Tragic 28.2% |
| Slovenes | 0.3 /100 | #295 | Tragic 28.3% |
| Northern Europeans | 0.3 /100 | #296 | Tragic 28.3% |
| Immigrants | North America | 0.2 /100 | #297 | Tragic 28.4% |
| Austrians | 0.2 /100 | #298 | Tragic 28.4% |