Immigrants from Hong Kong vs Immigrants from Micronesia Wage/Income Gap
COMPARE
Immigrants from Hong Kong
Immigrants from Micronesia
Wage/Income Gap
Wage/Income Gap Comparison
Immigrants from Hong Kong
Immigrants from Micronesia
25.5%
WAGE/INCOME GAP
64.0/ 100
METRIC RATING
165th/ 347
METRIC RANK
24.4%
WAGE/INCOME GAP
95.8/ 100
METRIC RATING
118th/ 347
METRIC RANK
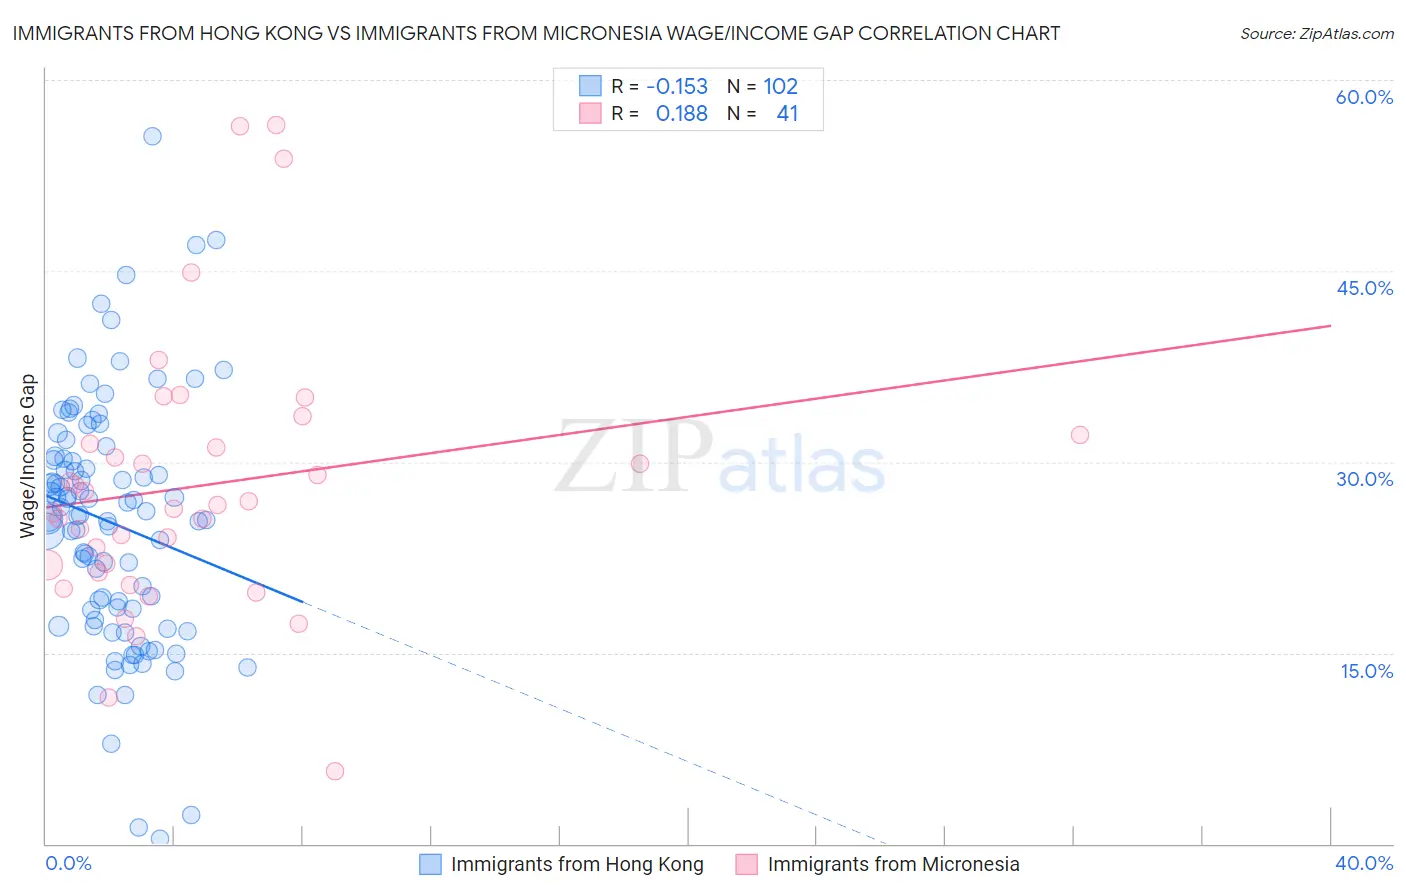
Immigrants from Hong Kong vs Immigrants from Micronesia Wage/Income Gap Correlation Chart
The statistical analysis conducted on geographies consisting of 253,936,651 people shows a poor negative correlation between the proportion of Immigrants from Hong Kong and wage/income gap percentage in the United States with a correlation coefficient (R) of -0.153 and weighted average of 25.5%. Similarly, the statistical analysis conducted on geographies consisting of 61,599,093 people shows a poor positive correlation between the proportion of Immigrants from Micronesia and wage/income gap percentage in the United States with a correlation coefficient (R) of 0.188 and weighted average of 24.4%, a difference of 4.4%.
Wage/Income Gap Correlation Summary
| Measurement | Immigrants from Hong Kong | Immigrants from Micronesia |
| Minimum | 0.36% | 5.7% |
| Maximum | 55.6% | 56.5% |
| Range | 55.2% | 50.8% |
| Mean | 25.2% | 28.1% |
| Median | 25.8% | 26.6% |
| Interquartile 25% (IQ1) | 18.3% | 21.6% |
| Interquartile 75% (IQ3) | 30.3% | 31.8% |
| Interquartile Range (IQR) | 11.9% | 10.1% |
| Standard Deviation (Sample) | 9.6% | 10.6% |
| Standard Deviation (Population) | 9.6% | 10.5% |
Similar Demographics by Wage/Income Gap
Demographics Similar to Immigrants from Hong Kong by Wage/Income Gap
In terms of wage/income gap, the demographic groups most similar to Immigrants from Hong Kong are Immigrants from Ukraine (25.5%, a difference of 0.010%), Paiute (25.5%, a difference of 0.070%), Seminole (25.6%, a difference of 0.090%), Peruvian (25.6%, a difference of 0.27%), and Korean (25.4%, a difference of 0.34%).
| Demographics | Rating | Rank | Wage/Income Gap |
| Immigrants | Zimbabwe | 73.7 /100 | #158 | Good 25.3% |
| Puget Sound Salish | 73.0 /100 | #159 | Good 25.3% |
| French American Indians | 72.5 /100 | #160 | Good 25.4% |
| Albanians | 69.4 /100 | #161 | Good 25.4% |
| Shoshone | 69.0 /100 | #162 | Good 25.4% |
| Native Hawaiians | 69.0 /100 | #163 | Good 25.4% |
| Koreans | 68.6 /100 | #164 | Good 25.4% |
| Immigrants | Hong Kong | 64.0 /100 | #165 | Good 25.5% |
| Immigrants | Ukraine | 63.8 /100 | #166 | Good 25.5% |
| Paiute | 62.9 /100 | #167 | Good 25.5% |
| Seminole | 62.6 /100 | #168 | Good 25.6% |
| Peruvians | 60.1 /100 | #169 | Good 25.6% |
| Immigrants | Oceania | 57.5 /100 | #170 | Average 25.6% |
| Immigrants | Greece | 56.6 /100 | #171 | Average 25.7% |
| Immigrants | Chile | 53.2 /100 | #172 | Average 25.7% |
Demographics Similar to Immigrants from Micronesia by Wage/Income Gap
In terms of wage/income gap, the demographic groups most similar to Immigrants from Micronesia are Kenyan (24.5%, a difference of 0.020%), Immigrants from Afghanistan (24.4%, a difference of 0.030%), Alaska Native (24.4%, a difference of 0.090%), Cree (24.5%, a difference of 0.090%), and Immigrants from Kenya (24.4%, a difference of 0.26%).
| Demographics | Rating | Rank | Wage/Income Gap |
| Soviet Union | 97.6 /100 | #111 | Exceptional 24.2% |
| Immigrants | Colombia | 97.0 /100 | #112 | Exceptional 24.3% |
| Sioux | 96.9 /100 | #113 | Exceptional 24.3% |
| Panamanians | 96.5 /100 | #114 | Exceptional 24.4% |
| Immigrants | Kenya | 96.4 /100 | #115 | Exceptional 24.4% |
| Alaska Natives | 96.0 /100 | #116 | Exceptional 24.4% |
| Immigrants | Afghanistan | 95.9 /100 | #117 | Exceptional 24.4% |
| Immigrants | Micronesia | 95.8 /100 | #118 | Exceptional 24.4% |
| Kenyans | 95.8 /100 | #119 | Exceptional 24.5% |
| Cree | 95.6 /100 | #120 | Exceptional 24.5% |
| Immigrants | Thailand | 94.9 /100 | #121 | Exceptional 24.5% |
| Apache | 94.8 /100 | #122 | Exceptional 24.5% |
| Natives/Alaskans | 94.6 /100 | #123 | Exceptional 24.6% |
| Immigrants | South America | 93.9 /100 | #124 | Exceptional 24.6% |
| Spanish Americans | 93.8 /100 | #125 | Exceptional 24.6% |