Immigrants from Egypt Self-Care Disability
COMPARE
Immigrants from Egypt
Select to Compare
Self-Care Disability
Immigrants from Egypt Self-Care Disability
2.3%
SELF-CARE DISABILITY
99.1/ 100
METRIC RATING
73rd/ 347
METRIC RANK
Immigrants from Egypt Self-Care Disability Correlation Chart
The statistical analysis conducted on geographies consisting of 245,382,985 people shows a weak negative correlation between the proportion of Immigrants from Egypt and percentage of population with self-care disability in the United States with a correlation coefficient (R) of -0.235 and weighted average of 2.3%. On average, for every 1% (one percent) increase in Immigrants from Egypt within a typical geography, there is a decrease of 0.044% in percentage of population with self-care disability.
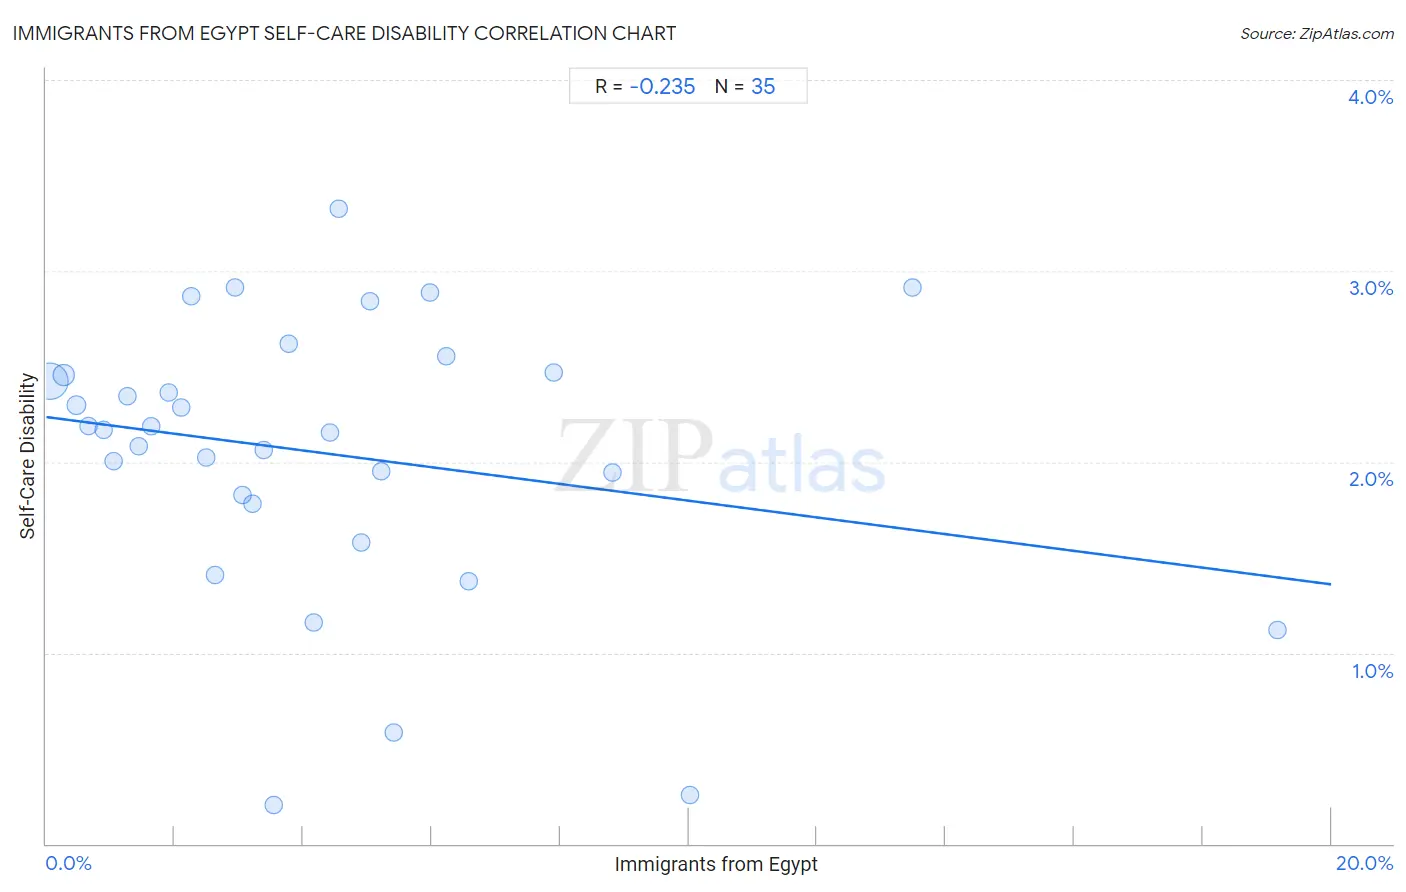
It is essential to understand that the correlation between the percentage of Immigrants from Egypt and percentage of population with self-care disability does not imply a direct cause-and-effect relationship. It remains uncertain whether the presence of Immigrants from Egypt influences an upward or downward trend in the level of percentage of population with self-care disability within an area, or if Immigrants from Egypt simply ended up residing in those areas with higher or lower levels of percentage of population with self-care disability due to other factors.
Demographics Similar to Immigrants from Egypt by Self-Care Disability
In terms of self-care disability, the demographic groups most similar to Immigrants from Egypt are Eastern European (2.3%, a difference of 0.030%), Asian (2.3%, a difference of 0.060%), Immigrants from Switzerland (2.3%, a difference of 0.060%), Immigrants from Northern Europe (2.3%, a difference of 0.090%), and Immigrants from Netherlands (2.3%, a difference of 0.10%).
| Demographics | Rating | Rank | Self-Care Disability |
| Immigrants from Argentina | 99.3 /100 | #66 | Exceptional 2.3% |
| South Africans | 99.3 /100 | #67 | Exceptional 2.3% |
| Immigrants from Zaire | 99.2 /100 | #68 | Exceptional 2.3% |
| Immigrants from Norway | 99.2 /100 | #69 | Exceptional 2.3% |
| Immigrants from Northern Europe | 99.2 /100 | #70 | Exceptional 2.3% |
| Asians | 99.2 /100 | #71 | Exceptional 2.3% |
| Eastern Europeans | 99.2 /100 | #72 | Exceptional 2.3% |
| Immigrants from Egypt | 99.1 /100 | #73 | Exceptional 2.3% |
| Immigrants from Switzerland | 99.1 /100 | #74 | Exceptional 2.3% |
| Immigrants from Netherlands | 99.1 /100 | #75 | Exceptional 2.3% |
| Immigrants from China | 99.1 /100 | #76 | Exceptional 2.3% |
| Immigrants from Middle Africa | 99.0 /100 | #77 | Exceptional 2.3% |
| Immigrants from Ireland | 99.0 /100 | #78 | Exceptional 2.3% |
| Immigrants from Kenya | 99.0 /100 | #79 | Exceptional 2.3% |
| Chileans | 98.8 /100 | #80 | Exceptional 2.3% |
Immigrants from Egypt Self-Care Disability Correlation Summary
| Measurement | Immigrants from Egypt Data | Self-Care Disability Data |
| Minimum | 0.064% | 0.20% |
| Maximum | 19.2% | 3.3% |
| Range | 19.1% | 3.1% |
| Mean | 4.3% | 2.0% |
| Median | 3.4% | 2.2% |
| Interquartile 25% (IQ1) | 1.6% | 1.8% |
| Interquartile 75% (IQ3) | 5.4% | 2.5% |
| Interquartile Range (IQR) | 3.8% | 0.68% |
| Standard Deviation (Sample) | 3.9% | 0.73% |
| Standard Deviation (Population) | 3.9% | 0.72% |
Correlation Details
| Immigrants from Egypt Percentile | Sample Size | Self-Care Disability |
[ 0.0% - 0.5% ] 0.064% | 186,639,746 | 2.4% |
[ 0.0% - 0.5% ] 0.27% | 37,091,634 | 2.5% |
[ 0.0% - 0.5% ] 0.48% | 9,156,366 | 2.3% |
[ 0.5% - 1.0% ] 0.66% | 4,507,734 | 2.2% |
[ 0.5% - 1.0% ] 0.89% | 2,430,909 | 2.2% |
[ 1.0% - 1.5% ] 1.05% | 2,230,008 | 2.0% |
[ 1.0% - 1.5% ] 1.26% | 859,683 | 2.3% |
[ 1.0% - 1.5% ] 1.45% | 473,381 | 2.1% |
[ 1.5% - 2.0% ] 1.63% | 518,843 | 2.2% |
[ 1.5% - 2.0% ] 1.91% | 496,308 | 2.4% |
[ 2.0% - 2.5% ] 2.10% | 267,767 | 2.3% |
[ 2.0% - 2.5% ] 2.25% | 44,085 | 2.9% |
[ 2.0% - 2.5% ] 2.49% | 56,651 | 2.0% |
[ 2.5% - 3.0% ] 2.63% | 53,753 | 1.4% |
[ 2.5% - 3.0% ] 2.94% | 4,832 | 2.9% |
[ 3.0% - 3.5% ] 3.05% | 25,401 | 1.8% |
[ 3.0% - 3.5% ] 3.22% | 51,883 | 1.8% |
[ 3.0% - 3.5% ] 3.38% | 66,906 | 2.1% |
[ 3.5% - 4.0% ] 3.55% | 6,825 | 0.20% |
[ 3.5% - 4.0% ] 3.78% | 50,805 | 2.6% |
[ 4.0% - 4.5% ] 4.17% | 30,450 | 1.2% |
[ 4.0% - 4.5% ] 4.41% | 12,424 | 2.2% |
[ 4.5% - 5.0% ] 4.55% | 1,429 | 3.3% |
[ 4.5% - 5.0% ] 4.89% | 99,800 | 1.6% |
[ 5.0% - 5.5% ] 5.04% | 22,925 | 2.8% |
[ 5.0% - 5.5% ] 5.21% | 8,410 | 1.9% |
[ 5.0% - 5.5% ] 5.40% | 2,815 | 0.58% |
[ 5.5% - 6.0% ] 5.97% | 140,994 | 2.9% |
[ 6.0% - 6.5% ] 6.22% | 8,815 | 2.6% |
[ 6.5% - 7.0% ] 6.58% | 5,000 | 1.4% |
[ 7.5% - 8.0% ] 7.90% | 6,938 | 2.5% |
[ 8.5% - 9.0% ] 8.81% | 1,339 | 1.9% |
[ 10.0% - 10.5% ] 10.02% | 5,751 | 0.26% |
[ 13.0% - 13.5% ] 13.49% | 1,394 | 2.9% |
[ 19.0% - 19.5% ] 19.16% | 981 | 1.1% |