Immigrants from Egypt Disability Age 5 to 17

COMPARE

Immigrants from Egypt
Race
Ancestry
AfghanAfricanAlaska NativeAlaskan AthabascanAlbanianAleutAlsatianAmericanApacheArabArapahoArgentineanArmenianAssyrian/Chaldean/SyriacAustralianAustrianBahamianBangladeshiBarbadianBasqueBelgianBelizeanBermudanBhutaneseBlackfeetBolivianBrazilianBritishBritish West IndianBulgarianBurmeseCajunCambodianCanadianCape VerdeanCarpatho RusynCelticCentral AmericanCentral American IndianCherokeeCheyenneChickasawChileanChineseChippewaChoctawColombianColvilleComancheCosta RicanCreeCreekCroatianCrowCubanCypriotCzechCzechoslovakianDanishDelawareDominicanDutchDutch West IndianEastern EuropeanEcuadorianEgyptianEnglishEstonianEthiopianEuropeanFijianFilipinoFinnishFrenchFrench American IndianFrench CanadianGermanGerman RussianGhanaianGreekGuamanian/ChamorroGuatemalanGuyaneseHaitianHmongHonduranHopiHoumaHungarianIcelanderIndian (Asian)IndonesianInupiatIranianIraqiIrishIroquoisIsraeliItalianJamaicanJapaneseJordanianKenyanKiowaKoreanLaotianLatvianLebaneseLiberianLithuanianLumbeeLuxembourgerMacedonianMalaysianMalteseMarshalleseMenomineeMexicanMexican American IndianMongolianMoroccanNative HawaiianNavajoNepaleseNew ZealanderNicaraguanNigerianNorthern EuropeanNorwegianOkinawanOsageOttawaPaiutePakistaniPalestinianPanamanianParaguayanPennsylvania GermanPeruvianPimaPolishPortuguesePotawatomiPuebloPuerto RicanPuget Sound SalishRomanianRussianSalvadoranSamoanScandinavianScotch-IrishScottishSeminoleSenegaleseSerbianShoshoneSierra LeoneanSiouxSlavicSlovakSloveneSomaliSouth AfricanSouth AmericanSouth American IndianSoviet UnionSpaniardSpanishSpanish AmericanSpanish American IndianSri LankanSubsaharan AfricanSudaneseSwedishSwissSyrianTaiwaneseThaiTlingit-HaidaTohono O'OdhamTonganTrinidadian and TobagonianTsimshianTurkishU.S. Virgin IslanderUgandanUkrainianUruguayanUteVenezuelanVietnameseWelshWest IndianYakamaYaquiYugoslavianYumanYup'ikZimbabwean
Immigration
NonimmigrantsImmigrantsAfghanistanAfricaAlbaniaArgentinaArmeniaAsiaAustraliaAustriaBahamasBangladeshBarbadosBelarusBelgiumBelizeBoliviaBosnia and HerzegovinaBrazilBulgariaBurma/MyanmarCabo VerdeCambodiaCameroonCanadaCaribbeanCentral AmericaChileChinaColombiaCongoCosta RicaCroatiaCubaCzechoslovakiaDenmarkDominicaDominican RepublicEastern AfricaEastern AsiaEastern EuropeEcuadorEgyptEl SalvadorEnglandEritreaEthiopiaEuropeFijiFranceGermanyGhanaGreeceGrenadaGuatemalaGuyanaHaitiHondurasHong KongHungaryIndiaIndonesiaIranIraqIrelandIsraelItalyJamaicaJapanJordanKazakhstanKenyaKoreaKuwaitLaosLatin AmericaLatviaLebanonLiberiaLithuaniaMalaysiaMexicoMicronesiaMiddle AfricaMoldovaMoroccoNepalNetherlandsNicaraguaNigeriaNorth AmericaNorth MacedoniaNorthern AfricaNorthern EuropeNorwayOceaniaPakistanPanamaPeruPhilippinesPolandPortugalRomaniaRussiaSaudi ArabiaScotlandSenegalSerbiaSierra LeoneSingaporeSomaliaSouth AfricaSouth AmericaSouth Central AsiaSouth Eastern AsiaSouthern EuropeSpainSri LankaSt. Vincent and the GrenadinesSudanSwedenSwitzerlandSyriaTaiwanThailandTrinidad and TobagoTurkeyUgandaUkraineUruguayUzbekistanVenezuelaVietnamWest IndiesWestern AfricaWestern AsiaWestern EuropeYemenZaireZimbabweAzores
Select to Compare
Race
Ancestry
AfghanAfricanAlaska NativeAlaskan AthabascanAlbanianAleutAlsatianAmericanApacheArabArapahoArgentineanArmenianAssyrian/Chaldean/SyriacAustralianAustrianBahamianBangladeshiBarbadianBasqueBelgianBelizeanBermudanBhutaneseBlackfeetBolivianBrazilianBritishBritish West IndianBulgarianBurmeseCajunCambodianCanadianCape VerdeanCarpatho RusynCelticCentral AmericanCentral American IndianCherokeeCheyenneChickasawChileanChineseChippewaChoctawColombianColvilleComancheCosta RicanCreeCreekCroatianCrowCubanCypriotCzechCzechoslovakianDanishDelawareDominicanDutchDutch West IndianEastern EuropeanEcuadorianEgyptianEnglishEstonianEthiopianEuropeanFijianFilipinoFinnishFrenchFrench American IndianFrench CanadianGermanGerman RussianGhanaianGreekGuamanian/ChamorroGuatemalanGuyaneseHaitianHmongHonduranHopiHoumaHungarianIcelanderIndian (Asian)IndonesianInupiatIranianIraqiIrishIroquoisIsraeliItalianJamaicanJapaneseJordanianKenyanKiowaKoreanLaotianLatvianLebaneseLiberianLithuanianLumbeeLuxembourgerMacedonianMalaysianMalteseMarshalleseMenomineeMexicanMexican American IndianMongolianMoroccanNative HawaiianNavajoNepaleseNew ZealanderNicaraguanNigerianNorthern EuropeanNorwegianOkinawanOsageOttawaPaiutePakistaniPalestinianPanamanianParaguayanPennsylvania GermanPeruvianPimaPolishPortuguesePotawatomiPuebloPuerto RicanPuget Sound SalishRomanianRussianSalvadoranSamoanScandinavianScotch-IrishScottishSeminoleSenegaleseSerbianShoshoneSierra LeoneanSiouxSlavicSlovakSloveneSomaliSouth AfricanSouth AmericanSouth American IndianSoviet UnionSpaniardSpanishSpanish AmericanSpanish American IndianSri LankanSubsaharan AfricanSudaneseSwedishSwissSyrianTaiwaneseThaiTlingit-HaidaTohono O'OdhamTonganTrinidadian and TobagonianTsimshianTurkishU.S. Virgin IslanderUgandanUkrainianUruguayanUteVenezuelanVietnameseWelshWest IndianYakamaYaquiYugoslavianYumanYup'ikZimbabwean
Immigration
NonimmigrantsImmigrantsAfghanistanAfricaAlbaniaArgentinaArmeniaAsiaAustraliaAustriaBahamasBangladeshBarbadosBelarusBelgiumBelizeBoliviaBosnia and HerzegovinaBrazilBulgariaBurma/MyanmarCabo VerdeCambodiaCameroonCanadaCaribbeanCentral AmericaChileChinaColombiaCongoCosta RicaCroatiaCubaCzechoslovakiaDenmarkDominicaDominican RepublicEastern AfricaEastern AsiaEastern EuropeEcuadorEl SalvadorEnglandEritreaEthiopiaEuropeFijiFranceGermanyGhanaGreeceGrenadaGuatemalaGuyanaHaitiHondurasHong KongHungaryIndiaIndonesiaIranIraqIrelandIsraelItalyJamaicaJapanJordanKazakhstanKenyaKoreaKuwaitLaosLatin AmericaLatviaLebanonLiberiaLithuaniaMalaysiaMexicoMicronesiaMiddle AfricaMoldovaMoroccoNepalNetherlandsNicaraguaNigeriaNorth AmericaNorth MacedoniaNorthern AfricaNorthern EuropeNorwayOceaniaPakistanPanamaPeruPhilippinesPolandPortugalRomaniaRussiaSaudi ArabiaScotlandSenegalSerbiaSierra LeoneSingaporeSomaliaSouth AfricaSouth AmericaSouth Central AsiaSouth Eastern AsiaSouthern EuropeSpainSri LankaSt. Vincent and the GrenadinesSudanSwedenSwitzerlandSyriaTaiwanThailandTrinidad and TobagoTurkeyUgandaUkraineUruguayUzbekistanVenezuelaVietnamWest IndiesWestern AfricaWestern AsiaWestern EuropeYemenZaireZimbabweAzores
Disability Age 5 to 17
Income
Poverty
Unemployment
Labor Participation
Family Structure
Vehicle Availability
Education Level
Disability

Immigrants from Egypt Disability Age 5 to 17
Exceptional

5.0%
DISABILITY | AGE 5 TO 17
100.0/ 100
METRIC RATING
36th/ 347
METRIC RANK

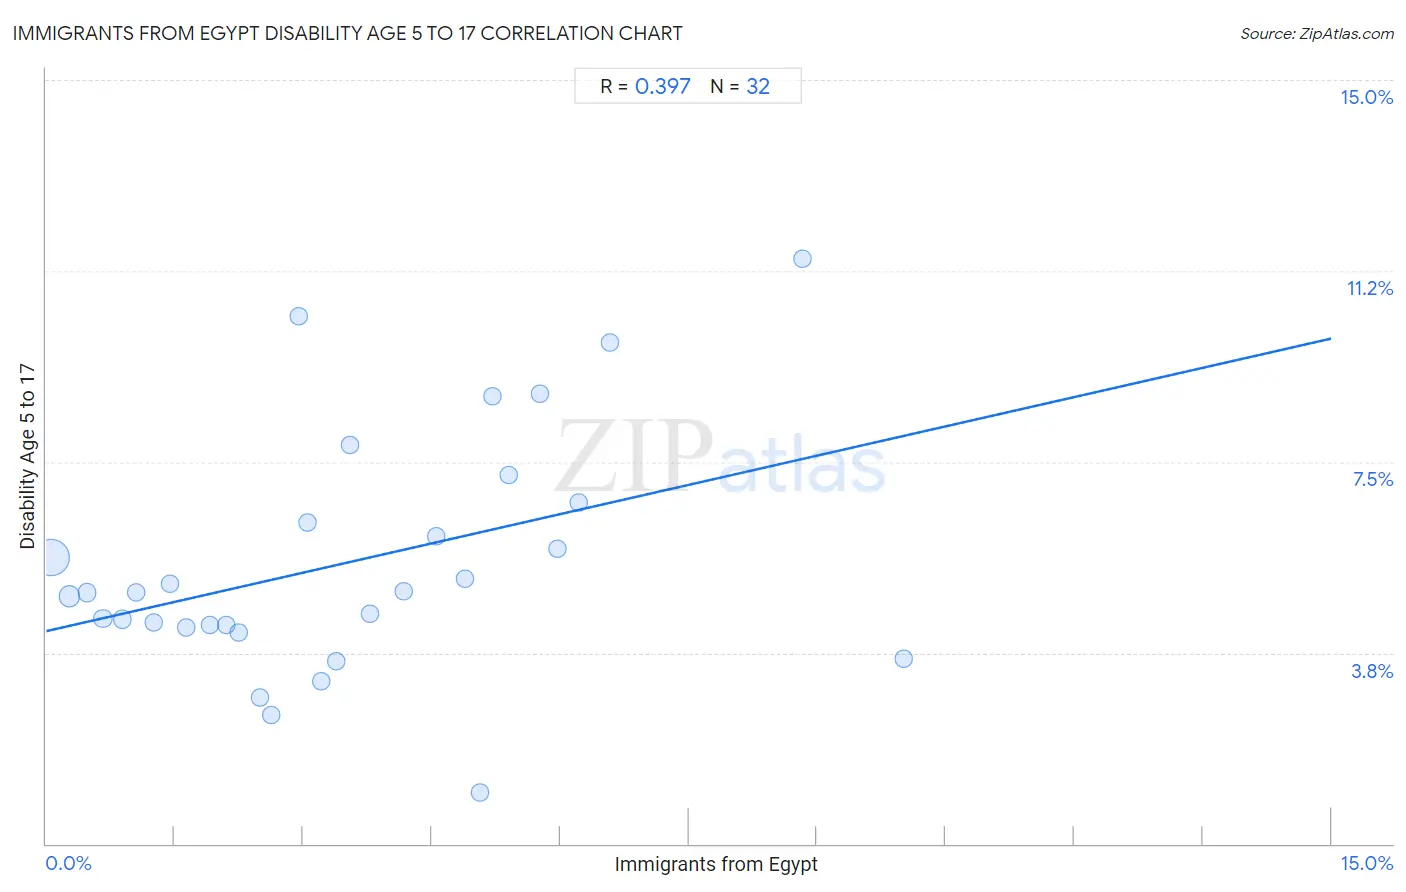
Immigrants from Egypt Disability Age 5 to 17 Correlation Chart

The statistical analysis conducted on geographies consisting of 244,261,461 people shows a mild positive correlation between the proportion of Immigrants from Egypt and percentage of population with a disability between the ages 5 and 17 in the United States with a correlation coefficient (R) of 0.397 and weighted average of 5.0%. On average, for every 1% (one percent) increase in Immigrants from Egypt within a typical geography, there is an increase of 0.38% in percentage of population with a disability between the ages 5 and 17.
Immigrants from Egypt Disability Age 5 to 17
It is essential to understand that the correlation between the percentage of Immigrants from Egypt and percentage of population with a disability between the ages 5 and 17 does not imply a direct cause-and-effect relationship. It remains uncertain whether the presence of Immigrants from Egypt influences an upward or downward trend in the level of percentage of population with a disability between the ages 5 and 17 within an area, or if Immigrants from Egypt simply ended up residing in those areas with higher or lower levels of percentage of population with a disability between the ages 5 and 17 due to other factors.

Demographics Similar to Immigrants from Egypt by Disability Age 5 to 17

In terms of disability age 5 to 17, the demographic groups most similar to Immigrants from Egypt are Immigrants from Belarus (5.0%, a difference of 0.030%), Bolivian (5.0%, a difference of 0.050%), Immigrants from Philippines (5.0%, a difference of 0.070%), Immigrants from Argentina (5.0%, a difference of 0.080%), and Okinawan (5.0%, a difference of 0.15%).
DemographicsRating | RankDisability Age 5 to 17
Immigrants from Serbia
100.0
/100
|
#29
Exceptional
4.9%
Immigrants from Malaysia
100.0
/100
|
#30
Exceptional
5.0%
Immigrants from Pakistan
100.0
/100
|
#31
Exceptional
5.0%
Soviet Union
100.0
/100
|
#32
Exceptional
5.0%
Immigrants from Indonesia
100.0
/100
|
#33
Exceptional
5.0%
Israelis
100.0
/100
|
#34
Exceptional
5.0%
Bolivians
100.0
/100
|
#35
Exceptional
5.0%
Immigrants from Egypt
100.0
/100
|
#36
Exceptional
5.0%
Immigrants from Belarus
100.0
/100
|
#37
Exceptional
5.0%
Immigrants from Philippines
100.0
/100
|
#38
Exceptional
5.0%
Immigrants from Argentina
100.0
/100
|
#39
Exceptional
5.0%
Okinawans
100.0
/100
|
#40
Exceptional
5.0%
Immigrants from Australia
100.0
/100
|
#41
Exceptional
5.0%
Immigrants from Sri Lanka
100.0
/100
|
#42
Exceptional
5.0%
Immigrants from Russia
100.0
/100
|
#43
Exceptional
5.0%

Immigrants from Egypt Disability Age 5 to 17 Correlation Summary

MeasurementImmigrants from Egypt DataDisability Age 5 to 17 Data
Minimum0.064%1.0%
Maximum10.0%11.5%
Range10.0%10.5%
Mean3.5%5.5%
Median3.1%4.9%
Interquartile 25% (IQ1)1.5%4.3%
Interquartile 75% (IQ3)5.1%6.5%
Interquartile Range (IQR)3.6%2.2%
Standard Deviation (Sample)2.4%2.4%
Standard Deviation (Population)2.4%2.3%

Correlation Details

Immigrants from Egypt PercentileSample SizeDisability Age 5 to 17
[
0.0%
-
0.5%
]
0.064%
186,094,1655.6%
[
0.0%
-
0.5%
]
0.27%
36,798,0604.9%
[
0.0%
-
0.5%
]
0.48%
9,043,6584.9%
[
0.5%
-
1.0%
]
0.66%
4,468,9804.4%
[
0.5%
-
1.0%
]
0.89%
2,405,9584.4%
[
1.0%
-
1.5%
]
1.05%
2,190,5994.9%
[
1.0%
-
1.5%
]
1.26%
859,4854.3%
[
1.0%
-
1.5%
]
1.45%
470,2645.1%
[
1.5%
-
2.0%
]
1.63%
516,1124.2%
[
1.5%
-
2.0%
]
1.91%
486,0624.3%
[
2.0%
-
2.5%
]
2.10%
267,7674.3%
[
2.0%
-
2.5%
]
2.24%
40,0094.1%
[
2.0%
-
2.5%
]
2.49%
55,3682.9%
[
2.5%
-
3.0%
]
2.63%
49,8982.5%
[
2.5%
-
3.0%
]
2.94%
3,53510.4%
[
3.0%
-
3.5%
]
3.05%
23,7986.3%
[
3.0%
-
3.5%
]
3.22%
51,8833.2%
[
3.0%
-
3.5%
]
3.38%
54,7793.6%
[
3.5%
-
4.0%
]
3.54%
6,2387.8%
[
3.5%
-
4.0%
]
3.78%
50,8054.5%
[
4.0%
-
4.5%
]
4.17%
30,4505.0%
[
4.5%
-
5.0%
]
4.55%
1,4296.0%
[
4.5%
-
5.0%
]
4.89%
99,8005.2%
[
5.0%
-
5.5%
]
5.07%
18,6721.0%
[
5.0%
-
5.5%
]
5.21%
8,4108.8%
[
5.0%
-
5.5%
]
5.40%
2,8157.2%
[
5.5%
-
6.0%
]
5.76%
7478.8%
[
5.5%
-
6.0%
]
5.97%
140,9945.8%
[
6.0%
-
6.5%
]
6.22%
8,8156.7%
[
6.5%
-
7.0%
]
6.58%
5,0009.8%
[
8.5%
-
9.0%
]
8.83%
1,15511.5%
[
10.0%
-
10.5%
]
10.02%
5,7513.6%