Immigrants from Egypt vs Lithuanian Wage/Income Gap
COMPARE
Immigrants from Egypt
Lithuanian
Wage/Income Gap
Wage/Income Gap Comparison
Immigrants from Egypt
Lithuanians
26.1%
WAGE/INCOME GAP
29.9/ 100
METRIC RATING
188th/ 347
METRIC RANK
28.7%
WAGE/INCOME GAP
0.1/ 100
METRIC RATING
316th/ 347
METRIC RANK
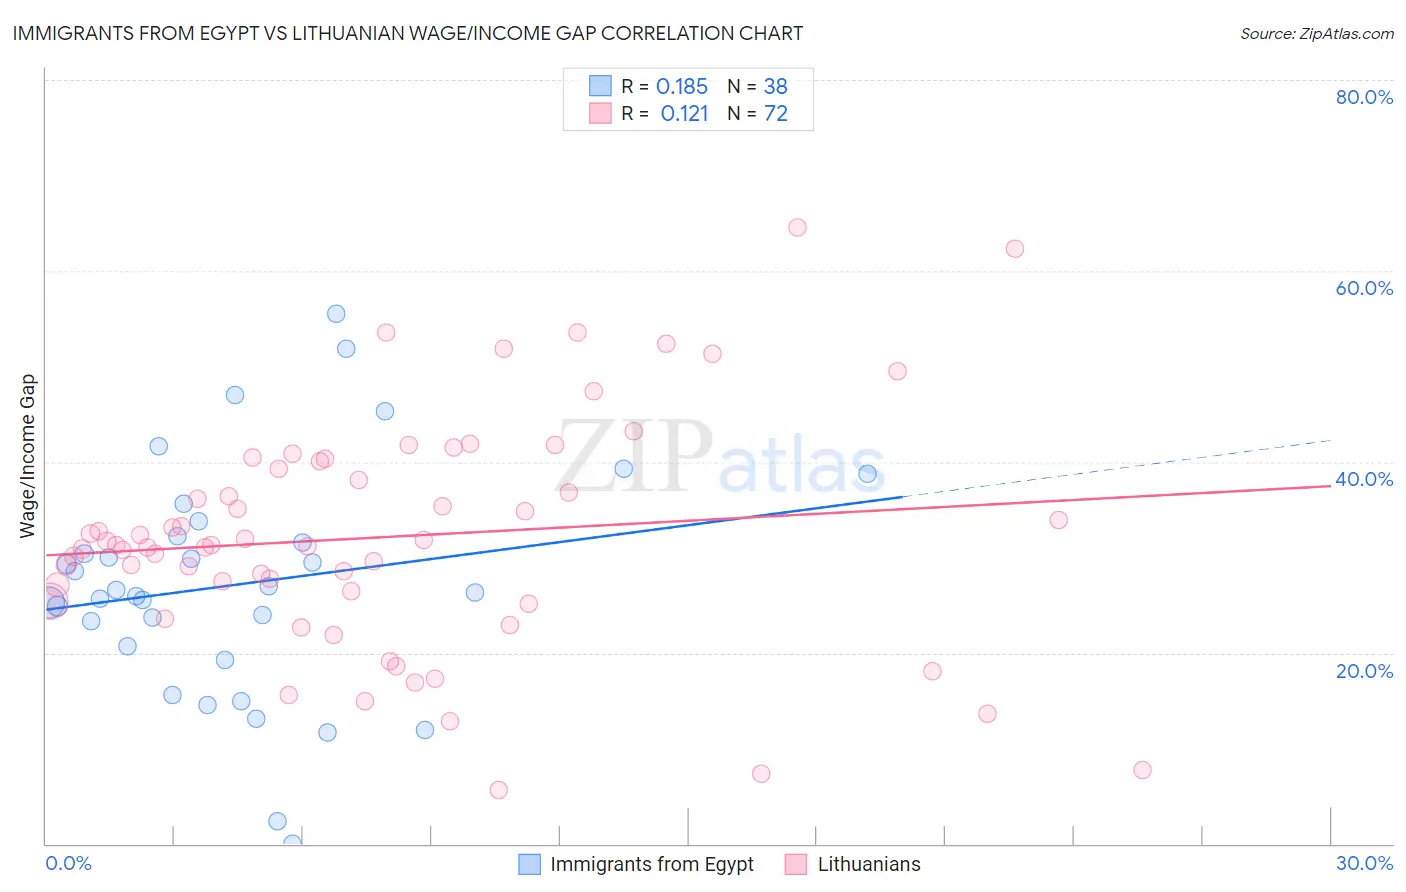
Immigrants from Egypt vs Lithuanian Wage/Income Gap Correlation Chart
The statistical analysis conducted on geographies consisting of 245,435,897 people shows a poor positive correlation between the proportion of Immigrants from Egypt and wage/income gap percentage in the United States with a correlation coefficient (R) of 0.185 and weighted average of 26.1%. Similarly, the statistical analysis conducted on geographies consisting of 421,511,979 people shows a poor positive correlation between the proportion of Lithuanians and wage/income gap percentage in the United States with a correlation coefficient (R) of 0.121 and weighted average of 28.7%, a difference of 10.0%.
Wage/Income Gap Correlation Summary
| Measurement | Immigrants from Egypt | Lithuanian |
| Minimum | 0.012% | 5.6% |
| Maximum | 55.6% | 64.5% |
| Range | 55.5% | 58.9% |
| Mean | 27.2% | 32.1% |
| Median | 26.5% | 31.3% |
| Interquartile 25% (IQ1) | 20.8% | 25.9% |
| Interquartile 75% (IQ3) | 32.2% | 39.7% |
| Interquartile Range (IQR) | 11.4% | 13.8% |
| Standard Deviation (Sample) | 12.1% | 12.1% |
| Standard Deviation (Population) | 12.0% | 12.0% |
Similar Demographics by Wage/Income Gap
Demographics Similar to Immigrants from Egypt by Wage/Income Gap
In terms of wage/income gap, the demographic groups most similar to Immigrants from Egypt are Palestinian (26.1%, a difference of 0.010%), Immigrants from Indonesia (26.1%, a difference of 0.20%), Immigrants from Moldova (26.2%, a difference of 0.26%), Pakistani (26.1%, a difference of 0.29%), and Mexican (26.0%, a difference of 0.34%).
| Demographics | Rating | Rank | Wage/Income Gap |
| Immigrants | Bolivia | 36.4 /100 | #181 | Fair 26.0% |
| Immigrants | Serbia | 35.4 /100 | #182 | Fair 26.0% |
| Immigrants | Kazakhstan | 35.2 /100 | #183 | Fair 26.0% |
| Mexicans | 34.4 /100 | #184 | Fair 26.0% |
| Pakistanis | 33.7 /100 | #185 | Fair 26.1% |
| Immigrants | Indonesia | 32.5 /100 | #186 | Fair 26.1% |
| Palestinians | 29.9 /100 | #187 | Fair 26.1% |
| Immigrants | Egypt | 29.9 /100 | #188 | Fair 26.1% |
| Immigrants | Moldova | 26.6 /100 | #189 | Fair 26.2% |
| Immigrants | Croatia | 24.8 /100 | #190 | Fair 26.2% |
| Immigrants | Venezuela | 24.7 /100 | #191 | Fair 26.2% |
| Immigrants | Bulgaria | 22.5 /100 | #192 | Fair 26.3% |
| Immigrants | Jordan | 22.4 /100 | #193 | Fair 26.3% |
| Chileans | 22.3 /100 | #194 | Fair 26.3% |
| Immigrants | Malaysia | 22.2 /100 | #195 | Fair 26.3% |
Demographics Similar to Lithuanians by Wage/Income Gap
In terms of wage/income gap, the demographic groups most similar to Lithuanians are Maltese (28.7%, a difference of 0.010%), Immigrants from Scotland (28.7%, a difference of 0.060%), Belgian (28.8%, a difference of 0.11%), Basque (28.8%, a difference of 0.16%), and French (28.7%, a difference of 0.20%).
| Demographics | Rating | Rank | Wage/Income Gap |
| Macedonians | 0.1 /100 | #309 | Tragic 28.6% |
| Finns | 0.1 /100 | #310 | Tragic 28.6% |
| Immigrants | Lithuania | 0.1 /100 | #311 | Tragic 28.6% |
| Eastern Europeans | 0.1 /100 | #312 | Tragic 28.6% |
| French | 0.1 /100 | #313 | Tragic 28.7% |
| Immigrants | Scotland | 0.1 /100 | #314 | Tragic 28.7% |
| Maltese | 0.1 /100 | #315 | Tragic 28.7% |
| Lithuanians | 0.1 /100 | #316 | Tragic 28.7% |
| Belgians | 0.1 /100 | #317 | Tragic 28.8% |
| Basques | 0.1 /100 | #318 | Tragic 28.8% |
| Slovaks | 0.1 /100 | #319 | Tragic 28.9% |
| British | 0.1 /100 | #320 | Tragic 28.9% |
| Welsh | 0.1 /100 | #321 | Tragic 28.9% |
| Immigrants | Singapore | 0.1 /100 | #322 | Tragic 28.9% |
| Norwegians | 0.1 /100 | #323 | Tragic 29.0% |