Immigrants from Eastern Europe vs Colville Wage/Income Gap

COMPARE

Immigrants from Eastern Europe
Race
Ancestry
AfghanAfricanAlaska NativeAlaskan AthabascanAlbanianAleutAlsatianAmericanApacheArabArapahoArgentineanArmenianAssyrian/Chaldean/SyriacAustralianAustrianBahamianBangladeshiBarbadianBasqueBelgianBelizeanBermudanBhutaneseBlackfeetBolivianBrazilianBritishBritish West IndianBulgarianBurmeseCajunCambodianCanadianCape VerdeanCarpatho RusynCelticCentral AmericanCentral American IndianCherokeeCheyenneChickasawChileanChineseChippewaChoctawColombianComancheCosta RicanCreeCreekCroatianCrowCubanCypriotCzechCzechoslovakianDanishDelawareDominicanDutchDutch West IndianEastern EuropeanEcuadorianEgyptianEnglishEstonianEthiopianEuropeanFijianFilipinoFinnishFrenchFrench American IndianFrench CanadianGermanGerman RussianGhanaianGreekGuamanian/ChamorroGuatemalanGuyaneseHaitianHmongHonduranHopiHoumaHungarianIcelanderIndian (Asian)IndonesianInupiatIranianIraqiIrishIroquoisIsraeliItalianJamaicanJapaneseJordanianKenyanKiowaKoreanLaotianLatvianLebaneseLiberianLithuanianLumbeeLuxembourgerMacedonianMalaysianMalteseMarshalleseMenomineeMexicanMexican American IndianMongolianMoroccanNative HawaiianNavajoNepaleseNew ZealanderNicaraguanNigerianNorthern EuropeanNorwegianOkinawanOsageOttawaPaiutePakistaniPalestinianPanamanianParaguayanPennsylvania GermanPeruvianPimaPolishPortuguesePotawatomiPuebloPuerto RicanPuget Sound SalishRomanianRussianSalvadoranSamoanScandinavianScotch-IrishScottishSeminoleSenegaleseSerbianShoshoneSierra LeoneanSiouxSlavicSlovakSloveneSomaliSouth AfricanSouth AmericanSouth American IndianSoviet UnionSpaniardSpanishSpanish AmericanSpanish American IndianSri LankanSubsaharan AfricanSudaneseSwedishSwissSyrianTaiwaneseThaiTlingit-HaidaTohono O'OdhamTonganTrinidadian and TobagonianTsimshianTurkishU.S. Virgin IslanderUgandanUkrainianUruguayanUteVenezuelanVietnameseWelshWest IndianYakamaYaquiYugoslavianYumanYup'ikZimbabwean
Immigration
NonimmigrantsImmigrantsAfghanistanAfricaAlbaniaArgentinaArmeniaAsiaAustraliaAustriaBahamasBangladeshBarbadosBelarusBelgiumBelizeBoliviaBosnia and HerzegovinaBrazilBulgariaBurma/MyanmarCabo VerdeCambodiaCameroonCanadaCaribbeanCentral AmericaChileChinaColombiaCongoCosta RicaCroatiaCubaCzechoslovakiaDenmarkDominicaDominican RepublicEastern AfricaEastern AsiaEastern EuropeEcuadorEgyptEl SalvadorEnglandEritreaEthiopiaEuropeFijiFranceGermanyGhanaGreeceGrenadaGuatemalaGuyanaHaitiHondurasHong KongHungaryIndiaIndonesiaIranIraqIrelandIsraelItalyJamaicaJapanJordanKazakhstanKenyaKoreaKuwaitLaosLatin AmericaLatviaLebanonLiberiaLithuaniaMalaysiaMexicoMicronesiaMiddle AfricaMoldovaMoroccoNepalNetherlandsNicaraguaNigeriaNorth AmericaNorth MacedoniaNorthern AfricaNorthern EuropeNorwayOceaniaPakistanPanamaPeruPhilippinesPolandPortugalRomaniaRussiaSaudi ArabiaScotlandSenegalSerbiaSierra LeoneSingaporeSomaliaSouth AfricaSouth AmericaSouth Central AsiaSouth Eastern AsiaSouthern EuropeSpainSri LankaSt. Vincent and the GrenadinesSudanSwedenSwitzerlandSyriaTaiwanThailandTrinidad and TobagoTurkeyUgandaUkraineUruguayUzbekistanVenezuelaVietnamWest IndiesWestern AfricaWestern AsiaWestern EuropeYemenZaireZimbabweAzores
Colville
Race
Ancestry
AfghanAfricanAlaska NativeAlaskan AthabascanAlbanianAleutAlsatianAmericanApacheArabArapahoArgentineanArmenianAssyrian/Chaldean/SyriacAustralianAustrianBahamianBangladeshiBarbadianBasqueBelgianBelizeanBermudanBhutaneseBlackfeetBolivianBrazilianBritishBritish West IndianBulgarianBurmeseCajunCambodianCanadianCape VerdeanCarpatho RusynCelticCentral AmericanCentral American IndianCherokeeCheyenneChickasawChileanChineseChippewaChoctawColombianColvilleComancheCosta RicanCreeCreekCroatianCrowCubanCypriotCzechCzechoslovakianDanishDelawareDominicanDutchDutch West IndianEastern EuropeanEcuadorianEgyptianEnglishEstonianEthiopianEuropeanFijianFilipinoFinnishFrenchFrench American IndianFrench CanadianGermanGerman RussianGhanaianGreekGuamanian/ChamorroGuatemalanGuyaneseHaitianHmongHonduranHopiHoumaHungarianIcelanderIndian (Asian)IndonesianInupiatIranianIraqiIrishIroquoisIsraeliItalianJamaicanJapaneseJordanianKenyanKiowaKoreanLaotianLatvianLebaneseLiberianLithuanianLumbeeLuxembourgerMacedonianMalaysianMalteseMarshalleseMenomineeMexicanMexican American IndianMongolianMoroccanNative HawaiianNavajoNepaleseNew ZealanderNicaraguanNigerianNorthern EuropeanNorwegianOkinawanOsageOttawaPaiutePakistaniPalestinianPanamanianParaguayanPennsylvania GermanPeruvianPimaPolishPortuguesePotawatomiPuebloPuerto RicanPuget Sound SalishRomanianRussianSalvadoranSamoanScandinavianScotch-IrishScottishSeminoleSenegaleseSerbianShoshoneSierra LeoneanSiouxSlavicSlovakSloveneSomaliSouth AfricanSouth AmericanSouth American IndianSoviet UnionSpaniardSpanishSpanish AmericanSpanish American IndianSri LankanSubsaharan AfricanSudaneseSwedishSwissSyrianTaiwaneseThaiTlingit-HaidaTohono O'OdhamTonganTrinidadian and TobagonianTsimshianTurkishU.S. Virgin IslanderUgandanUkrainianUruguayanUteVenezuelanVietnameseWelshWest IndianYakamaYaquiYugoslavianYumanYup'ikZimbabwean
Immigration
NonimmigrantsImmigrantsAfghanistanAfricaAlbaniaArgentinaArmeniaAsiaAustraliaAustriaBahamasBangladeshBarbadosBelarusBelgiumBelizeBoliviaBosnia and HerzegovinaBrazilBulgariaBurma/MyanmarCabo VerdeCambodiaCameroonCanadaCaribbeanCentral AmericaChileChinaColombiaCongoCosta RicaCroatiaCubaCzechoslovakiaDenmarkDominicaDominican RepublicEastern AfricaEastern AsiaEcuadorEgyptEl SalvadorEnglandEritreaEthiopiaEuropeFijiFranceGermanyGhanaGreeceGrenadaGuatemalaGuyanaHaitiHondurasHong KongHungaryIndiaIndonesiaIranIraqIrelandIsraelItalyJamaicaJapanJordanKazakhstanKenyaKoreaKuwaitLaosLatin AmericaLatviaLebanonLiberiaLithuaniaMalaysiaMexicoMicronesiaMiddle AfricaMoldovaMoroccoNepalNetherlandsNicaraguaNigeriaNorth AmericaNorth MacedoniaNorthern AfricaNorthern EuropeNorwayOceaniaPakistanPanamaPeruPhilippinesPolandPortugalRomaniaRussiaSaudi ArabiaScotlandSenegalSerbiaSierra LeoneSingaporeSomaliaSouth AfricaSouth AmericaSouth Central AsiaSouth Eastern AsiaSouthern EuropeSpainSri LankaSt. Vincent and the GrenadinesSudanSwedenSwitzerlandSyriaTaiwanThailandTrinidad and TobagoTurkeyUgandaUkraineUruguayUzbekistanVenezuelaVietnamWest IndiesWestern AfricaWestern AsiaWestern EuropeYemenZaireZimbabweAzores
Wage/Income Gap
Income
Poverty
Unemployment
Labor Participation
Family Structure
Vehicle Availability
Education Level
Disability

Wage/Income Gap Comparison

Immigrants from Eastern Europe

Colville

Poor
Exceptional
26.4%
WAGE/INCOME GAP
19.2/ 100
METRIC RATING
203rd/ 347
METRIC RANK
21.3%
WAGE/INCOME GAP
100.0/ 100
METRIC RATING
39th/ 347
METRIC RANK

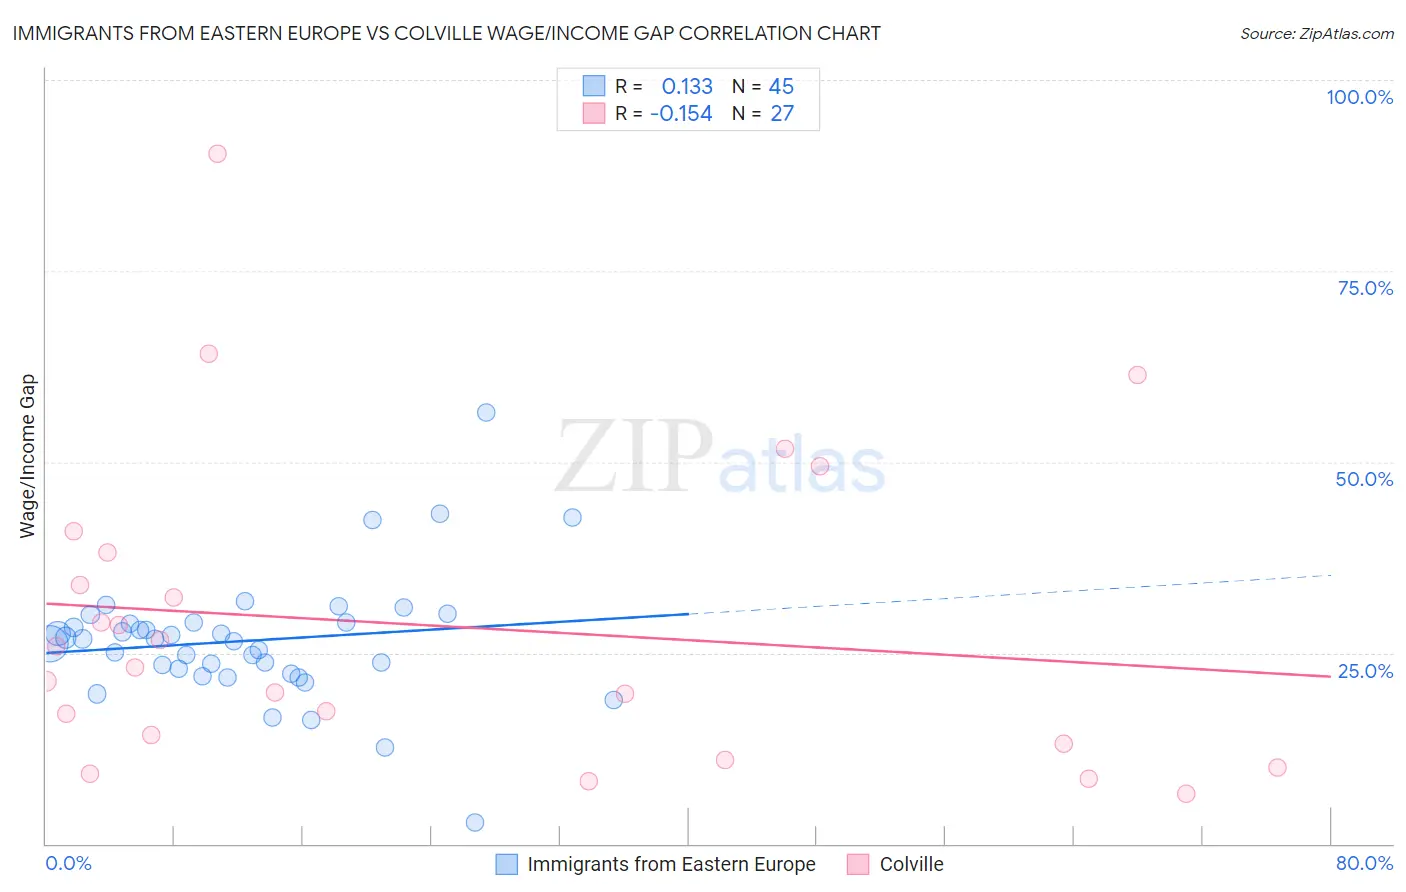
Immigrants from Eastern Europe vs Colville Wage/Income Gap Correlation Chart

The statistical analysis conducted on geographies consisting of 475,258,963 people shows a poor positive correlation between the proportion of Immigrants from Eastern Europe and wage/income gap percentage in the United States with a correlation coefficient (R) of 0.133 and weighted average of 26.4%. Similarly, the statistical analysis conducted on geographies consisting of 34,676,547 people shows a poor negative correlation between the proportion of Colville and wage/income gap percentage in the United States with a correlation coefficient (R) of -0.154 and weighted average of 21.3%, a difference of 23.9%.
Immigrants from Eastern Europe vs Colville Wage/Income Gap

Wage/Income Gap Correlation Summary

MeasurementImmigrants from Eastern EuropeColville
Minimum2.8%6.6%
Maximum56.5%90.4%
Range53.8%83.8%
Mean26.6%28.6%
Median26.8%23.1%
Interquartile 25% (IQ1)22.6%13.1%
Interquartile 75% (IQ3)28.9%38.1%
Interquartile Range (IQR)6.3%25.0%
Standard Deviation (Sample)8.4%20.3%
Standard Deviation (Population)8.3%19.9%

Similar Demographics by Wage/Income Gap

Demographics Similar to Immigrants from Eastern Europe by Wage/Income Gap

In terms of wage/income gap, the demographic groups most similar to Immigrants from Eastern Europe are Laotian (26.4%, a difference of 0.0%), Immigrants from Syria (26.4%, a difference of 0.010%), Immigrants from Russia (26.4%, a difference of 0.020%), Delaware (26.3%, a difference of 0.17%), and Dutch West Indian (26.3%, a difference of 0.18%).
DemographicsRating | RankWage/Income Gap
Immigrants | Western Asia
21.7
/100
|
#196
Fair
26.3%
Zimbabweans
21.6
/100
|
#197
Fair
26.3%
Venezuelans
21.5
/100
|
#198
Fair
26.3%
Dutch West Indians
21.0
/100
|
#199
Fair
26.3%
Delaware
20.9
/100
|
#200
Fair
26.3%
Immigrants | Syria
19.3
/100
|
#201
Poor
26.4%
Laotians
19.2
/100
|
#202
Poor
26.4%
Immigrants | Eastern Europe
19.2
/100
|
#203
Poor
26.4%
Immigrants | Russia
19.0
/100
|
#204
Poor
26.4%
Immigrants | Southern Europe
17.3
/100
|
#205
Poor
26.4%
Indians (Asian)
16.5
/100
|
#206
Poor
26.4%
Immigrants | Italy
15.8
/100
|
#207
Poor
26.5%
Egyptians
12.7
/100
|
#208
Poor
26.6%
Immigrants | Kuwait
12.6
/100
|
#209
Poor
26.6%
Arabs
12.3
/100
|
#210
Poor
26.6%

Demographics Similar to Colville by Wage/Income Gap

In terms of wage/income gap, the demographic groups most similar to Colville are Immigrants from Belize (21.3%, a difference of 0.11%), Immigrants from Somalia (21.2%, a difference of 0.16%), Lumbee (21.3%, a difference of 0.20%), Belizean (21.2%, a difference of 0.23%), and Somali (21.2%, a difference of 0.25%).
DemographicsRating | RankWage/Income Gap
Immigrants | Yemen
100.0
/100
|
#32
Exceptional
21.1%
Immigrants | Bahamas
100.0
/100
|
#33
Exceptional
21.1%
Pima
100.0
/100
|
#34
Exceptional
21.1%
Somalis
100.0
/100
|
#35
Exceptional
21.2%
Belizeans
100.0
/100
|
#36
Exceptional
21.2%
Immigrants | Somalia
100.0
/100
|
#37
Exceptional
21.2%
Immigrants | Belize
100.0
/100
|
#38
Exceptional
21.3%
Colville
100.0
/100
|
#39
Exceptional
21.3%
Lumbee
100.0
/100
|
#40
Exceptional
21.3%
Liberians
100.0
/100
|
#41
Exceptional
21.4%
Immigrants | Sierra Leone
100.0
/100
|
#42
Exceptional
21.4%
Sierra Leoneans
100.0
/100
|
#43
Exceptional
21.4%
Immigrants | Eritrea
100.0
/100
|
#44
Exceptional
21.4%
U.S. Virgin Islanders
100.0
/100
|
#45
Exceptional
21.5%
Immigrants | Ethiopia
100.0
/100
|
#46
Exceptional
21.6%