Immigrants from Africa vs Brazilian Wage/Income Gap
COMPARE
Immigrants from Africa
Brazilian
Wage/Income Gap
Wage/Income Gap Comparison
Immigrants from Africa
Brazilians
23.2%
WAGE/INCOME GAP
99.8/ 100
METRIC RATING
83rd/ 347
METRIC RANK
26.7%
WAGE/INCOME GAP
9.2/ 100
METRIC RATING
217th/ 347
METRIC RANK
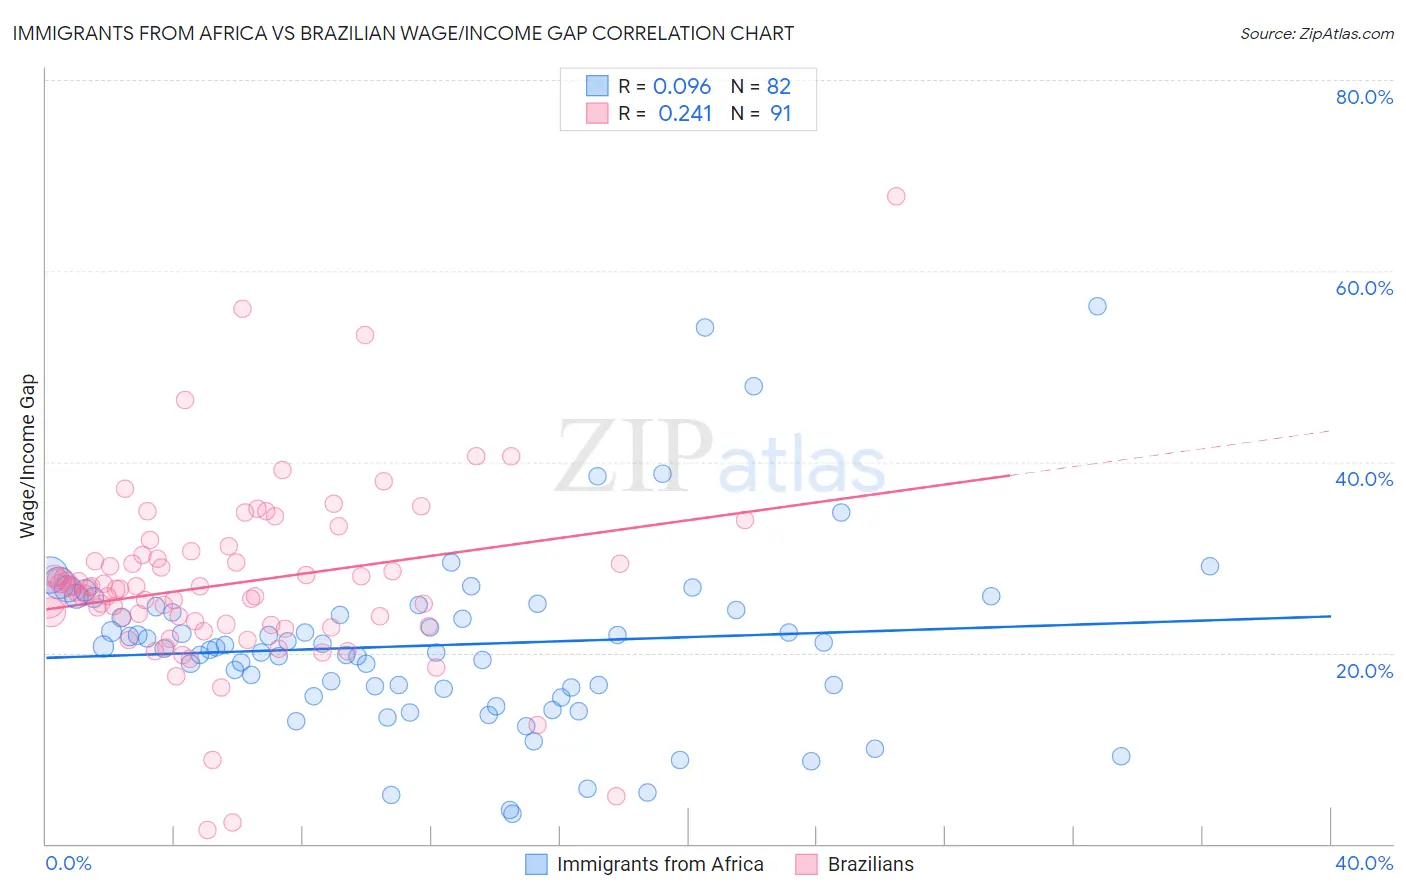
Immigrants from Africa vs Brazilian Wage/Income Gap Correlation Chart
The statistical analysis conducted on geographies consisting of 468,950,704 people shows a slight positive correlation between the proportion of Immigrants from Africa and wage/income gap percentage in the United States with a correlation coefficient (R) of 0.096 and weighted average of 23.2%. Similarly, the statistical analysis conducted on geographies consisting of 323,810,201 people shows a weak positive correlation between the proportion of Brazilians and wage/income gap percentage in the United States with a correlation coefficient (R) of 0.241 and weighted average of 26.7%, a difference of 15.3%.
Wage/Income Gap Correlation Summary
| Measurement | Immigrants from Africa | Brazilian |
| Minimum | 3.2% | 1.4% |
| Maximum | 56.4% | 67.8% |
| Range | 53.2% | 66.4% |
| Mean | 20.8% | 27.2% |
| Median | 20.5% | 26.7% |
| Interquartile 25% (IQ1) | 16.3% | 22.9% |
| Interquartile 75% (IQ3) | 24.5% | 29.9% |
| Interquartile Range (IQR) | 8.2% | 7.0% |
| Standard Deviation (Sample) | 9.4% | 9.5% |
| Standard Deviation (Population) | 9.3% | 9.5% |
Similar Demographics by Wage/Income Gap
Demographics Similar to Immigrants from Africa by Wage/Income Gap
In terms of wage/income gap, the demographic groups most similar to Immigrants from Africa are Bermudan (23.1%, a difference of 0.29%), Central American (23.1%, a difference of 0.29%), Cuban (23.3%, a difference of 0.37%), Immigrants from Cambodia (23.3%, a difference of 0.43%), and Cheyenne (23.3%, a difference of 0.63%).
| Demographics | Rating | Rank | Wage/Income Gap |
| Ecuadorians | 99.9 /100 | #76 | Exceptional 22.9% |
| Africans | 99.9 /100 | #77 | Exceptional 22.9% |
| Nigerians | 99.9 /100 | #78 | Exceptional 23.0% |
| Immigrants | Nicaragua | 99.9 /100 | #79 | Exceptional 23.0% |
| Salvadorans | 99.9 /100 | #80 | Exceptional 23.0% |
| Bermudans | 99.8 /100 | #81 | Exceptional 23.1% |
| Central Americans | 99.8 /100 | #82 | Exceptional 23.1% |
| Immigrants | Africa | 99.8 /100 | #83 | Exceptional 23.2% |
| Cubans | 99.7 /100 | #84 | Exceptional 23.3% |
| Immigrants | Cambodia | 99.7 /100 | #85 | Exceptional 23.3% |
| Cheyenne | 99.7 /100 | #86 | Exceptional 23.3% |
| Yuman | 99.7 /100 | #87 | Exceptional 23.3% |
| Immigrants | Panama | 99.6 /100 | #88 | Exceptional 23.4% |
| Marshallese | 99.6 /100 | #89 | Exceptional 23.4% |
| Nicaraguans | 99.6 /100 | #90 | Exceptional 23.4% |
Demographics Similar to Brazilians by Wage/Income Gap
In terms of wage/income gap, the demographic groups most similar to Brazilians are Immigrants from Saudi Arabia (26.7%, a difference of 0.030%), Immigrants from Portugal (26.7%, a difference of 0.050%), Immigrants from Poland (26.7%, a difference of 0.050%), Immigrants from Latvia (26.7%, a difference of 0.070%), and Yugoslavian (26.7%, a difference of 0.10%).
| Demographics | Rating | Rank | Wage/Income Gap |
| Arabs | 12.3 /100 | #210 | Poor 26.6% |
| Mongolians | 11.4 /100 | #211 | Poor 26.6% |
| Iraqis | 11.2 /100 | #212 | Poor 26.6% |
| Immigrants | Iraq | 10.3 /100 | #213 | Poor 26.7% |
| Immigrants | China | 10.3 /100 | #214 | Poor 26.7% |
| Yugoslavians | 9.7 /100 | #215 | Tragic 26.7% |
| Immigrants | Portugal | 9.5 /100 | #216 | Tragic 26.7% |
| Brazilians | 9.2 /100 | #217 | Tragic 26.7% |
| Immigrants | Saudi Arabia | 9.1 /100 | #218 | Tragic 26.7% |
| Immigrants | Poland | 8.9 /100 | #219 | Tragic 26.7% |
| Immigrants | Latvia | 8.9 /100 | #220 | Tragic 26.7% |
| Immigrants | Spain | 8.5 /100 | #221 | Tragic 26.8% |
| Bolivians | 8.3 /100 | #222 | Tragic 26.8% |
| Jordanians | 8.0 /100 | #223 | Tragic 26.8% |
| Immigrants | Argentina | 7.2 /100 | #224 | Tragic 26.8% |