Immigrants from Africa vs Argentinean Wage/Income Gap
COMPARE
Immigrants from Africa
Argentinean
Wage/Income Gap
Wage/Income Gap Comparison
Immigrants from Africa
Argentineans
23.2%
WAGE/INCOME GAP
99.8/ 100
METRIC RATING
83rd/ 347
METRIC RANK
27.0%
WAGE/INCOME GAP
5.2/ 100
METRIC RATING
232nd/ 347
METRIC RANK
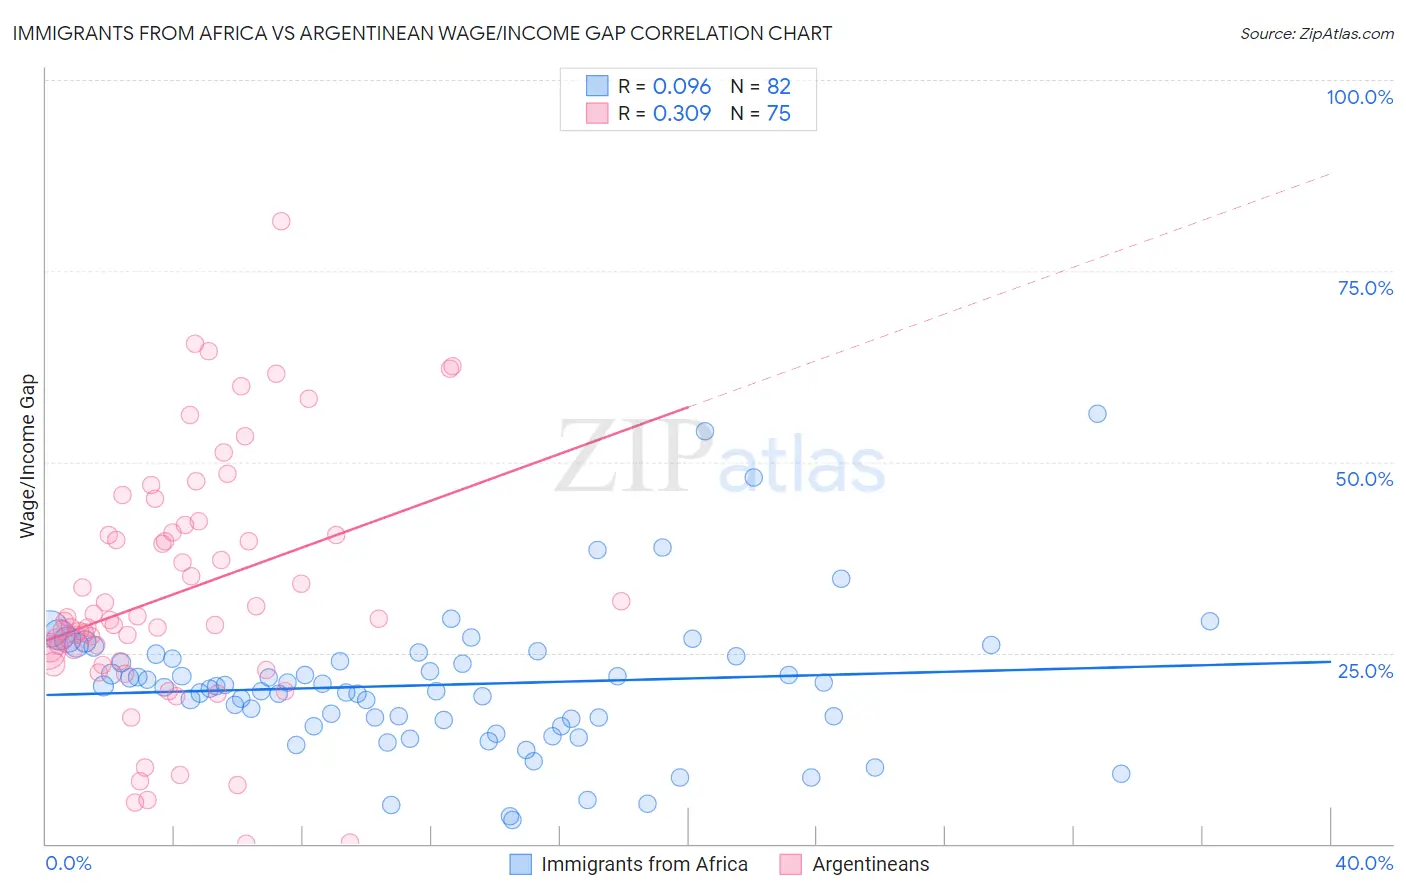
Immigrants from Africa vs Argentinean Wage/Income Gap Correlation Chart
The statistical analysis conducted on geographies consisting of 468,950,704 people shows a slight positive correlation between the proportion of Immigrants from Africa and wage/income gap percentage in the United States with a correlation coefficient (R) of 0.096 and weighted average of 23.2%. Similarly, the statistical analysis conducted on geographies consisting of 297,053,015 people shows a mild positive correlation between the proportion of Argentineans and wage/income gap percentage in the United States with a correlation coefficient (R) of 0.309 and weighted average of 27.0%, a difference of 16.5%.
Wage/Income Gap Correlation Summary
| Measurement | Immigrants from Africa | Argentinean |
| Minimum | 3.2% | 0.074% |
| Maximum | 56.4% | 81.5% |
| Range | 53.2% | 81.4% |
| Mean | 20.8% | 32.9% |
| Median | 20.5% | 29.2% |
| Interquartile 25% (IQ1) | 16.3% | 24.0% |
| Interquartile 75% (IQ3) | 24.5% | 40.7% |
| Interquartile Range (IQR) | 8.2% | 16.8% |
| Standard Deviation (Sample) | 9.4% | 16.2% |
| Standard Deviation (Population) | 9.3% | 16.1% |
Similar Demographics by Wage/Income Gap
Demographics Similar to Immigrants from Africa by Wage/Income Gap
In terms of wage/income gap, the demographic groups most similar to Immigrants from Africa are Bermudan (23.1%, a difference of 0.29%), Central American (23.1%, a difference of 0.29%), Cuban (23.3%, a difference of 0.37%), Immigrants from Cambodia (23.3%, a difference of 0.43%), and Cheyenne (23.3%, a difference of 0.63%).
| Demographics | Rating | Rank | Wage/Income Gap |
| Ecuadorians | 99.9 /100 | #76 | Exceptional 22.9% |
| Africans | 99.9 /100 | #77 | Exceptional 22.9% |
| Nigerians | 99.9 /100 | #78 | Exceptional 23.0% |
| Immigrants | Nicaragua | 99.9 /100 | #79 | Exceptional 23.0% |
| Salvadorans | 99.9 /100 | #80 | Exceptional 23.0% |
| Bermudans | 99.8 /100 | #81 | Exceptional 23.1% |
| Central Americans | 99.8 /100 | #82 | Exceptional 23.1% |
| Immigrants | Africa | 99.8 /100 | #83 | Exceptional 23.2% |
| Cubans | 99.7 /100 | #84 | Exceptional 23.3% |
| Immigrants | Cambodia | 99.7 /100 | #85 | Exceptional 23.3% |
| Cheyenne | 99.7 /100 | #86 | Exceptional 23.3% |
| Yuman | 99.7 /100 | #87 | Exceptional 23.3% |
| Immigrants | Panama | 99.6 /100 | #88 | Exceptional 23.4% |
| Marshallese | 99.6 /100 | #89 | Exceptional 23.4% |
| Nicaraguans | 99.6 /100 | #90 | Exceptional 23.4% |
Demographics Similar to Argentineans by Wage/Income Gap
In terms of wage/income gap, the demographic groups most similar to Argentineans are Bhutanese (27.0%, a difference of 0.020%), Ottawa (27.0%, a difference of 0.050%), Immigrants from Brazil (27.0%, a difference of 0.060%), Immigrants from Asia (27.0%, a difference of 0.10%), and Immigrants from Pakistan (27.0%, a difference of 0.11%).
| Demographics | Rating | Rank | Wage/Income Gap |
| Immigrants | Ireland | 6.5 /100 | #225 | Tragic 26.9% |
| Asians | 5.9 /100 | #226 | Tragic 26.9% |
| Spaniards | 5.6 /100 | #227 | Tragic 27.0% |
| Immigrants | Turkey | 5.6 /100 | #228 | Tragic 27.0% |
| Immigrants | Asia | 5.5 /100 | #229 | Tragic 27.0% |
| Ottawa | 5.3 /100 | #230 | Tragic 27.0% |
| Bhutanese | 5.3 /100 | #231 | Tragic 27.0% |
| Argentineans | 5.2 /100 | #232 | Tragic 27.0% |
| Immigrants | Brazil | 5.0 /100 | #233 | Tragic 27.0% |
| Immigrants | Pakistan | 4.9 /100 | #234 | Tragic 27.0% |
| Immigrants | Hungary | 4.8 /100 | #235 | Tragic 27.0% |
| Immigrants | Romania | 4.8 /100 | #236 | Tragic 27.0% |
| Immigrants | Eastern Asia | 4.4 /100 | #237 | Tragic 27.1% |
| Osage | 4.4 /100 | #238 | Tragic 27.1% |
| Estonians | 4.3 /100 | #239 | Tragic 27.1% |