Immigrants from Africa vs Ukrainian Wage/Income Gap
COMPARE
Immigrants from Africa
Ukrainian
Wage/Income Gap
Wage/Income Gap Comparison
Immigrants from Africa
Ukrainians
23.2%
WAGE/INCOME GAP
99.8/ 100
METRIC RATING
83rd/ 347
METRIC RANK
27.3%
WAGE/INCOME GAP
2.4/ 100
METRIC RATING
252nd/ 347
METRIC RANK
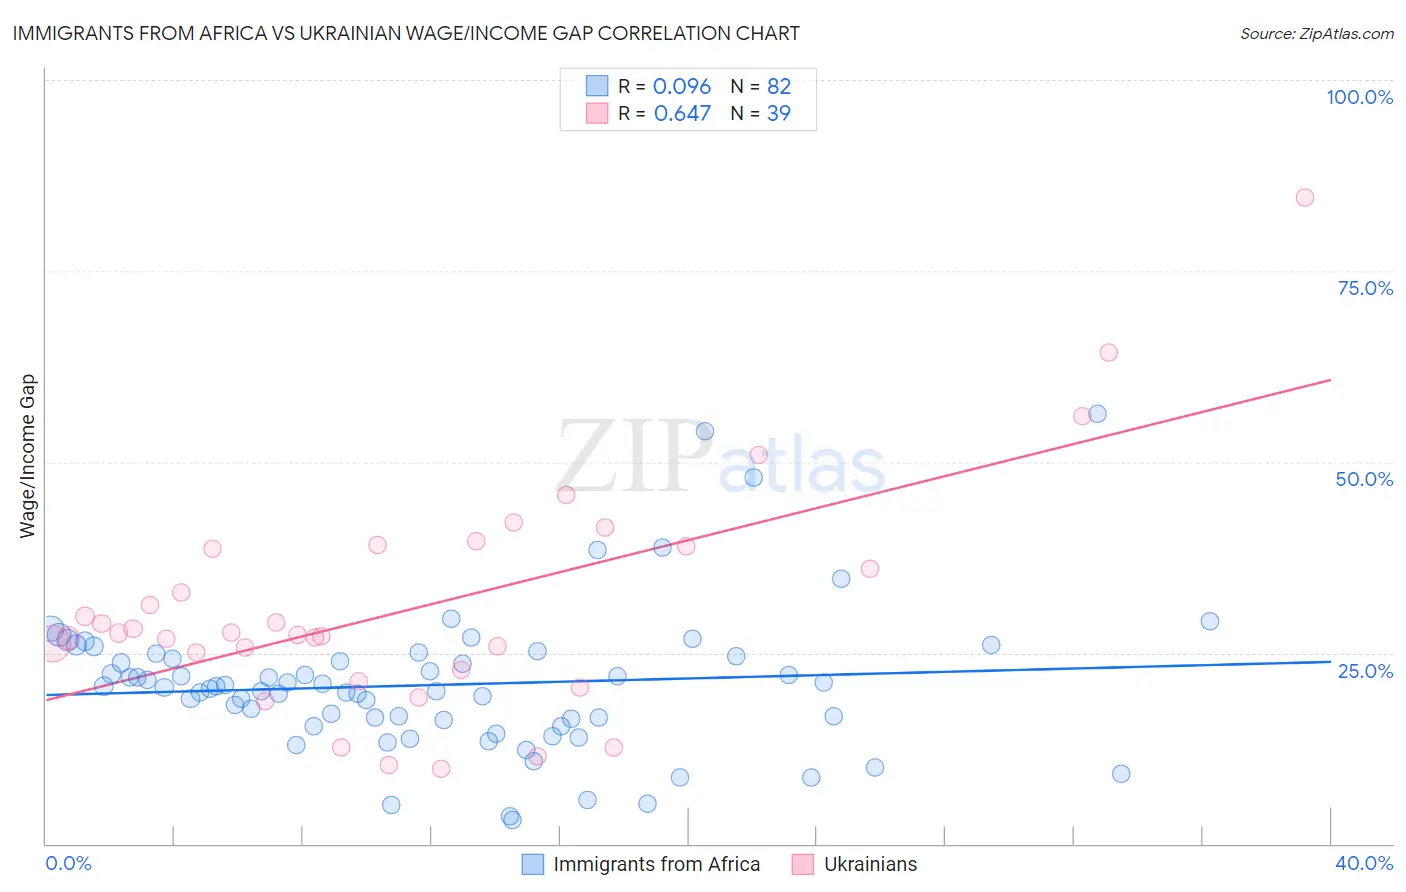
Immigrants from Africa vs Ukrainian Wage/Income Gap Correlation Chart
The statistical analysis conducted on geographies consisting of 468,950,704 people shows a slight positive correlation between the proportion of Immigrants from Africa and wage/income gap percentage in the United States with a correlation coefficient (R) of 0.096 and weighted average of 23.2%. Similarly, the statistical analysis conducted on geographies consisting of 448,085,539 people shows a significant positive correlation between the proportion of Ukrainians and wage/income gap percentage in the United States with a correlation coefficient (R) of 0.647 and weighted average of 27.3%, a difference of 17.9%.
Wage/Income Gap Correlation Summary
| Measurement | Immigrants from Africa | Ukrainian |
| Minimum | 3.2% | 9.8% |
| Maximum | 56.4% | 84.6% |
| Range | 53.2% | 74.9% |
| Mean | 20.8% | 31.0% |
| Median | 20.5% | 27.6% |
| Interquartile 25% (IQ1) | 16.3% | 22.7% |
| Interquartile 75% (IQ3) | 24.5% | 39.0% |
| Interquartile Range (IQR) | 8.2% | 16.3% |
| Standard Deviation (Sample) | 9.4% | 14.9% |
| Standard Deviation (Population) | 9.3% | 14.7% |
Similar Demographics by Wage/Income Gap
Demographics Similar to Immigrants from Africa by Wage/Income Gap
In terms of wage/income gap, the demographic groups most similar to Immigrants from Africa are Bermudan (23.1%, a difference of 0.29%), Central American (23.1%, a difference of 0.29%), Cuban (23.3%, a difference of 0.37%), Immigrants from Cambodia (23.3%, a difference of 0.43%), and Cheyenne (23.3%, a difference of 0.63%).
| Demographics | Rating | Rank | Wage/Income Gap |
| Ecuadorians | 99.9 /100 | #76 | Exceptional 22.9% |
| Africans | 99.9 /100 | #77 | Exceptional 22.9% |
| Nigerians | 99.9 /100 | #78 | Exceptional 23.0% |
| Immigrants | Nicaragua | 99.9 /100 | #79 | Exceptional 23.0% |
| Salvadorans | 99.9 /100 | #80 | Exceptional 23.0% |
| Bermudans | 99.8 /100 | #81 | Exceptional 23.1% |
| Central Americans | 99.8 /100 | #82 | Exceptional 23.1% |
| Immigrants | Africa | 99.8 /100 | #83 | Exceptional 23.2% |
| Cubans | 99.7 /100 | #84 | Exceptional 23.3% |
| Immigrants | Cambodia | 99.7 /100 | #85 | Exceptional 23.3% |
| Cheyenne | 99.7 /100 | #86 | Exceptional 23.3% |
| Yuman | 99.7 /100 | #87 | Exceptional 23.3% |
| Immigrants | Panama | 99.6 /100 | #88 | Exceptional 23.4% |
| Marshallese | 99.6 /100 | #89 | Exceptional 23.4% |
| Nicaraguans | 99.6 /100 | #90 | Exceptional 23.4% |
Demographics Similar to Ukrainians by Wage/Income Gap
In terms of wage/income gap, the demographic groups most similar to Ukrainians are Immigrants from Norway (27.3%, a difference of 0.060%), Immigrants from Czechoslovakia (27.3%, a difference of 0.16%), Portuguese (27.4%, a difference of 0.16%), Carpatho Rusyn (27.3%, a difference of 0.18%), and Cypriot (27.3%, a difference of 0.19%).
| Demographics | Rating | Rank | Wage/Income Gap |
| Immigrants | Azores | 3.5 /100 | #245 | Tragic 27.2% |
| Immigrants | Nonimmigrants | 3.3 /100 | #246 | Tragic 27.2% |
| Celtics | 2.8 /100 | #247 | Tragic 27.3% |
| Cypriots | 2.8 /100 | #248 | Tragic 27.3% |
| Carpatho Rusyns | 2.7 /100 | #249 | Tragic 27.3% |
| Immigrants | Czechoslovakia | 2.7 /100 | #250 | Tragic 27.3% |
| Immigrants | Norway | 2.5 /100 | #251 | Tragic 27.3% |
| Ukrainians | 2.4 /100 | #252 | Tragic 27.3% |
| Portuguese | 2.2 /100 | #253 | Tragic 27.4% |
| Israelis | 2.1 /100 | #254 | Tragic 27.4% |
| Immigrants | France | 2.1 /100 | #255 | Tragic 27.4% |
| Cherokee | 1.9 /100 | #256 | Tragic 27.4% |
| Luxembourgers | 1.9 /100 | #257 | Tragic 27.4% |
| Slavs | 1.8 /100 | #258 | Tragic 27.4% |
| Icelanders | 1.8 /100 | #259 | Tragic 27.5% |