Hawaiian vs Israeli Wage/Income Gap
COMPARE
Hawaiian
Israeli
Wage/Income Gap
Wage/Income Gap Comparison
Hawaiians
Israelis
24.9%
WAGE/INCOME GAP
89.3/ 100
METRIC RATING
141st/ 347
METRIC RANK
27.4%
WAGE/INCOME GAP
2.1/ 100
METRIC RATING
254th/ 347
METRIC RANK
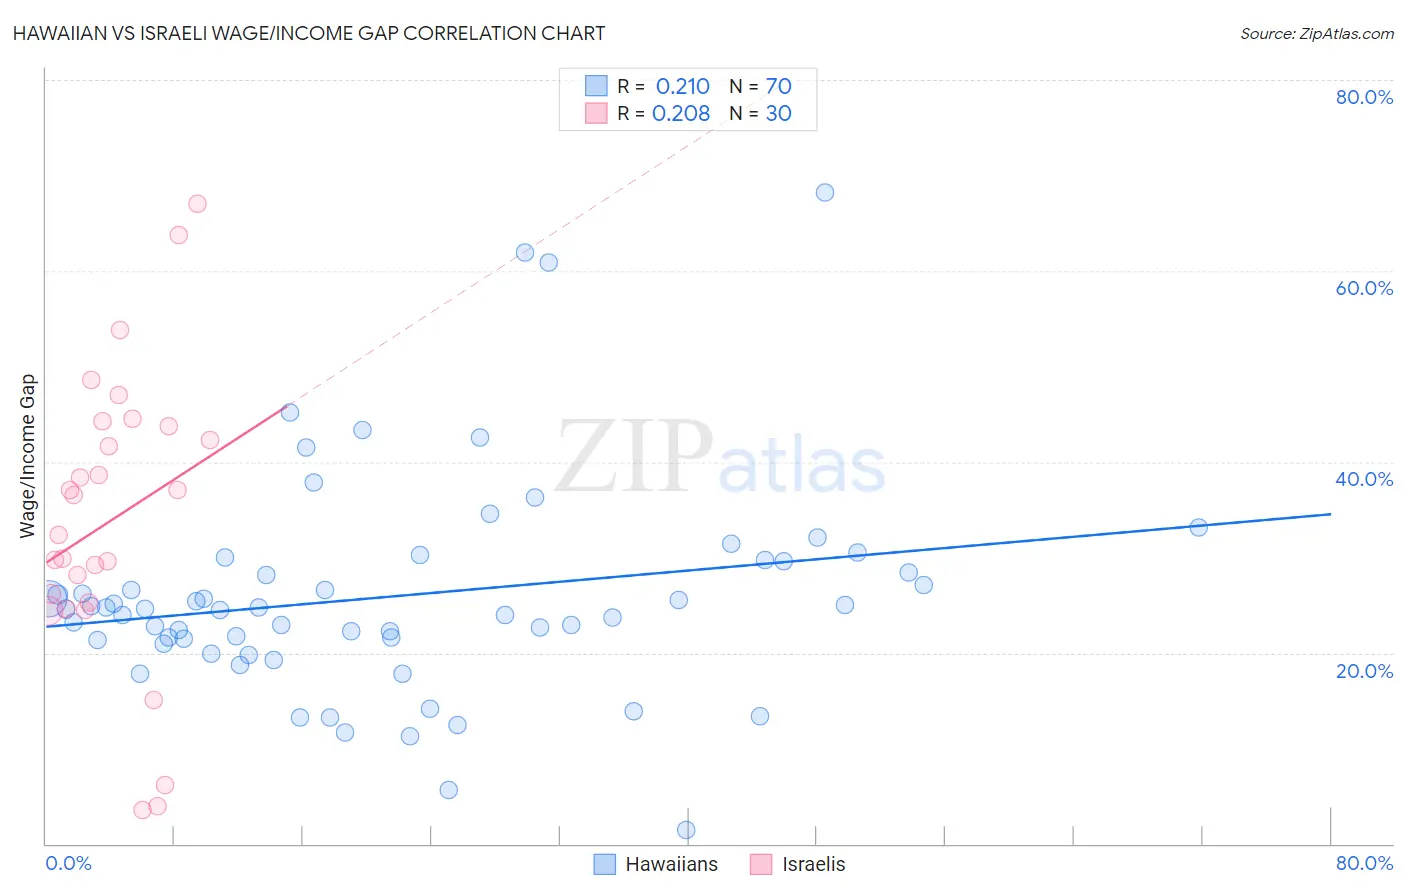
Hawaiian vs Israeli Wage/Income Gap Correlation Chart
The statistical analysis conducted on geographies consisting of 327,384,516 people shows a weak positive correlation between the proportion of Hawaiians and wage/income gap percentage in the United States with a correlation coefficient (R) of 0.210 and weighted average of 24.9%. Similarly, the statistical analysis conducted on geographies consisting of 211,160,371 people shows a weak positive correlation between the proportion of Israelis and wage/income gap percentage in the United States with a correlation coefficient (R) of 0.208 and weighted average of 27.4%, a difference of 10.1%.
Wage/Income Gap Correlation Summary
| Measurement | Hawaiian | Israeli |
| Minimum | 1.4% | 3.5% |
| Maximum | 68.2% | 67.0% |
| Range | 66.8% | 63.5% |
| Mean | 25.9% | 33.9% |
| Median | 24.6% | 34.4% |
| Interquartile 25% (IQ1) | 21.4% | 25.3% |
| Interquartile 75% (IQ3) | 29.6% | 43.8% |
| Interquartile Range (IQR) | 8.2% | 18.5% |
| Standard Deviation (Sample) | 11.4% | 15.2% |
| Standard Deviation (Population) | 11.3% | 15.0% |
Similar Demographics by Wage/Income Gap
Demographics Similar to Hawaiians by Wage/Income Gap
In terms of wage/income gap, the demographic groups most similar to Hawaiians are Immigrants from Nepal (24.9%, a difference of 0.010%), Hispanic or Latino (24.9%, a difference of 0.040%), Immigrants from Bosnia and Herzegovina (24.8%, a difference of 0.15%), Afghan (24.9%, a difference of 0.20%), and Immigrants from Uganda (24.9%, a difference of 0.22%).
| Demographics | Rating | Rank | Wage/Income Gap |
| Mexican American Indians | 92.2 /100 | #134 | Exceptional 24.7% |
| South American Indians | 92.0 /100 | #135 | Exceptional 24.7% |
| Armenians | 91.3 /100 | #136 | Exceptional 24.8% |
| Immigrants | South Eastern Asia | 90.9 /100 | #137 | Exceptional 24.8% |
| Immigrants | Bosnia and Herzegovina | 90.1 /100 | #138 | Exceptional 24.8% |
| Hispanics or Latinos | 89.5 /100 | #139 | Excellent 24.9% |
| Immigrants | Nepal | 89.3 /100 | #140 | Excellent 24.9% |
| Hawaiians | 89.3 /100 | #141 | Excellent 24.9% |
| Afghans | 88.1 /100 | #142 | Excellent 24.9% |
| Immigrants | Uganda | 88.0 /100 | #143 | Excellent 24.9% |
| Chippewa | 86.9 /100 | #144 | Excellent 25.0% |
| Comanche | 85.2 /100 | #145 | Excellent 25.0% |
| South Americans | 85.2 /100 | #146 | Excellent 25.0% |
| Malaysians | 84.9 /100 | #147 | Excellent 25.0% |
| Iroquois | 83.9 /100 | #148 | Excellent 25.1% |
Demographics Similar to Israelis by Wage/Income Gap
In terms of wage/income gap, the demographic groups most similar to Israelis are Immigrants from France (27.4%, a difference of 0.010%), Portuguese (27.4%, a difference of 0.080%), Cherokee (27.4%, a difference of 0.11%), Luxembourger (27.4%, a difference of 0.16%), and Slavic (27.4%, a difference of 0.20%).
| Demographics | Rating | Rank | Wage/Income Gap |
| Celtics | 2.8 /100 | #247 | Tragic 27.3% |
| Cypriots | 2.8 /100 | #248 | Tragic 27.3% |
| Carpatho Rusyns | 2.7 /100 | #249 | Tragic 27.3% |
| Immigrants | Czechoslovakia | 2.7 /100 | #250 | Tragic 27.3% |
| Immigrants | Norway | 2.5 /100 | #251 | Tragic 27.3% |
| Ukrainians | 2.4 /100 | #252 | Tragic 27.3% |
| Portuguese | 2.2 /100 | #253 | Tragic 27.4% |
| Israelis | 2.1 /100 | #254 | Tragic 27.4% |
| Immigrants | France | 2.1 /100 | #255 | Tragic 27.4% |
| Cherokee | 1.9 /100 | #256 | Tragic 27.4% |
| Luxembourgers | 1.9 /100 | #257 | Tragic 27.4% |
| Slavs | 1.8 /100 | #258 | Tragic 27.4% |
| Icelanders | 1.8 /100 | #259 | Tragic 27.5% |
| Tongans | 1.7 /100 | #260 | Tragic 27.5% |
| Immigrants | Germany | 1.5 /100 | #261 | Tragic 27.5% |