Guatemalan vs Immigrants from Kazakhstan Wage/Income Gap
COMPARE
Guatemalan
Immigrants from Kazakhstan
Wage/Income Gap
Wage/Income Gap Comparison
Guatemalans
Immigrants from Kazakhstan
22.6%
WAGE/INCOME GAP
99.9/ 100
METRIC RATING
65th/ 347
METRIC RANK
26.0%
WAGE/INCOME GAP
35.2/ 100
METRIC RATING
183rd/ 347
METRIC RANK
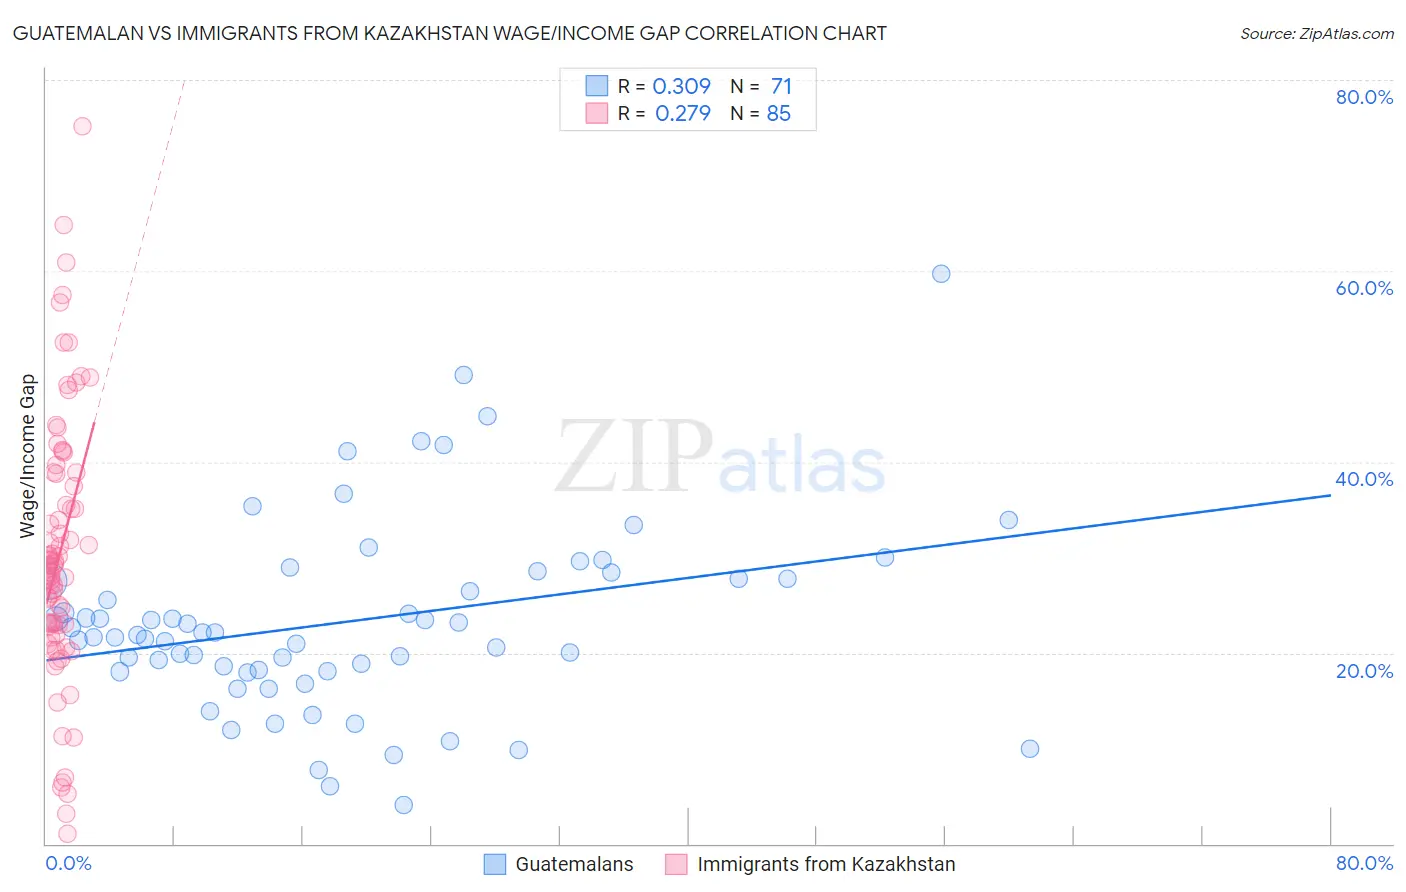
Guatemalan vs Immigrants from Kazakhstan Wage/Income Gap Correlation Chart
The statistical analysis conducted on geographies consisting of 409,292,341 people shows a mild positive correlation between the proportion of Guatemalans and wage/income gap percentage in the United States with a correlation coefficient (R) of 0.309 and weighted average of 22.6%. Similarly, the statistical analysis conducted on geographies consisting of 124,424,213 people shows a weak positive correlation between the proportion of Immigrants from Kazakhstan and wage/income gap percentage in the United States with a correlation coefficient (R) of 0.279 and weighted average of 26.0%, a difference of 15.0%.
Wage/Income Gap Correlation Summary
| Measurement | Guatemalan | Immigrants from Kazakhstan |
| Minimum | 4.1% | 1.1% |
| Maximum | 59.7% | 75.1% |
| Range | 55.6% | 74.1% |
| Mean | 23.3% | 30.4% |
| Median | 21.9% | 29.1% |
| Interquartile 25% (IQ1) | 18.1% | 22.9% |
| Interquartile 75% (IQ3) | 27.8% | 38.8% |
| Interquartile Range (IQR) | 9.7% | 15.9% |
| Standard Deviation (Sample) | 10.0% | 13.9% |
| Standard Deviation (Population) | 9.9% | 13.8% |
Similar Demographics by Wage/Income Gap
Demographics Similar to Guatemalans by Wage/Income Gap
In terms of wage/income gap, the demographic groups most similar to Guatemalans are Central American Indian (22.7%, a difference of 0.24%), Spanish American Indian (22.5%, a difference of 0.32%), Menominee (22.7%, a difference of 0.41%), Immigrants from Nigeria (22.7%, a difference of 0.42%), and Indonesian (22.7%, a difference of 0.45%).
| Demographics | Rating | Rank | Wage/Income Gap |
| Immigrants | Cuba | 100.0 /100 | #58 | Exceptional 22.4% |
| Navajo | 100.0 /100 | #59 | Exceptional 22.4% |
| Immigrants | Middle Africa | 100.0 /100 | #60 | Exceptional 22.4% |
| Immigrants | Fiji | 100.0 /100 | #61 | Exceptional 22.4% |
| Immigrants | Guatemala | 100.0 /100 | #62 | Exceptional 22.5% |
| Immigrants | Ecuador | 100.0 /100 | #63 | Exceptional 22.5% |
| Spanish American Indians | 100.0 /100 | #64 | Exceptional 22.5% |
| Guatemalans | 99.9 /100 | #65 | Exceptional 22.6% |
| Central American Indians | 99.9 /100 | #66 | Exceptional 22.7% |
| Menominee | 99.9 /100 | #67 | Exceptional 22.7% |
| Immigrants | Nigeria | 99.9 /100 | #68 | Exceptional 22.7% |
| Indonesians | 99.9 /100 | #69 | Exceptional 22.7% |
| Immigrants | Uzbekistan | 99.9 /100 | #70 | Exceptional 22.7% |
| Immigrants | El Salvador | 99.9 /100 | #71 | Exceptional 22.8% |
| Sub-Saharan Africans | 99.9 /100 | #72 | Exceptional 22.8% |
Demographics Similar to Immigrants from Kazakhstan by Wage/Income Gap
In terms of wage/income gap, the demographic groups most similar to Immigrants from Kazakhstan are Immigrants from Serbia (26.0%, a difference of 0.010%), Mexican (26.0%, a difference of 0.060%), Immigrants from Bolivia (26.0%, a difference of 0.090%), Pakistani (26.1%, a difference of 0.11%), and Immigrants from Indonesia (26.1%, a difference of 0.19%).
| Demographics | Rating | Rank | Wage/Income Gap |
| Paraguayans | 46.7 /100 | #176 | Average 25.8% |
| Cambodians | 45.1 /100 | #177 | Average 25.8% |
| Chinese | 42.0 /100 | #178 | Average 25.9% |
| Samoans | 38.6 /100 | #179 | Fair 26.0% |
| Guamanians/Chamorros | 38.0 /100 | #180 | Fair 26.0% |
| Immigrants | Bolivia | 36.4 /100 | #181 | Fair 26.0% |
| Immigrants | Serbia | 35.4 /100 | #182 | Fair 26.0% |
| Immigrants | Kazakhstan | 35.2 /100 | #183 | Fair 26.0% |
| Mexicans | 34.4 /100 | #184 | Fair 26.0% |
| Pakistanis | 33.7 /100 | #185 | Fair 26.1% |
| Immigrants | Indonesia | 32.5 /100 | #186 | Fair 26.1% |
| Palestinians | 29.9 /100 | #187 | Fair 26.1% |
| Immigrants | Egypt | 29.9 /100 | #188 | Fair 26.1% |
| Immigrants | Moldova | 26.6 /100 | #189 | Fair 26.2% |
| Immigrants | Croatia | 24.8 /100 | #190 | Fair 26.2% |