Guatemalan vs Immigrants from China Wage/Income Gap
COMPARE
Guatemalan
Immigrants from China
Wage/Income Gap
Wage/Income Gap Comparison
Guatemalans
Immigrants from China
22.6%
WAGE/INCOME GAP
99.9/ 100
METRIC RATING
65th/ 347
METRIC RANK
26.7%
WAGE/INCOME GAP
10.3/ 100
METRIC RATING
214th/ 347
METRIC RANK
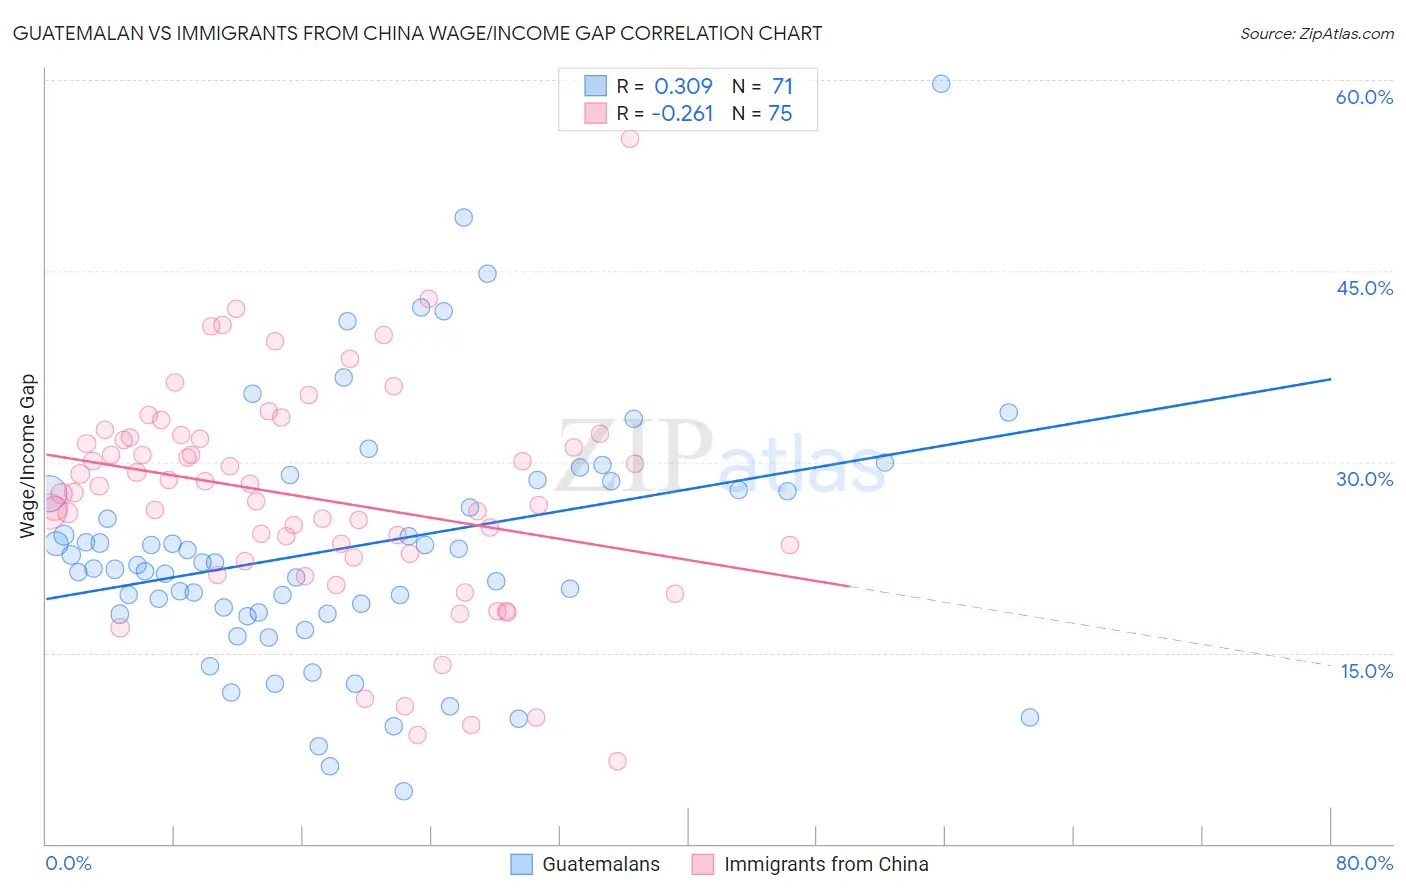
Guatemalan vs Immigrants from China Wage/Income Gap Correlation Chart
The statistical analysis conducted on geographies consisting of 409,292,341 people shows a mild positive correlation between the proportion of Guatemalans and wage/income gap percentage in the United States with a correlation coefficient (R) of 0.309 and weighted average of 22.6%. Similarly, the statistical analysis conducted on geographies consisting of 456,702,733 people shows a weak negative correlation between the proportion of Immigrants from China and wage/income gap percentage in the United States with a correlation coefficient (R) of -0.261 and weighted average of 26.7%, a difference of 17.9%.
Wage/Income Gap Correlation Summary
| Measurement | Guatemalan | Immigrants from China |
| Minimum | 4.1% | 6.5% |
| Maximum | 59.7% | 55.3% |
| Range | 55.6% | 48.9% |
| Mean | 23.3% | 27.2% |
| Median | 21.9% | 27.6% |
| Interquartile 25% (IQ1) | 18.1% | 22.4% |
| Interquartile 75% (IQ3) | 27.8% | 31.9% |
| Interquartile Range (IQR) | 9.7% | 9.5% |
| Standard Deviation (Sample) | 10.0% | 8.7% |
| Standard Deviation (Population) | 9.9% | 8.6% |
Similar Demographics by Wage/Income Gap
Demographics Similar to Guatemalans by Wage/Income Gap
In terms of wage/income gap, the demographic groups most similar to Guatemalans are Central American Indian (22.7%, a difference of 0.24%), Spanish American Indian (22.5%, a difference of 0.32%), Menominee (22.7%, a difference of 0.41%), Immigrants from Nigeria (22.7%, a difference of 0.42%), and Indonesian (22.7%, a difference of 0.45%).
| Demographics | Rating | Rank | Wage/Income Gap |
| Immigrants | Cuba | 100.0 /100 | #58 | Exceptional 22.4% |
| Navajo | 100.0 /100 | #59 | Exceptional 22.4% |
| Immigrants | Middle Africa | 100.0 /100 | #60 | Exceptional 22.4% |
| Immigrants | Fiji | 100.0 /100 | #61 | Exceptional 22.4% |
| Immigrants | Guatemala | 100.0 /100 | #62 | Exceptional 22.5% |
| Immigrants | Ecuador | 100.0 /100 | #63 | Exceptional 22.5% |
| Spanish American Indians | 100.0 /100 | #64 | Exceptional 22.5% |
| Guatemalans | 99.9 /100 | #65 | Exceptional 22.6% |
| Central American Indians | 99.9 /100 | #66 | Exceptional 22.7% |
| Menominee | 99.9 /100 | #67 | Exceptional 22.7% |
| Immigrants | Nigeria | 99.9 /100 | #68 | Exceptional 22.7% |
| Indonesians | 99.9 /100 | #69 | Exceptional 22.7% |
| Immigrants | Uzbekistan | 99.9 /100 | #70 | Exceptional 22.7% |
| Immigrants | El Salvador | 99.9 /100 | #71 | Exceptional 22.8% |
| Sub-Saharan Africans | 99.9 /100 | #72 | Exceptional 22.8% |
Demographics Similar to Immigrants from China by Wage/Income Gap
In terms of wage/income gap, the demographic groups most similar to Immigrants from China are Immigrants from Iraq (26.7%, a difference of 0.010%), Yugoslavian (26.7%, a difference of 0.090%), Immigrants from Portugal (26.7%, a difference of 0.13%), Iraqi (26.6%, a difference of 0.16%), and Mongolian (26.6%, a difference of 0.19%).
| Demographics | Rating | Rank | Wage/Income Gap |
| Immigrants | Italy | 15.8 /100 | #207 | Poor 26.5% |
| Egyptians | 12.7 /100 | #208 | Poor 26.6% |
| Immigrants | Kuwait | 12.6 /100 | #209 | Poor 26.6% |
| Arabs | 12.3 /100 | #210 | Poor 26.6% |
| Mongolians | 11.4 /100 | #211 | Poor 26.6% |
| Iraqis | 11.2 /100 | #212 | Poor 26.6% |
| Immigrants | Iraq | 10.3 /100 | #213 | Poor 26.7% |
| Immigrants | China | 10.3 /100 | #214 | Poor 26.7% |
| Yugoslavians | 9.7 /100 | #215 | Tragic 26.7% |
| Immigrants | Portugal | 9.5 /100 | #216 | Tragic 26.7% |
| Brazilians | 9.2 /100 | #217 | Tragic 26.7% |
| Immigrants | Saudi Arabia | 9.1 /100 | #218 | Tragic 26.7% |
| Immigrants | Poland | 8.9 /100 | #219 | Tragic 26.7% |
| Immigrants | Latvia | 8.9 /100 | #220 | Tragic 26.7% |
| Immigrants | Spain | 8.5 /100 | #221 | Tragic 26.8% |