Butte City, ID Map & Demographics
Butte City Map
Butte City Overview
$22,578
PER CAPITA INCOME
$14,653
AVG HOUSEHOLD INCOME
32.5%
WAGE / INCOME GAP [ % ]
67.5¢/ $1
WAGE / INCOME GAP [ $ ]
0.42
INEQUALITY / GINI INDEX
72
TOTAL POPULATION
37
MALE POPULATION
35
FEMALE POPULATION
105.71
MALES / 100 FEMALES
94.59
FEMALES / 100 MALES
72.1
MEDIAN AGE
4.5
AVG FAMILY SIZE
1.3
AVG HOUSEHOLD SIZE
30
LABOR FORCE [ PEOPLE ]
44.1%
PERCENT IN LABOR FORCE
10.0%
UNEMPLOYMENT RATE
Butte City Area Codes
Income in Butte City
Income Overview in Butte City
| Characteristic | Number | Measure |
| Per Capita Income | 72 | $22,578 |
| Median Family Income | 2 | $0 |
| Mean Family Income | 2 | $0 |
| Median Household Income | 55 | $14,653 |
| Mean Household Income | 55 | $26,325 |
| Income Deficit | 2 | $0 |
| Wage / Income Gap (%) | 72 | 32.49% |
| Wage / Income Gap ($) | 72 | 67.51¢ per $1 |
| Gini / Inequality Index | 72 | 0.42 |
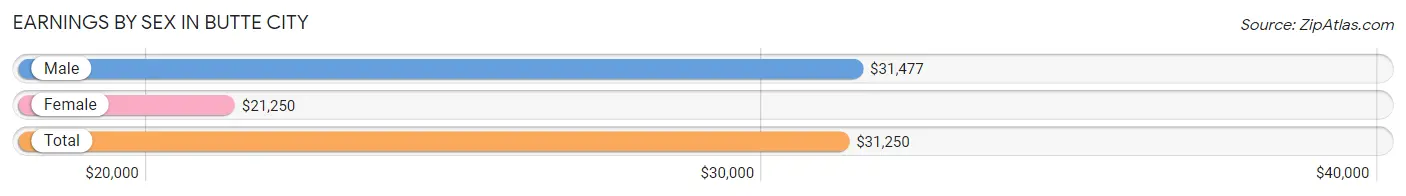
Earnings by Sex in Butte City
Average Earnings in Butte City are $31,250, $31,477 for men and $21,250 for women, a difference of 32.5%.
| Sex | Number | Average Earnings |
| Male | 17 (63.0%) | $31,477 |
| Female | 10 (37.0%) | $21,250 |
| Total | 27 (100.0%) | $31,250 |
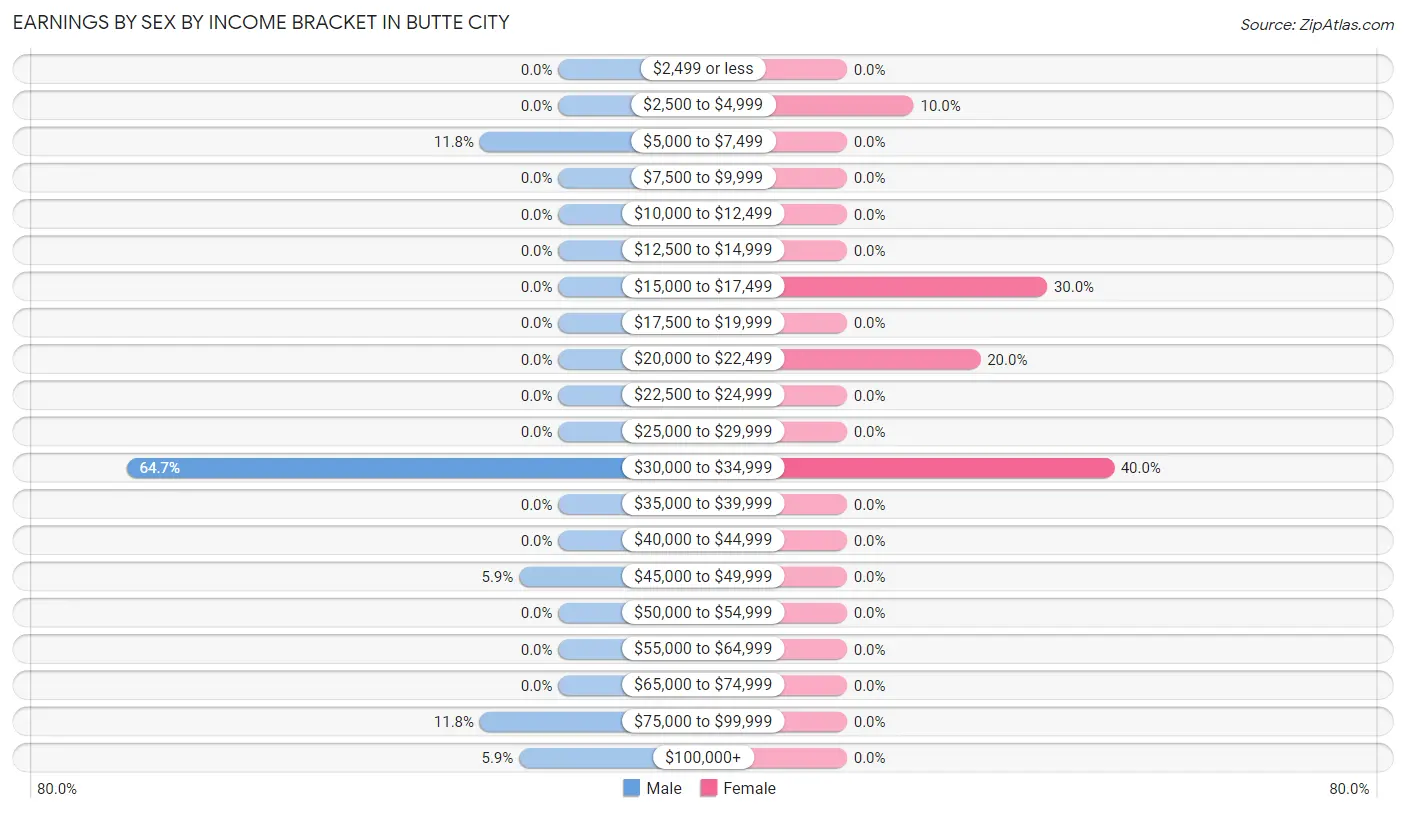
Earnings by Sex by Income Bracket in Butte City
The most common earnings brackets in Butte City are $30,000 to $34,999 for men (11 | 64.7%) and $30,000 to $34,999 for women (4 | 40.0%).
| Income | Male | Female |
| $2,499 or less | 0 (0.0%) | 0 (0.0%) |
| $2,500 to $4,999 | 0 (0.0%) | 1 (10.0%) |
| $5,000 to $7,499 | 2 (11.8%) | 0 (0.0%) |
| $7,500 to $9,999 | 0 (0.0%) | 0 (0.0%) |
| $10,000 to $12,499 | 0 (0.0%) | 0 (0.0%) |
| $12,500 to $14,999 | 0 (0.0%) | 0 (0.0%) |
| $15,000 to $17,499 | 0 (0.0%) | 3 (30.0%) |
| $17,500 to $19,999 | 0 (0.0%) | 0 (0.0%) |
| $20,000 to $22,499 | 0 (0.0%) | 2 (20.0%) |
| $22,500 to $24,999 | 0 (0.0%) | 0 (0.0%) |
| $25,000 to $29,999 | 0 (0.0%) | 0 (0.0%) |
| $30,000 to $34,999 | 11 (64.7%) | 4 (40.0%) |
| $35,000 to $39,999 | 0 (0.0%) | 0 (0.0%) |
| $40,000 to $44,999 | 0 (0.0%) | 0 (0.0%) |
| $45,000 to $49,999 | 1 (5.9%) | 0 (0.0%) |
| $50,000 to $54,999 | 0 (0.0%) | 0 (0.0%) |
| $55,000 to $64,999 | 0 (0.0%) | 0 (0.0%) |
| $65,000 to $74,999 | 0 (0.0%) | 0 (0.0%) |
| $75,000 to $99,999 | 2 (11.8%) | 0 (0.0%) |
| $100,000+ | 1 (5.9%) | 0 (0.0%) |
| Total | 17 (100.0%) | 10 (100.0%) |
Earnings by Sex by Educational Attainment in Butte City
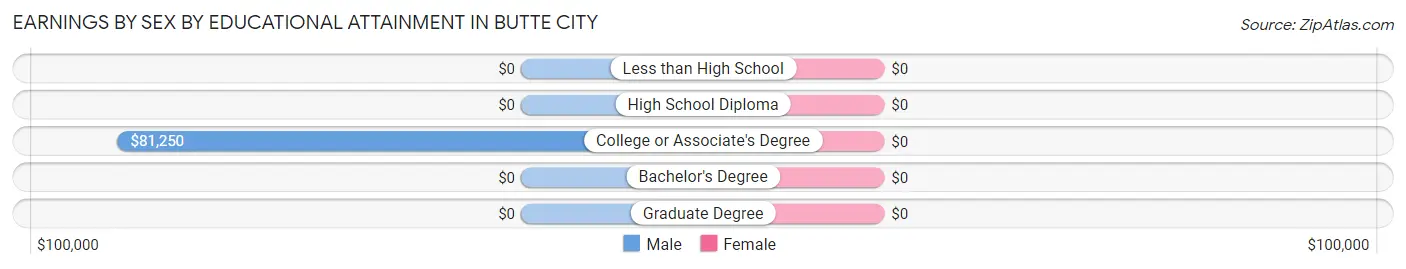
| Educational Attainment | Male Income | Female Income |
| Less than High School | - | - |
| High School Diploma | - | - |
| College or Associate's Degree | $81,250 | $0 |
| Bachelor's Degree | - | - |
| Graduate Degree | - | - |
| Total | $31,477 | $21,250 |
Family Income in Butte City
Family Income Brackets in Butte City
According to the Butte City family income data, there are 2 families falling into the $75,000 to $99,999 income range, which is the most common income bracket and makes up 100.0% of all families.
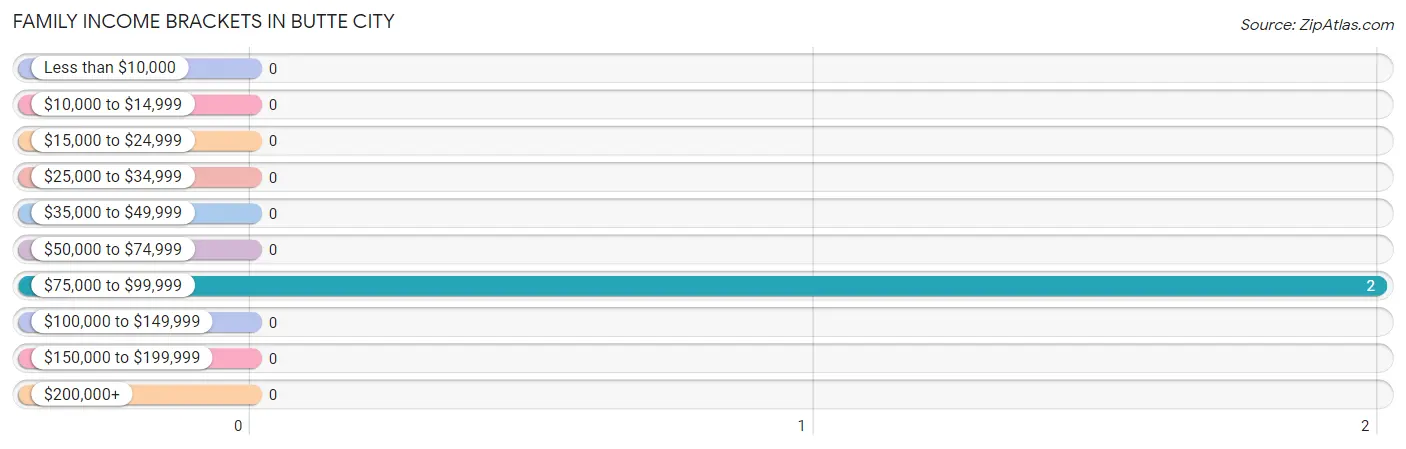
| Income Bracket | # Families | % Families |
| Less than $10,000 | 0 | 0.0% |
| $10,000 to $14,999 | 0 | 0.0% |
| $15,000 to $24,999 | 0 | 0.0% |
| $25,000 to $34,999 | 0 | 0.0% |
| $35,000 to $49,999 | 0 | 0.0% |
| $50,000 to $74,999 | 0 | 0.0% |
| $75,000 to $99,999 | 2 | 100.0% |
| $100,000 to $149,999 | 0 | 0.0% |
| $150,000 to $199,999 | 0 | 0.0% |
| $200,000+ | 0 | 0.0% |
Family Income by Famaliy Size in Butte City
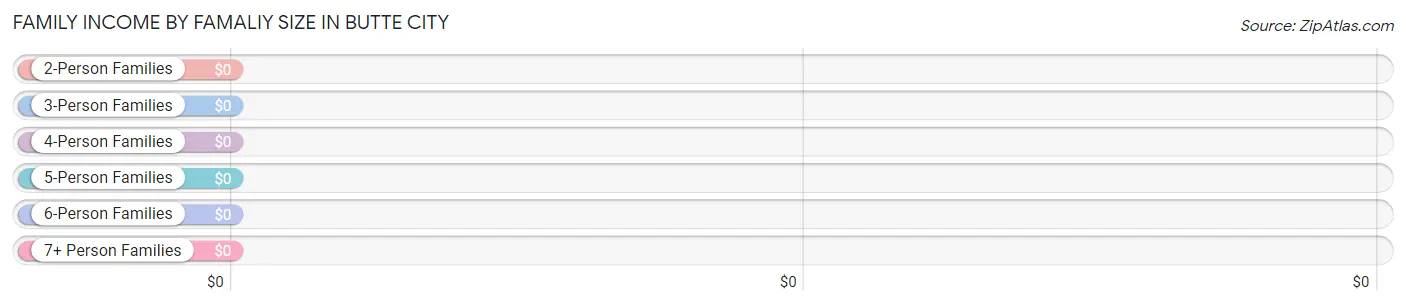
| Income Bracket | # Families | Median Income |
| 2-Person Families | 0 (0.0%) | $0 |
| 3-Person Families | 2 (100.0%) | $0 |
| 4-Person Families | 0 (0.0%) | $0 |
| 5-Person Families | 0 (0.0%) | $0 |
| 6-Person Families | 0 (0.0%) | $0 |
| 7+ Person Families | 0 (0.0%) | $0 |
| Total | 2 (100.0%) | $0 |
Family Income by Number of Earners in Butte City
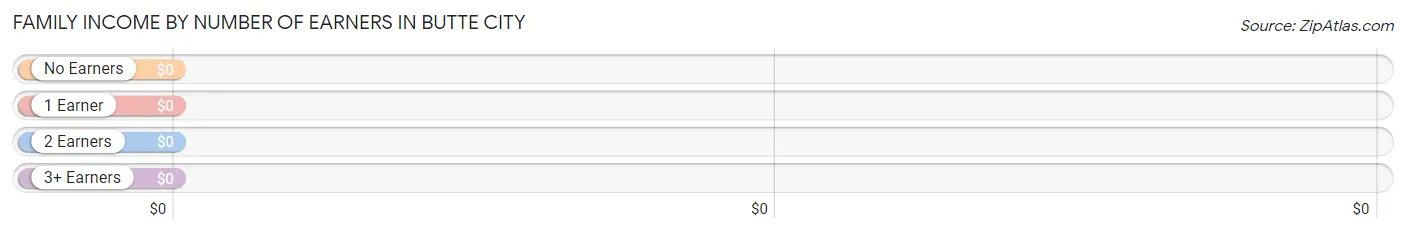
| Number of Earners | # Families | Median Income |
| No Earners | 0 (0.0%) | $0 |
| 1 Earner | 0 (0.0%) | $0 |
| 2 Earners | 2 (100.0%) | $0 |
| 3+ Earners | 0 (0.0%) | $0 |
| Total | 2 (100.0%) | $0 |
Household Income in Butte City
Household Income Brackets in Butte City
With 27 households falling in the category, the $10,000 to $14,999 income range is the most frequent in Butte City, accounting for 49.1% of all households.
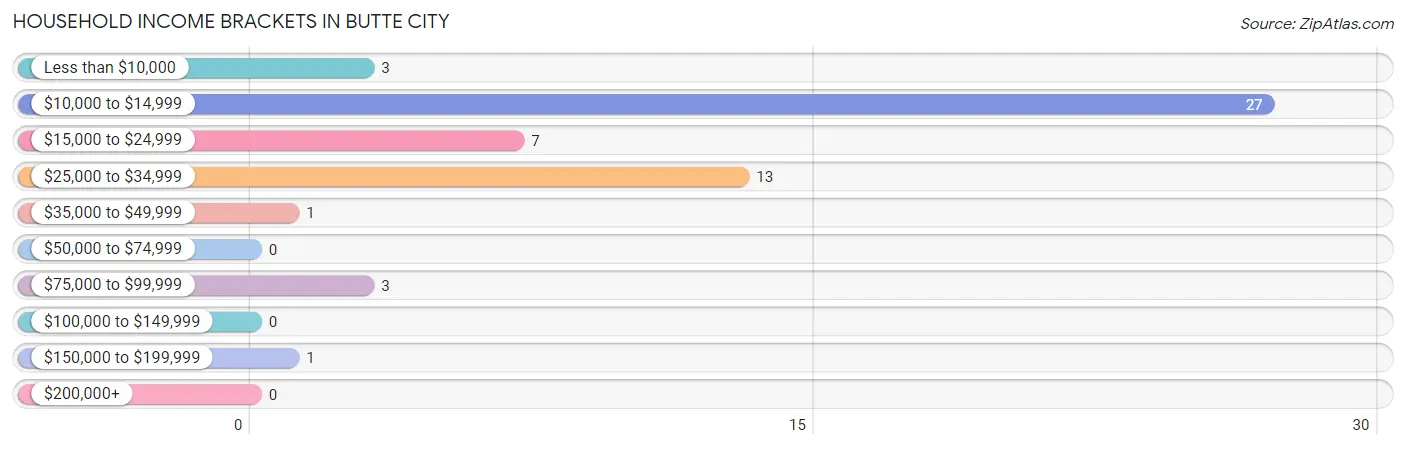
| Income Bracket | # Households | % Households |
| Less than $10,000 | 3 | 5.5% |
| $10,000 to $14,999 | 27 | 49.1% |
| $15,000 to $24,999 | 7 | 12.7% |
| $25,000 to $34,999 | 13 | 23.6% |
| $35,000 to $49,999 | 1 | 1.8% |
| $50,000 to $74,999 | 0 | 0.0% |
| $75,000 to $99,999 | 3 | 5.5% |
| $100,000 to $149,999 | 0 | 0.0% |
| $150,000 to $199,999 | 1 | 1.8% |
| $200,000+ | 0 | 0.0% |
Household Income by Householder Age in Butte City
The median household income in Butte City is $14,653, with the highest median household income of $20,833 found in the 45 to 64 years age bracket for the primary householder. A total of 12 households (21.8%) fall into this category.
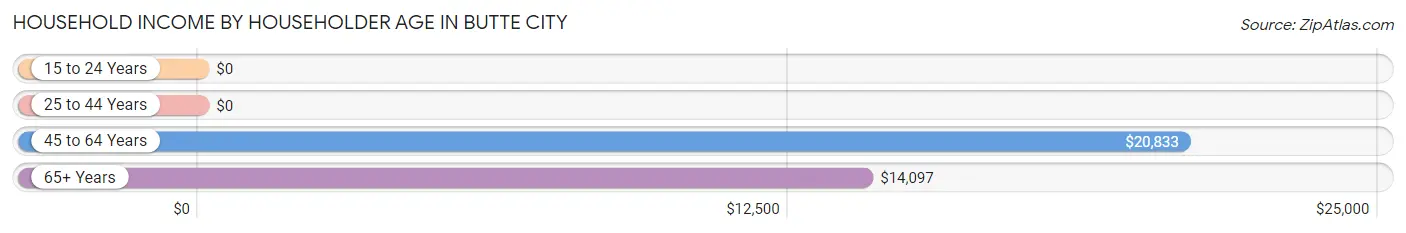
| Income Bracket | # Households | Median Income |
| 15 to 24 Years | 0 (0.0%) | $0 |
| 25 to 44 Years | 2 (3.6%) | $0 |
| 45 to 64 Years | 12 (21.8%) | $20,833 |
| 65+ Years | 41 (74.6%) | $14,097 |
| Total | 55 (100.0%) | $14,653 |
Poverty in Butte City
Income Below Poverty by Sex and Age in Butte City
With 29.7% poverty level for males and 57.1% for females among the residents of Butte City, 75 year old and over males and 65 to 74 year old females are the most vulnerable to poverty, with 9 males (81.8%) and 16 females (100.0%) in their respective age groups living below the poverty level.
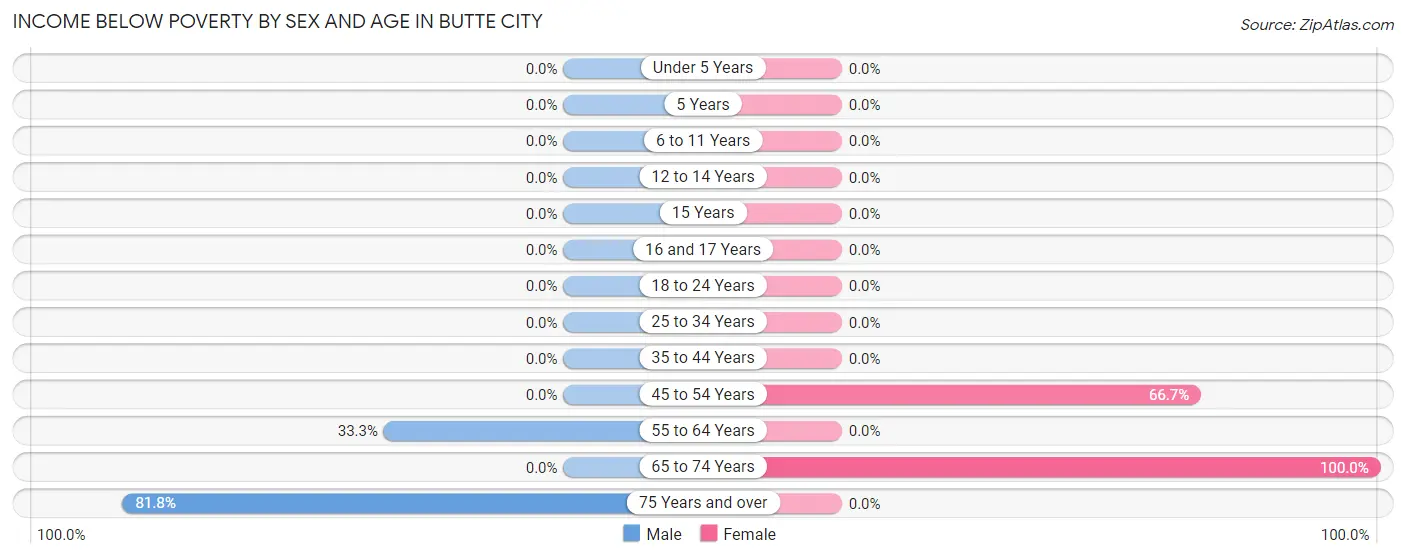
| Age Bracket | Male | Female |
| Under 5 Years | 0 (0.0%) | 0 (0.0%) |
| 5 Years | 0 (0.0%) | 0 (0.0%) |
| 6 to 11 Years | 0 (0.0%) | 0 (0.0%) |
| 12 to 14 Years | 0 (0.0%) | 0 (0.0%) |
| 15 Years | 0 (0.0%) | 0 (0.0%) |
| 16 and 17 Years | 0 (0.0%) | 0 (0.0%) |
| 18 to 24 Years | 0 (0.0%) | 0 (0.0%) |
| 25 to 34 Years | 0 (0.0%) | 0 (0.0%) |
| 35 to 44 Years | 0 (0.0%) | 0 (0.0%) |
| 45 to 54 Years | 0 (0.0%) | 4 (66.7%) |
| 55 to 64 Years | 2 (33.3%) | 0 (0.0%) |
| 65 to 74 Years | 0 (0.0%) | 16 (100.0%) |
| 75 Years and over | 9 (81.8%) | 0 (0.0%) |
| Total | 11 (29.7%) | 20 (57.1%) |
Income Above Poverty by Sex and Age in Butte City
According to the poverty statistics in Butte City, males aged 35 to 44 years and females aged 6 to 11 years are the age groups that are most secure financially, with 100.0% of males and 100.0% of females in these age groups living above the poverty line.
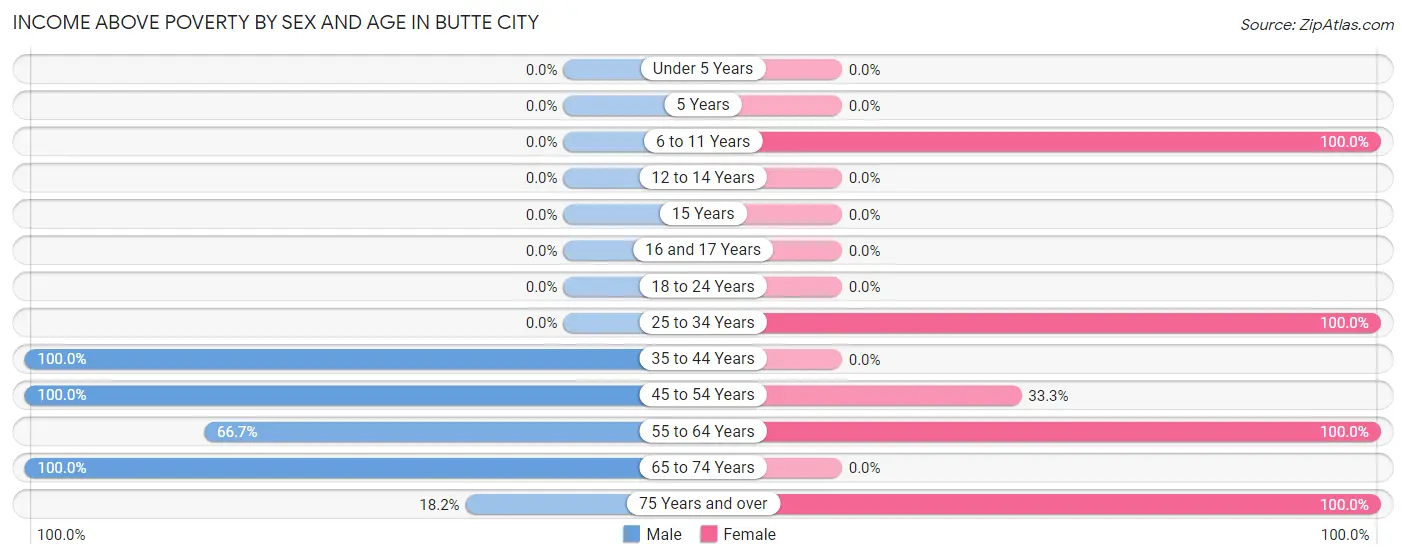
| Age Bracket | Male | Female |
| Under 5 Years | 0 (0.0%) | 0 (0.0%) |
| 5 Years | 0 (0.0%) | 0 (0.0%) |
| 6 to 11 Years | 0 (0.0%) | 4 (100.0%) |
| 12 to 14 Years | 0 (0.0%) | 0 (0.0%) |
| 15 Years | 0 (0.0%) | 0 (0.0%) |
| 16 and 17 Years | 0 (0.0%) | 0 (0.0%) |
| 18 to 24 Years | 0 (0.0%) | 0 (0.0%) |
| 25 to 34 Years | 0 (0.0%) | 3 (100.0%) |
| 35 to 44 Years | 2 (100.0%) | 0 (0.0%) |
| 45 to 54 Years | 1 (100.0%) | 2 (33.3%) |
| 55 to 64 Years | 4 (66.7%) | 4 (100.0%) |
| 65 to 74 Years | 17 (100.0%) | 0 (0.0%) |
| 75 Years and over | 2 (18.2%) | 2 (100.0%) |
| Total | 26 (70.3%) | 15 (42.9%) |
Income Below Poverty Among Married-Couple Families in Butte City
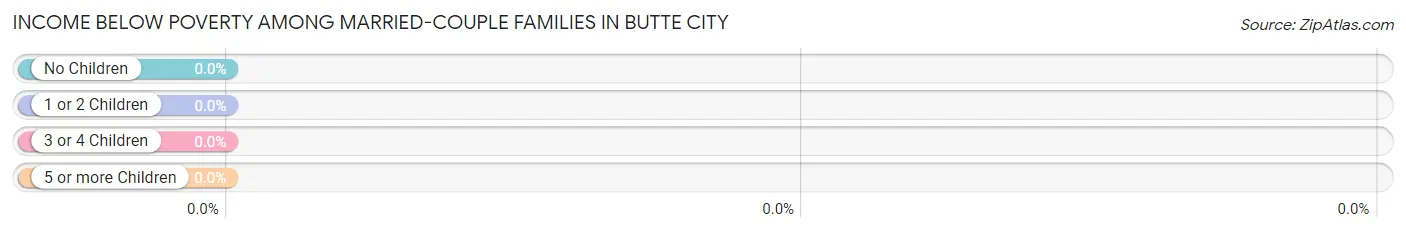
| Children | Above Poverty | Below Poverty |
| No Children | 0 (0.0%) | 0 (0.0%) |
| 1 or 2 Children | 2 (100.0%) | 0 (0.0%) |
| 3 or 4 Children | 0 (0.0%) | 0 (0.0%) |
| 5 or more Children | 0 (0.0%) | 0 (0.0%) |
| Total | 2 (100.0%) | 0 (0.0%) |
Income Below Poverty Among Single-Parent Households in Butte City
| Children | Single Father | Single Mother |
| No Children | 0 (0.0%) | 0 (0.0%) |
| 1 or 2 Children | 0 (0.0%) | 0 (0.0%) |
| 3 or 4 Children | 0 (0.0%) | 0 (0.0%) |
| 5 or more Children | 0 (0.0%) | 0 (0.0%) |
| Total | 0 (0.0%) | 0 (0.0%) |
Income Below Poverty Among Married-Couple vs Single-Parent Households in Butte City
| Children | Married-Couple Families | Single-Parent Households |
| No Children | 0 (0.0%) | 0 (0.0%) |
| 1 or 2 Children | 0 (0.0%) | 0 (0.0%) |
| 3 or 4 Children | 0 (0.0%) | 0 (0.0%) |
| 5 or more Children | 0 (0.0%) | 0 (0.0%) |
| Total | 0 (0.0%) | 0 (0.0%) |
Race in Butte City
The most populous races in Butte City are White / Caucasian (49 | 68.1%), Two or more Races (23 | 31.9%), and Hispanic or Latino (11 | 15.3%).
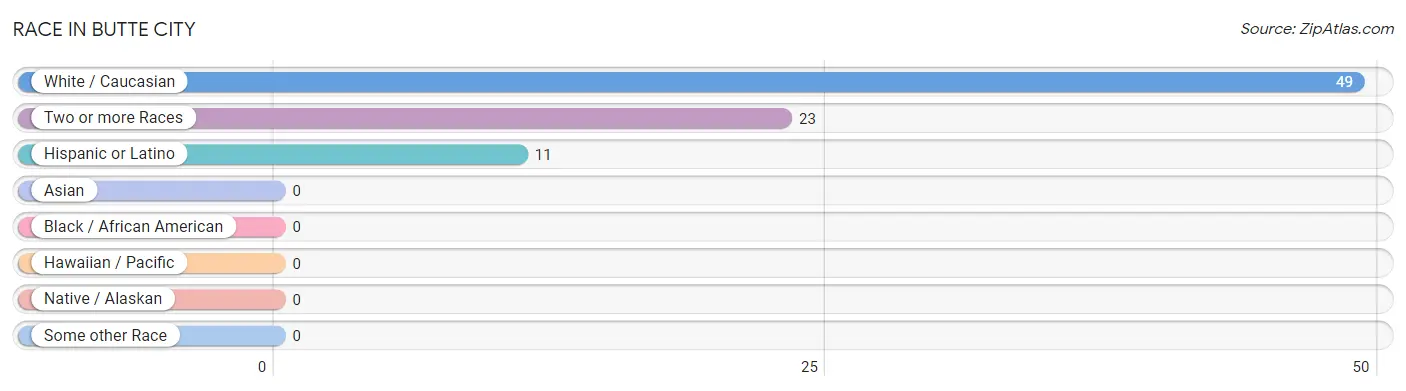
| Race | # Population | % Population |
| Asian | 0 | 0.0% |
| Black / African American | 0 | 0.0% |
| Hawaiian / Pacific | 0 | 0.0% |
| Hispanic or Latino | 11 | 15.3% |
| Native / Alaskan | 0 | 0.0% |
| White / Caucasian | 49 | 68.1% |
| Two or more Races | 23 | 31.9% |
| Some other Race | 0 | 0.0% |
| Total | 72 | 100.0% |
Ancestry in Butte City
The most populous ancestries reported in Butte City are Austrian (16 | 22.2%), Dutch (16 | 22.2%), Mexican (11 | 15.3%), American (10 | 13.9%), and German (9 | 12.5%), together accounting for 86.1% of all Butte City residents.
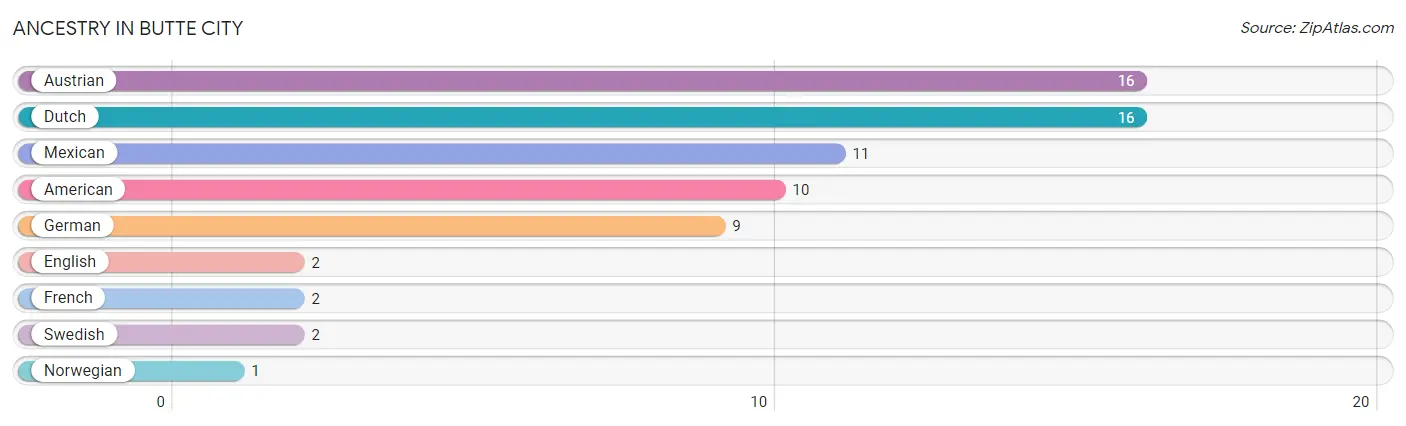
| Ancestry | # Population | % Population |
| American | 10 | 13.9% |
| Austrian | 16 | 22.2% |
| Dutch | 16 | 22.2% |
| English | 2 | 2.8% |
| French | 2 | 2.8% |
| German | 9 | 12.5% |
| Mexican | 11 | 15.3% |
| Norwegian | 1 | 1.4% |
| Swedish | 2 | 2.8% | View All 9 Rows |
Immigrants in Butte City
The most numerous immigrant groups reported in Butte City came from Central America (11 | 15.3%), Latin America (11 | 15.3%), and Mexico (11 | 15.3%), together accounting for 45.8% of all Butte City residents.
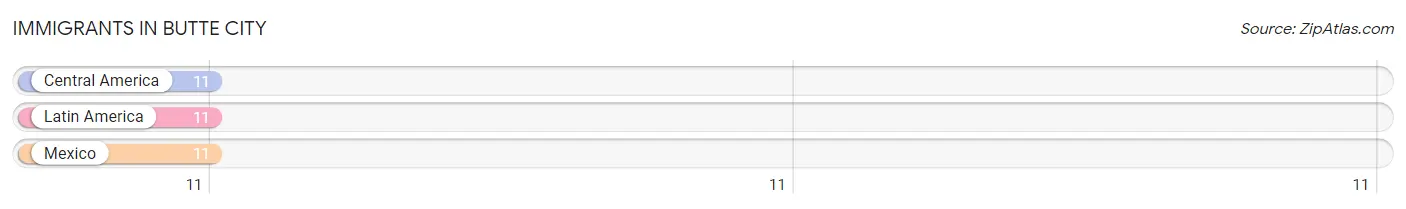
| Immigration Origin | # Population | % Population |
| Central America | 11 | 15.3% |
| Latin America | 11 | 15.3% |
| Mexico | 11 | 15.3% | View All 3 Rows |
Sex and Age in Butte City
Sex and Age in Butte City
The most populous age groups in Butte City are 70 to 74 Years (11 | 29.7%) for men and 70 to 74 Years (16 | 45.7%) for women.
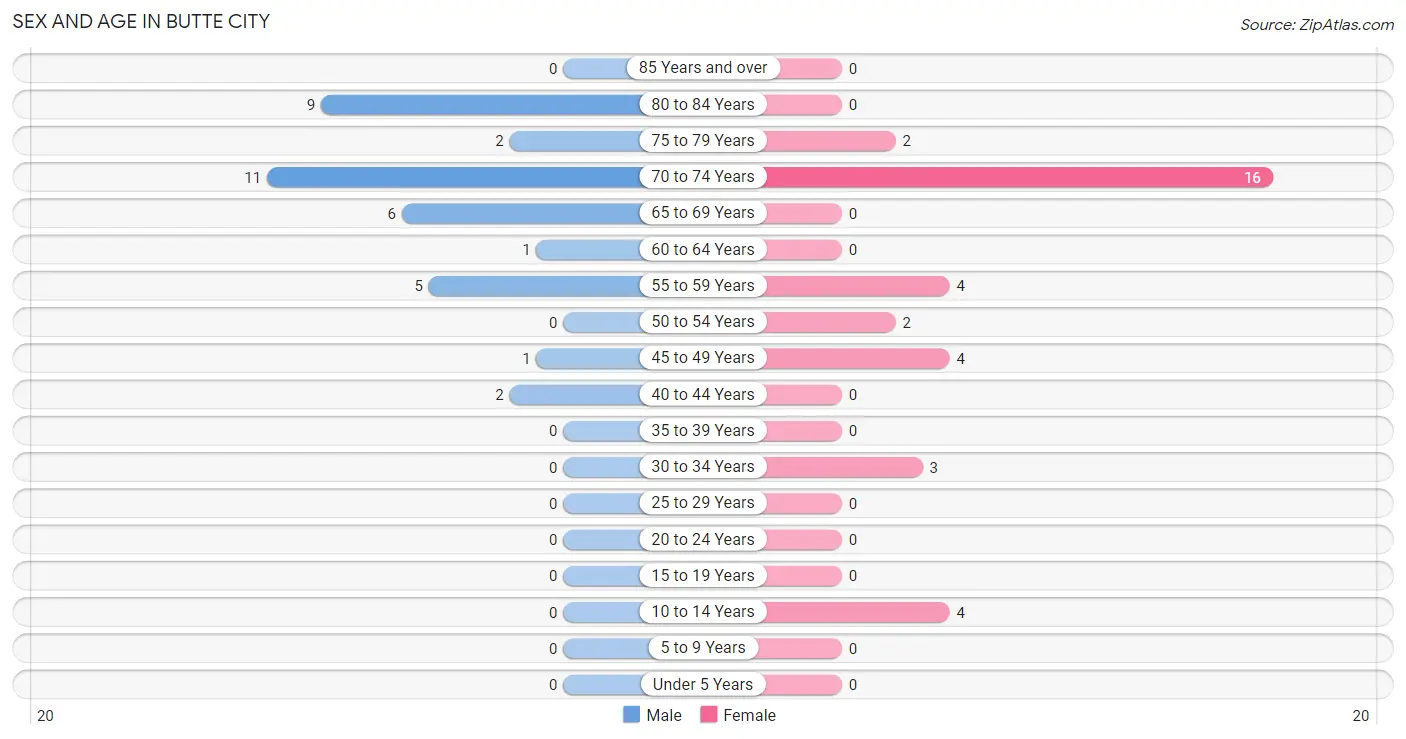
| Age Bracket | Male | Female |
| Under 5 Years | 0 (0.0%) | 0 (0.0%) |
| 5 to 9 Years | 0 (0.0%) | 0 (0.0%) |
| 10 to 14 Years | 0 (0.0%) | 4 (11.4%) |
| 15 to 19 Years | 0 (0.0%) | 0 (0.0%) |
| 20 to 24 Years | 0 (0.0%) | 0 (0.0%) |
| 25 to 29 Years | 0 (0.0%) | 0 (0.0%) |
| 30 to 34 Years | 0 (0.0%) | 3 (8.6%) |
| 35 to 39 Years | 0 (0.0%) | 0 (0.0%) |
| 40 to 44 Years | 2 (5.4%) | 0 (0.0%) |
| 45 to 49 Years | 1 (2.7%) | 4 (11.4%) |
| 50 to 54 Years | 0 (0.0%) | 2 (5.7%) |
| 55 to 59 Years | 5 (13.5%) | 4 (11.4%) |
| 60 to 64 Years | 1 (2.7%) | 0 (0.0%) |
| 65 to 69 Years | 6 (16.2%) | 0 (0.0%) |
| 70 to 74 Years | 11 (29.7%) | 16 (45.7%) |
| 75 to 79 Years | 2 (5.4%) | 2 (5.7%) |
| 80 to 84 Years | 9 (24.3%) | 0 (0.0%) |
| 85 Years and over | 0 (0.0%) | 0 (0.0%) |
| Total | 37 (100.0%) | 35 (100.0%) |
Families and Households in Butte City
Median Family Size in Butte City
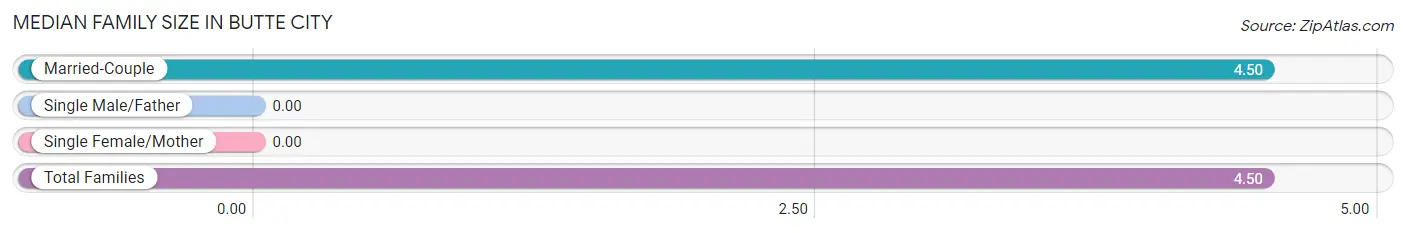
| Family Type | # Families | Family Size |
| Married-Couple | 2 (100.0%) | 4.50 |
| Single Male/Father | 0 (0.0%) | - |
| Single Female/Mother | 0 (0.0%) | - |
| Total Families | 2 (100.0%) | 4.50 |
Median Household Size in Butte City
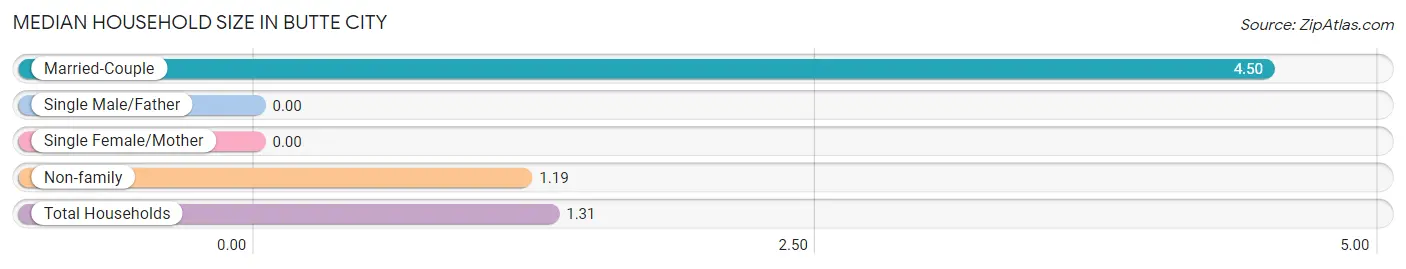
| Household Type | # Households | Household Size |
| Married-Couple | 2 (3.6%) | 4.50 |
| Single Male/Father | 0 (0.0%) | - |
| Single Female/Mother | 0 (0.0%) | - |
| Non-family | 53 (96.4%) | 1.19 |
| Total Households | 55 (100.0%) | 1.31 |
Household Size by Marriage Status in Butte City
Out of a total of 55 households in Butte City, 2 (3.6%) are family households, while 53 (96.4%) are nonfamily households. The most numerous type of family households are 3-person households, comprising 2, and the most common type of nonfamily households are 1-person households, comprising 49.
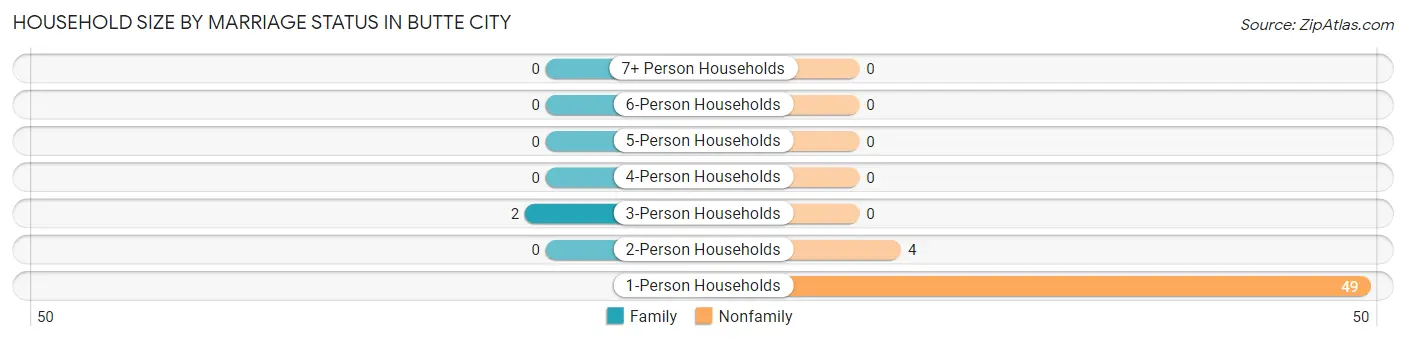
| Household Size | Family Households | Nonfamily Households |
| 1-Person Households | - | 49 (89.1%) |
| 2-Person Households | 0 (0.0%) | 4 (7.3%) |
| 3-Person Households | 2 (3.6%) | 0 (0.0%) |
| 4-Person Households | 0 (0.0%) | 0 (0.0%) |
| 5-Person Households | 0 (0.0%) | 0 (0.0%) |
| 6-Person Households | 0 (0.0%) | 0 (0.0%) |
| 7+ Person Households | 0 (0.0%) | 0 (0.0%) |
| Total | 2 (3.6%) | 53 (96.4%) |
Female Fertility in Butte City
Fertility by Age in Butte City
| Age Bracket | Women with Births | Births / 1,000 Women |
| 15 to 19 years | 0 (0.0%) | 0.0 |
| 20 to 34 years | 0 (0.0%) | 0.0 |
| 35 to 50 years | 0 (0.0%) | 0.0 |
| Total | 0 (0.0%) | 0.0 |
Fertility by Age by Marriage Status in Butte City
| Age Bracket | Married | Unmarried |
| 15 to 19 years | 0 (0.0%) | 0 (0.0%) |
| 20 to 34 years | 0 (0.0%) | 0 (0.0%) |
| 35 to 50 years | 0 (0.0%) | 0 (0.0%) |
| Total | 0 (0.0%) | 0 (0.0%) |
Fertility by Education in Butte City
| Educational Attainment | Women with Births | Births / 1,000 Women |
| Less than High School | 0 (0.0%) | 0.0 |
| High School Diploma | 0 (0.0%) | 0.0 |
| College or Associate's Degree | 0 (0.0%) | 0.0 |
| Bachelor's Degree | 0 (0.0%) | 0.0 |
| Graduate Degree | 0 (0.0%) | 0.0 |
| Total | 0 (0.0%) | 0.0 |
Fertility by Education by Marriage Status in Butte City
| Educational Attainment | Married | Unmarried |
| Less than High School | 0 (0.0%) | 0 (0.0%) |
| High School Diploma | 0 (0.0%) | 0 (0.0%) |
| College or Associate's Degree | 0 (0.0%) | 0 (0.0%) |
| Bachelor's Degree | 0 (0.0%) | 0 (0.0%) |
| Graduate Degree | 0 (0.0%) | 0 (0.0%) |
| Total | 0 (0.0%) | 0 (0.0%) |
Employment Characteristics in Butte City
Employment by Class of Employer in Butte City
Among the 27 employed individuals in Butte City, private company employees (15 | 55.6%), self-employed (not incorporated) (11 | 40.7%), and not-for-profit organizations (1 | 3.7%) make up the most common classes of employment.
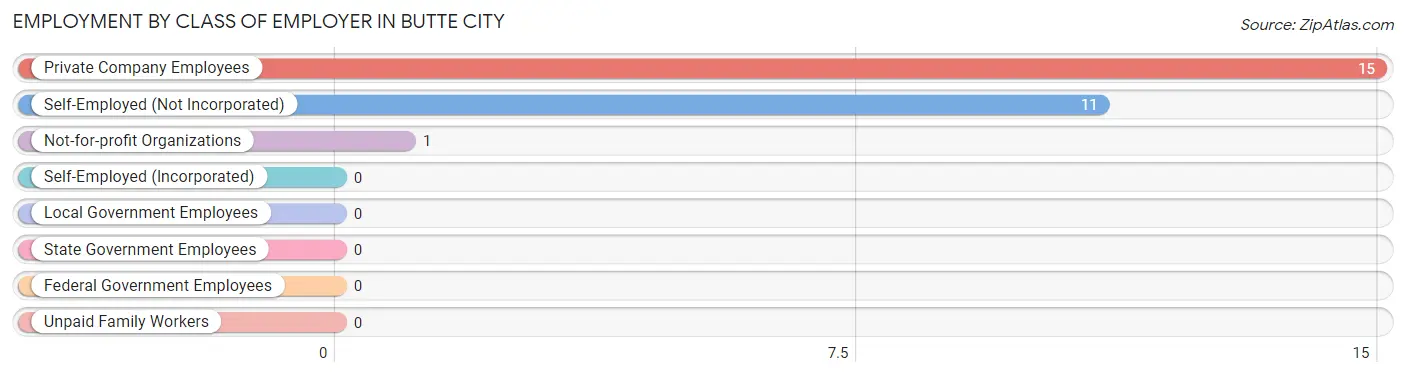
| Employer Class | # Employees | % Employees |
| Private Company Employees | 15 | 55.6% |
| Self-Employed (Incorporated) | 0 | 0.0% |
| Self-Employed (Not Incorporated) | 11 | 40.7% |
| Not-for-profit Organizations | 1 | 3.7% |
| Local Government Employees | 0 | 0.0% |
| State Government Employees | 0 | 0.0% |
| Federal Government Employees | 0 | 0.0% |
| Unpaid Family Workers | 0 | 0.0% |
| Total | 27 | 100.0% |
Employment Status by Age in Butte City
According to the labor force statistics for Butte City, out of the total population over 16 years of age (68), 44.1% or 30 individuals are in the labor force, with 10.0% or 3 of them unemployed. The age group with the highest labor force participation rate is 30 to 34 years, with 100.0% or 3 individuals in the labor force. Within the labor force, the 45 to 54 years age range has the highest percentage of unemployed individuals, with 42.9% or 3 of them being unemployed.
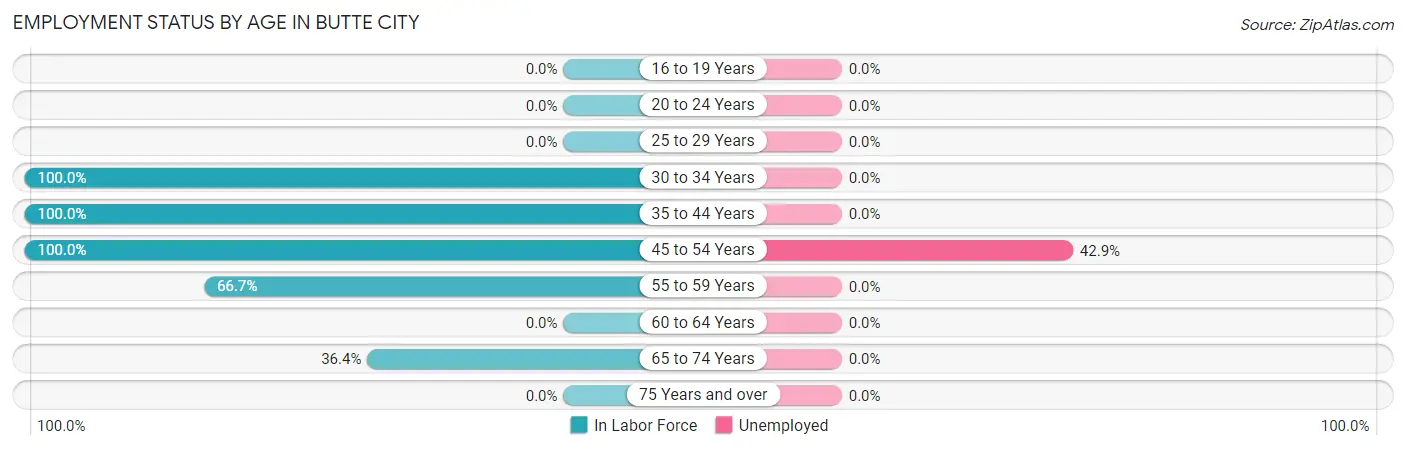
| Age Bracket | In Labor Force | Unemployed |
| 16 to 19 Years | 0 (0.0%) | 0 (0.0%) |
| 20 to 24 Years | 0 (0.0%) | 0 (0.0%) |
| 25 to 29 Years | 0 (0.0%) | 0 (0.0%) |
| 30 to 34 Years | 3 (100.0%) | 0 (0.0%) |
| 35 to 44 Years | 2 (100.0%) | 0 (0.0%) |
| 45 to 54 Years | 7 (100.0%) | 3 (42.9%) |
| 55 to 59 Years | 6 (66.7%) | 0 (0.0%) |
| 60 to 64 Years | 0 (0.0%) | 0 (0.0%) |
| 65 to 74 Years | 12 (36.4%) | 0 (0.0%) |
| 75 Years and over | 0 (0.0%) | 0 (0.0%) |
| Total | 30 (44.1%) | 3 (10.0%) |
Employment Status by Educational Attainment in Butte City
According to labor force statistics for Butte City, 81.8% of individuals (18) out of the total population between 25 and 64 years of age (22) are in the labor force, with 16.7% or 3 of them being unemployed. The group with the highest labor force participation rate are those with the educational attainment of college / associate degree, with 100.0% or 6 individuals in the labor force. Within the labor force, individuals with high school diploma education have the highest percentage of unemployment, with 25.0% or 3 of them being unemployed.
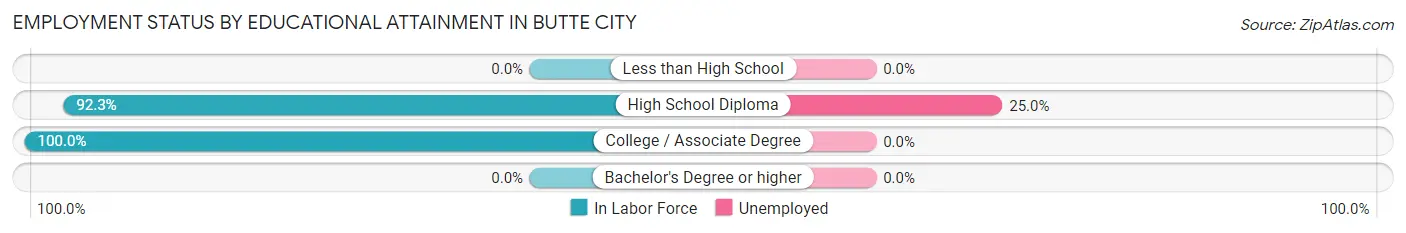
| Educational Attainment | In Labor Force | Unemployed |
| Less than High School | 0 (0.0%) | 0 (0.0%) |
| High School Diploma | 12 (92.3%) | 3 (25.0%) |
| College / Associate Degree | 6 (100.0%) | 0 (0.0%) |
| Bachelor's Degree or higher | 0 (0.0%) | 0 (0.0%) |
| Total | 18 (81.8%) | 4 (16.7%) |
Employment Occupations by Sex in Butte City
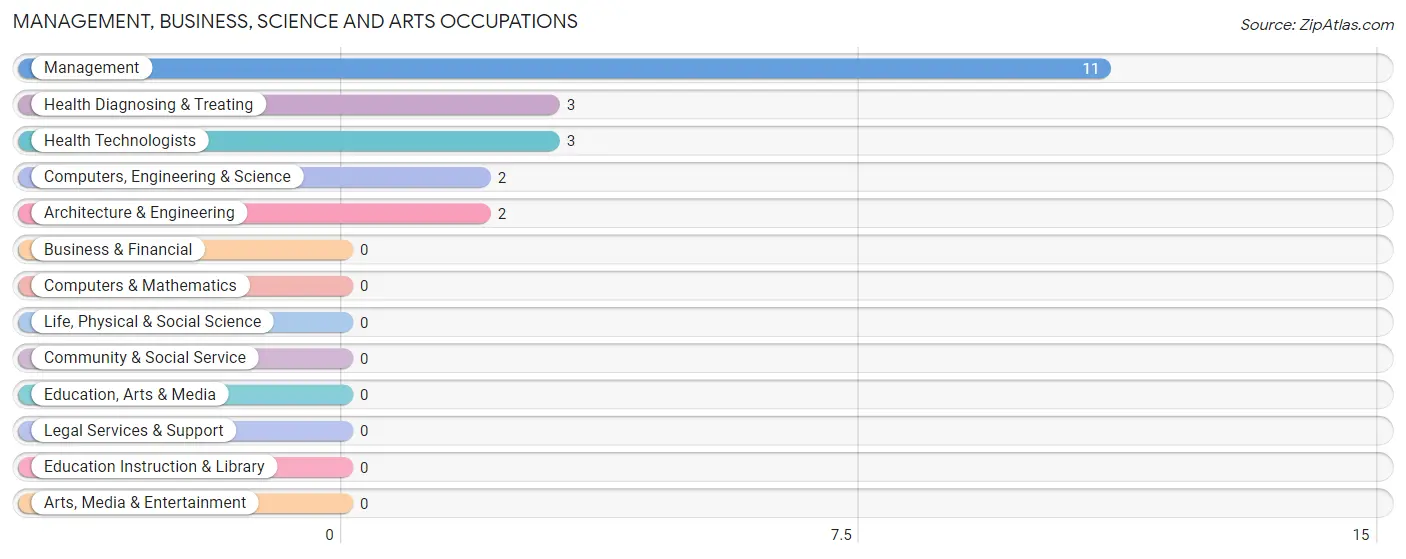
Management, Business, Science and Arts Occupations
The most common Management, Business, Science and Arts occupations in Butte City are Management (11 | 40.7%), Health Diagnosing & Treating (3 | 11.1%), Health Technologists (3 | 11.1%), Computers, Engineering & Science (2 | 7.4%), and Architecture & Engineering (2 | 7.4%).
Management, Business, Science and Arts Occupations by Sex
Within the Management, Business, Science and Arts occupations in Butte City, the most male-oriented occupations are Management (100.0%), Computers, Engineering & Science (100.0%), and Architecture & Engineering (100.0%), while the most female-oriented occupations are Health Diagnosing & Treating (100.0%), and Health Technologists (100.0%).
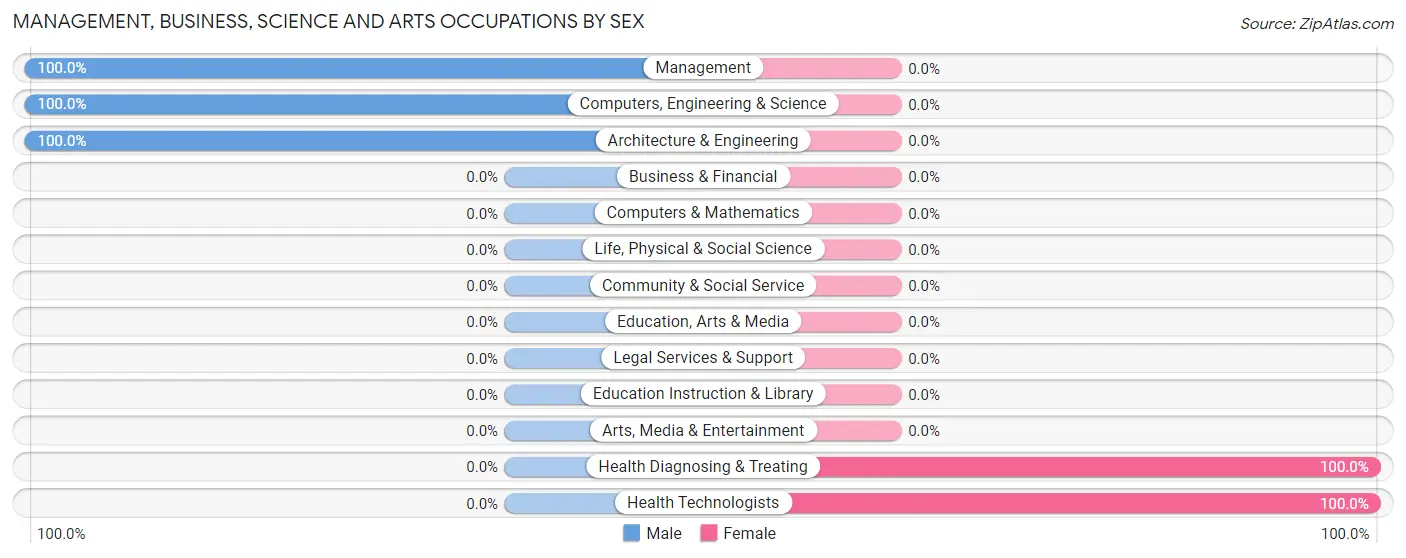
| Occupation | Male | Female |
| Management | 11 (100.0%) | 0 (0.0%) |
| Business & Financial | 0 (0.0%) | 0 (0.0%) |
| Computers, Engineering & Science | 2 (100.0%) | 0 (0.0%) |
| Computers & Mathematics | 0 (0.0%) | 0 (0.0%) |
| Architecture & Engineering | 2 (100.0%) | 0 (0.0%) |
| Life, Physical & Social Science | 0 (0.0%) | 0 (0.0%) |
| Community & Social Service | 0 (0.0%) | 0 (0.0%) |
| Education, Arts & Media | 0 (0.0%) | 0 (0.0%) |
| Legal Services & Support | 0 (0.0%) | 0 (0.0%) |
| Education Instruction & Library | 0 (0.0%) | 0 (0.0%) |
| Arts, Media & Entertainment | 0 (0.0%) | 0 (0.0%) |
| Health Diagnosing & Treating | 0 (0.0%) | 3 (100.0%) |
| Health Technologists | 0 (0.0%) | 3 (100.0%) |
| Total (Category) | 13 (81.2%) | 3 (18.8%) |
| Total (Overall) | 17 (63.0%) | 10 (37.0%) |
Services Occupations
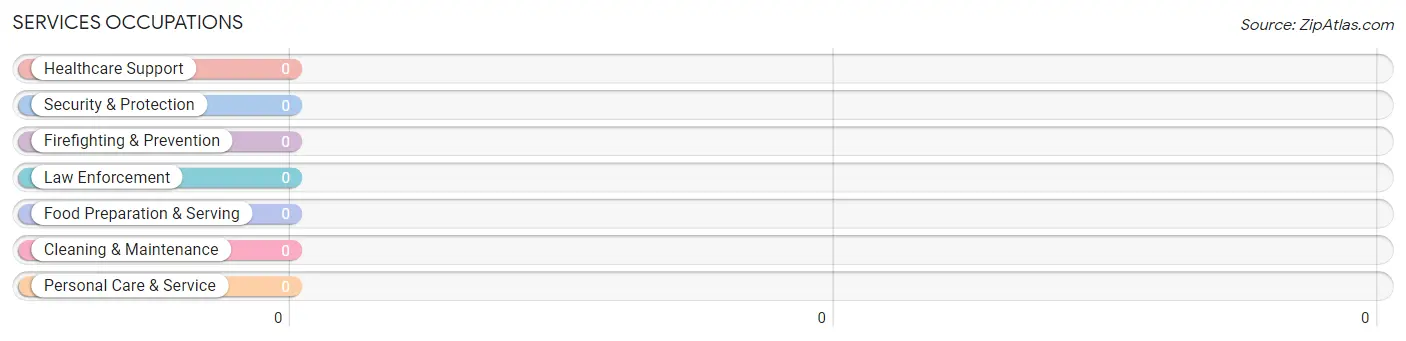
Services Occupations by Sex
| Occupation | Male | Female |
| Healthcare Support | 0 (0.0%) | 0 (0.0%) |
| Security & Protection | 0 (0.0%) | 0 (0.0%) |
| Firefighting & Prevention | 0 (0.0%) | 0 (0.0%) |
| Law Enforcement | 0 (0.0%) | 0 (0.0%) |
| Food Preparation & Serving | 0 (0.0%) | 0 (0.0%) |
| Cleaning & Maintenance | 0 (0.0%) | 0 (0.0%) |
| Personal Care & Service | 0 (0.0%) | 0 (0.0%) |
| Total (Category) | 0 (0.0%) | 0 (0.0%) |
| Total (Overall) | 17 (63.0%) | 10 (37.0%) |
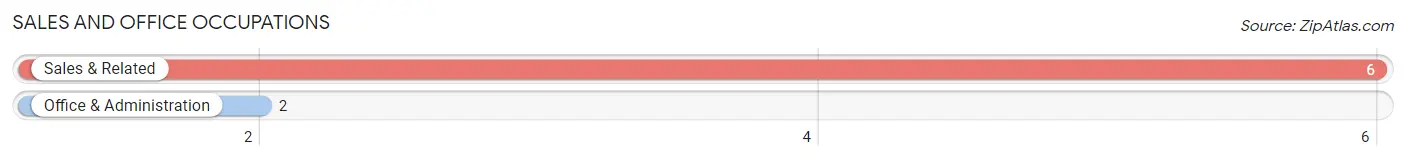
Sales and Office Occupations
The most common Sales and Office occupations in Butte City are Sales & Related (6 | 22.2%), and Office & Administration (2 | 7.4%).
Sales and Office Occupations by Sex
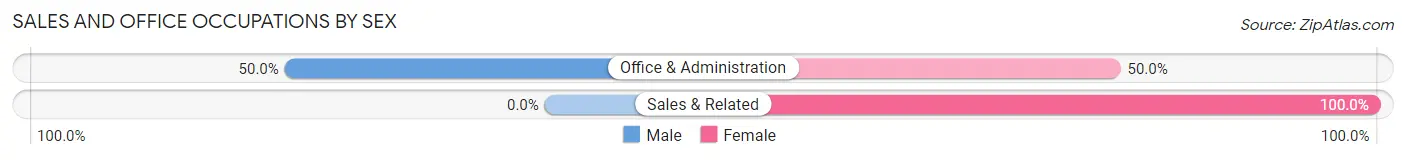
| Occupation | Male | Female |
| Sales & Related | 0 (0.0%) | 6 (100.0%) |
| Office & Administration | 1 (50.0%) | 1 (50.0%) |
| Total (Category) | 1 (12.5%) | 7 (87.5%) |
| Total (Overall) | 17 (63.0%) | 10 (37.0%) |
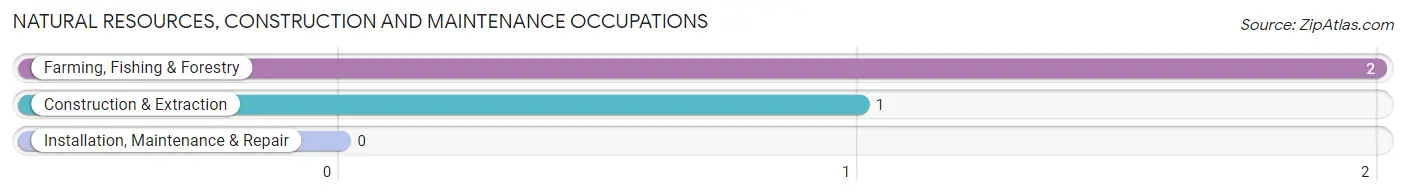
Natural Resources, Construction and Maintenance Occupations
The most common Natural Resources, Construction and Maintenance occupations in Butte City are Farming, Fishing & Forestry (2 | 7.4%), and Construction & Extraction (1 | 3.7%).
Natural Resources, Construction and Maintenance Occupations by Sex
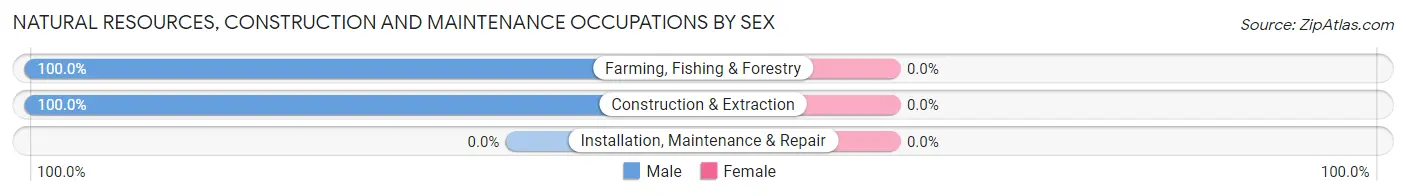
| Occupation | Male | Female |
| Farming, Fishing & Forestry | 2 (100.0%) | 0 (0.0%) |
| Construction & Extraction | 1 (100.0%) | 0 (0.0%) |
| Installation, Maintenance & Repair | 0 (0.0%) | 0 (0.0%) |
| Total (Category) | 3 (100.0%) | 0 (0.0%) |
| Total (Overall) | 17 (63.0%) | 10 (37.0%) |
Production, Transportation and Moving Occupations
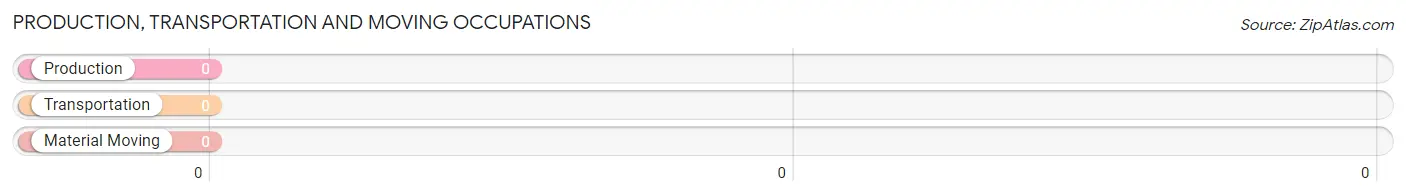
Production, Transportation and Moving Occupations by Sex
| Occupation | Male | Female |
| Production | 0 (0.0%) | 0 (0.0%) |
| Transportation | 0 (0.0%) | 0 (0.0%) |
| Material Moving | 0 (0.0%) | 0 (0.0%) |
| Total (Category) | 0 (0.0%) | 0 (0.0%) |
| Total (Overall) | 17 (63.0%) | 10 (37.0%) |
Employment Industries by Sex in Butte City
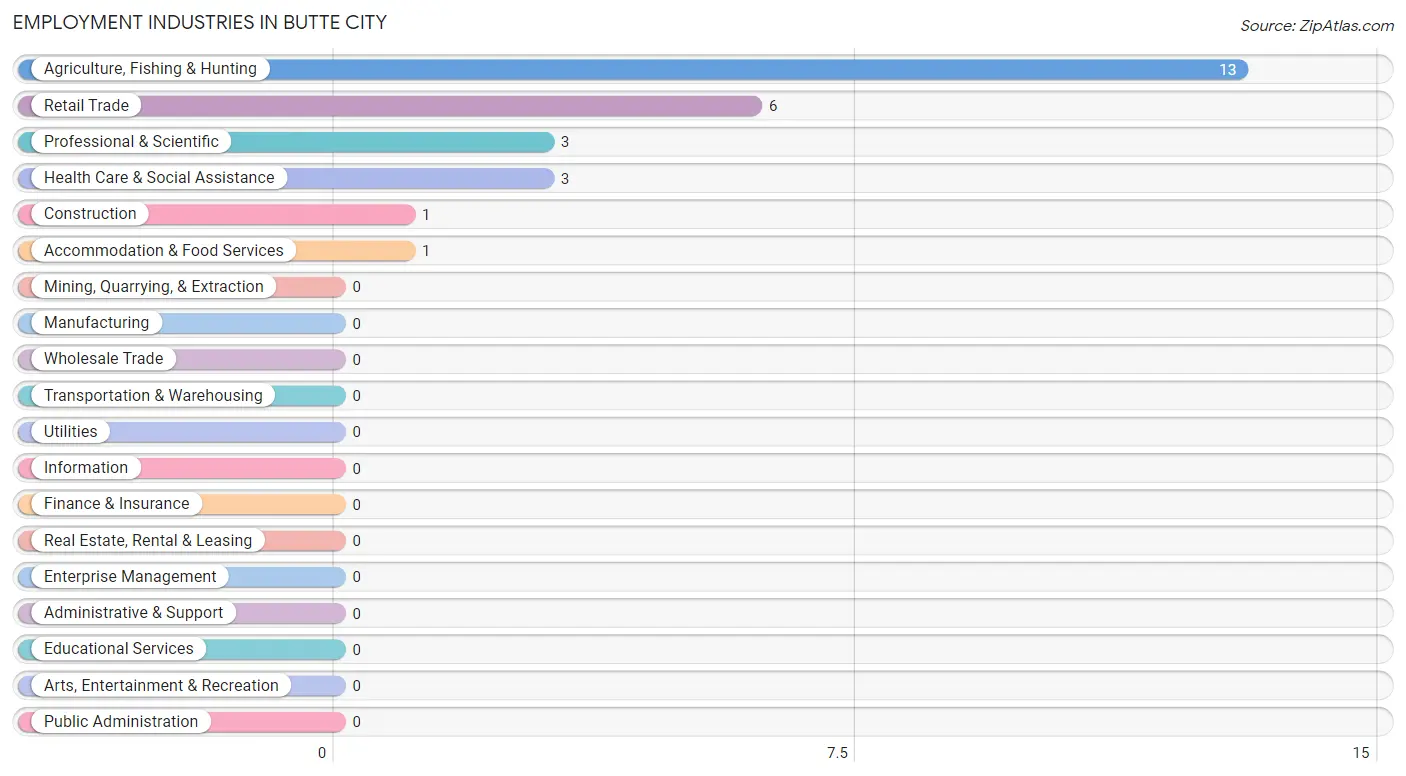
Employment Industries in Butte City
The major employment industries in Butte City include Agriculture, Fishing & Hunting (13 | 48.1%), Retail Trade (6 | 22.2%), Professional & Scientific (3 | 11.1%), Health Care & Social Assistance (3 | 11.1%), and Construction (1 | 3.7%).
Employment Industries by Sex in Butte City
The Butte City industries that see more men than women are Agriculture, Fishing & Hunting (100.0%), Construction (100.0%), and Professional & Scientific (100.0%), whereas the industries that tend to have a higher number of women are Retail Trade (100.0%), Health Care & Social Assistance (100.0%), and Accommodation & Food Services (100.0%).
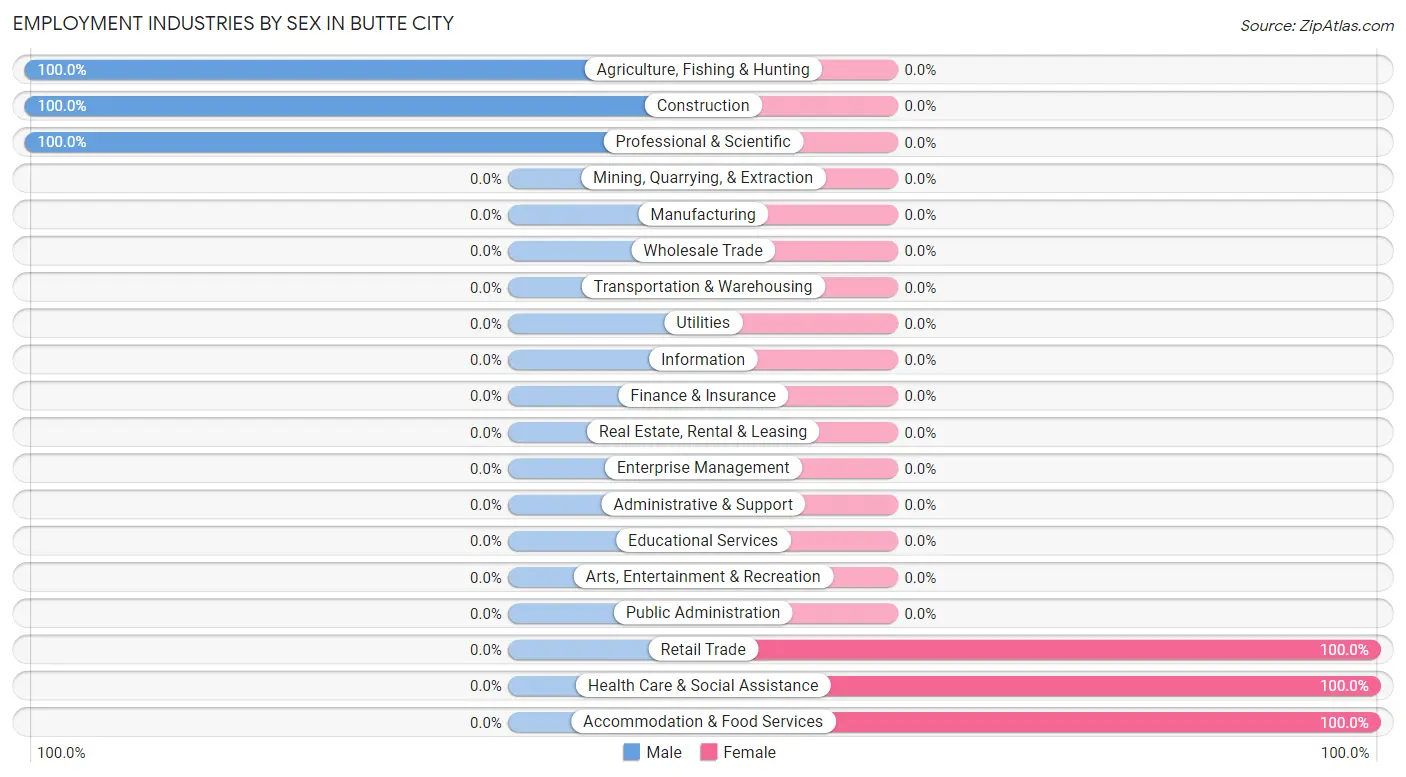
| Industry | Male | Female |
| Agriculture, Fishing & Hunting | 13 (100.0%) | 0 (0.0%) |
| Mining, Quarrying, & Extraction | 0 (0.0%) | 0 (0.0%) |
| Construction | 1 (100.0%) | 0 (0.0%) |
| Manufacturing | 0 (0.0%) | 0 (0.0%) |
| Wholesale Trade | 0 (0.0%) | 0 (0.0%) |
| Retail Trade | 0 (0.0%) | 6 (100.0%) |
| Transportation & Warehousing | 0 (0.0%) | 0 (0.0%) |
| Utilities | 0 (0.0%) | 0 (0.0%) |
| Information | 0 (0.0%) | 0 (0.0%) |
| Finance & Insurance | 0 (0.0%) | 0 (0.0%) |
| Real Estate, Rental & Leasing | 0 (0.0%) | 0 (0.0%) |
| Professional & Scientific | 3 (100.0%) | 0 (0.0%) |
| Enterprise Management | 0 (0.0%) | 0 (0.0%) |
| Administrative & Support | 0 (0.0%) | 0 (0.0%) |
| Educational Services | 0 (0.0%) | 0 (0.0%) |
| Health Care & Social Assistance | 0 (0.0%) | 3 (100.0%) |
| Arts, Entertainment & Recreation | 0 (0.0%) | 0 (0.0%) |
| Accommodation & Food Services | 0 (0.0%) | 1 (100.0%) |
| Public Administration | 0 (0.0%) | 0 (0.0%) |
| Total | 17 (63.0%) | 10 (37.0%) |
Education in Butte City
School Enrollment in Butte City
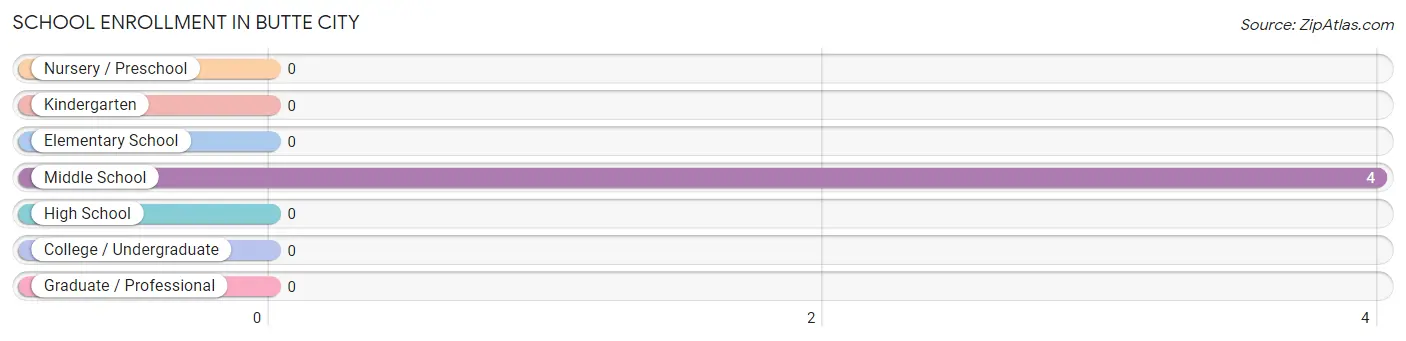
| School Level | # Students | % Students |
| Nursery / Preschool | 0 | 0.0% |
| Kindergarten | 0 | 0.0% |
| Elementary School | 0 | 0.0% |
| Middle School | 4 | 100.0% |
| High School | 0 | 0.0% |
| College / Undergraduate | 0 | 0.0% |
| Graduate / Professional | 0 | 0.0% |
| Total | 4 | 100.0% |
School Enrollment by Age by Funding Source in Butte City
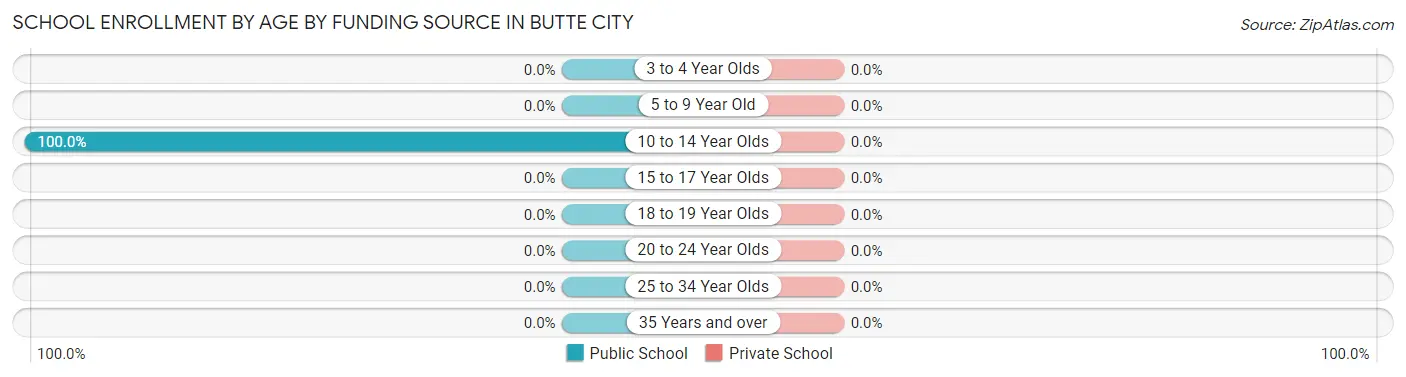
| Age Bracket | Public School | Private School |
| 3 to 4 Year Olds | 0 (0.0%) | 0 (0.0%) |
| 5 to 9 Year Old | 0 (0.0%) | 0 (0.0%) |
| 10 to 14 Year Olds | 4 (100.0%) | 0 (0.0%) |
| 15 to 17 Year Olds | 0 (0.0%) | 0 (0.0%) |
| 18 to 19 Year Olds | 0 (0.0%) | 0 (0.0%) |
| 20 to 24 Year Olds | 0 (0.0%) | 0 (0.0%) |
| 25 to 34 Year Olds | 0 (0.0%) | 0 (0.0%) |
| 35 Years and over | 0 (0.0%) | 0 (0.0%) |
| Total | 4 (100.0%) | 0 (0.0%) |
Educational Attainment by Field of Study in Butte City
Physical & health sciences (11 | 57.9%), social sciences (5 | 26.3%), and education (3 | 15.8%) are the most common fields of study among 19 individuals in Butte City who have obtained a bachelor's degree or higher.
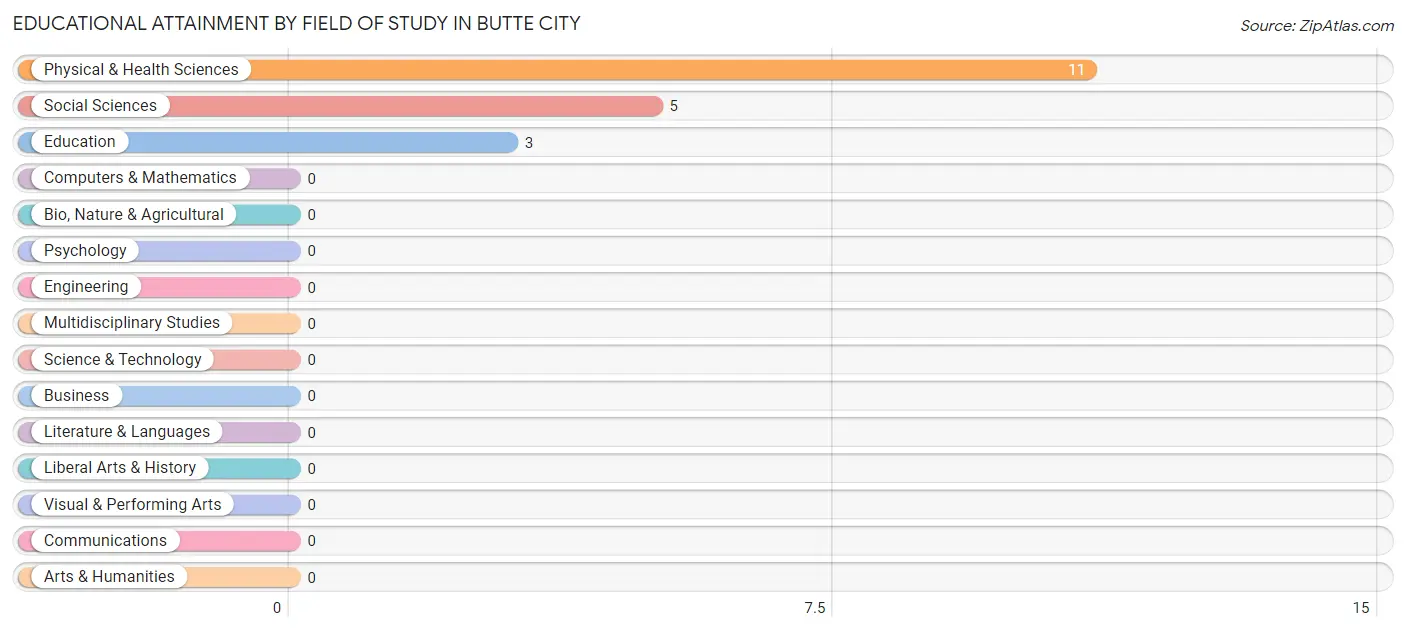
| Field of Study | # Graduates | % Graduates |
| Computers & Mathematics | 0 | 0.0% |
| Bio, Nature & Agricultural | 0 | 0.0% |
| Physical & Health Sciences | 11 | 57.9% |
| Psychology | 0 | 0.0% |
| Social Sciences | 5 | 26.3% |
| Engineering | 0 | 0.0% |
| Multidisciplinary Studies | 0 | 0.0% |
| Science & Technology | 0 | 0.0% |
| Business | 0 | 0.0% |
| Education | 3 | 15.8% |
| Literature & Languages | 0 | 0.0% |
| Liberal Arts & History | 0 | 0.0% |
| Visual & Performing Arts | 0 | 0.0% |
| Communications | 0 | 0.0% |
| Arts & Humanities | 0 | 0.0% |
| Total | 19 | 100.0% |
Transportation & Commute in Butte City
Vehicle Availability by Sex in Butte City
The most prevalent vehicle ownership categories in Butte City are males with 2 vehicles (13, accounting for 76.5%) and females with 2 vehicles (7, making up 130.0%).
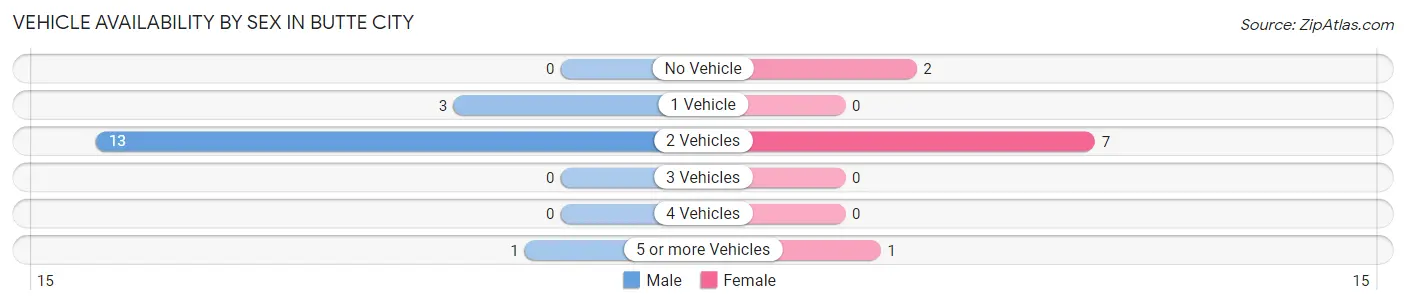
| Vehicles Available | Male | Female |
| No Vehicle | 0 (0.0%) | 2 (20.0%) |
| 1 Vehicle | 3 (17.6%) | 0 (0.0%) |
| 2 Vehicles | 13 (76.5%) | 7 (70.0%) |
| 3 Vehicles | 0 (0.0%) | 0 (0.0%) |
| 4 Vehicles | 0 (0.0%) | 0 (0.0%) |
| 5 or more Vehicles | 1 (5.9%) | 1 (10.0%) |
| Total | 17 (100.0%) | 10 (100.0%) |
Commute Time in Butte City
The most frequently occuring commute durations in Butte City are 15 to 19 minutes (11 commuters, 44.0%), 5 to 9 minutes (7 commuters, 28.0%), and 30 to 34 minutes (2 commuters, 8.0%).
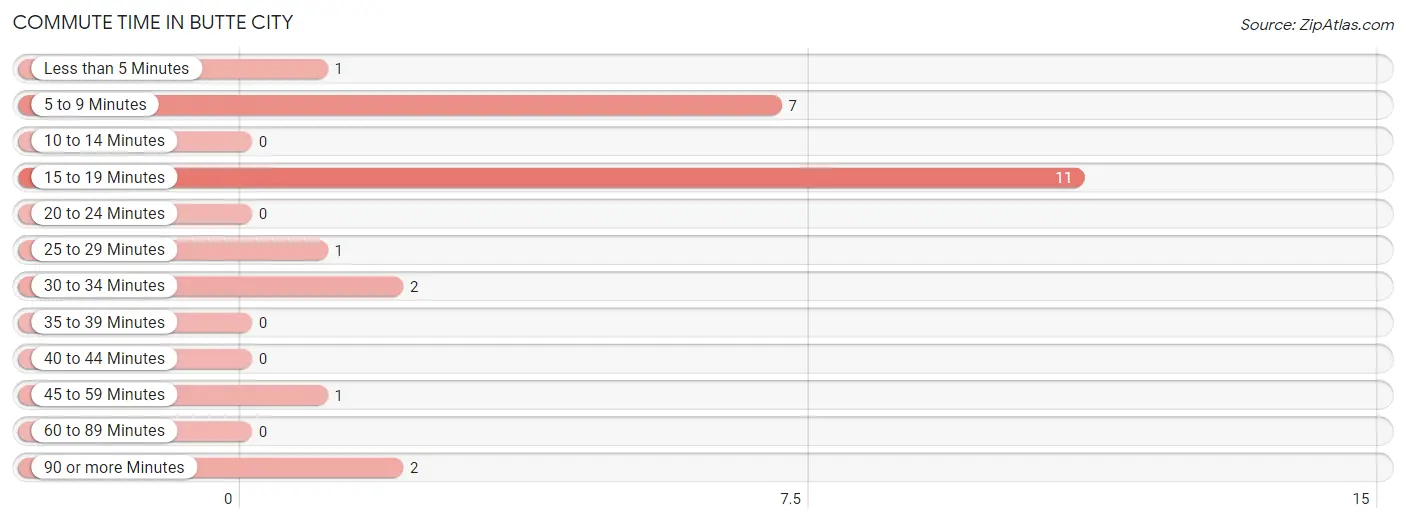
| Commute Time | # Commuters | % Commuters |
| Less than 5 Minutes | 1 | 4.0% |
| 5 to 9 Minutes | 7 | 28.0% |
| 10 to 14 Minutes | 0 | 0.0% |
| 15 to 19 Minutes | 11 | 44.0% |
| 20 to 24 Minutes | 0 | 0.0% |
| 25 to 29 Minutes | 1 | 4.0% |
| 30 to 34 Minutes | 2 | 8.0% |
| 35 to 39 Minutes | 0 | 0.0% |
| 40 to 44 Minutes | 0 | 0.0% |
| 45 to 59 Minutes | 1 | 4.0% |
| 60 to 89 Minutes | 0 | 0.0% |
| 90 or more Minutes | 2 | 8.0% |
Commute Time by Sex in Butte City
The most common commute times in Butte City are 15 to 19 minutes (11 commuters, 64.7%) for males and 5 to 9 minutes (7 commuters, 87.5%) for females.
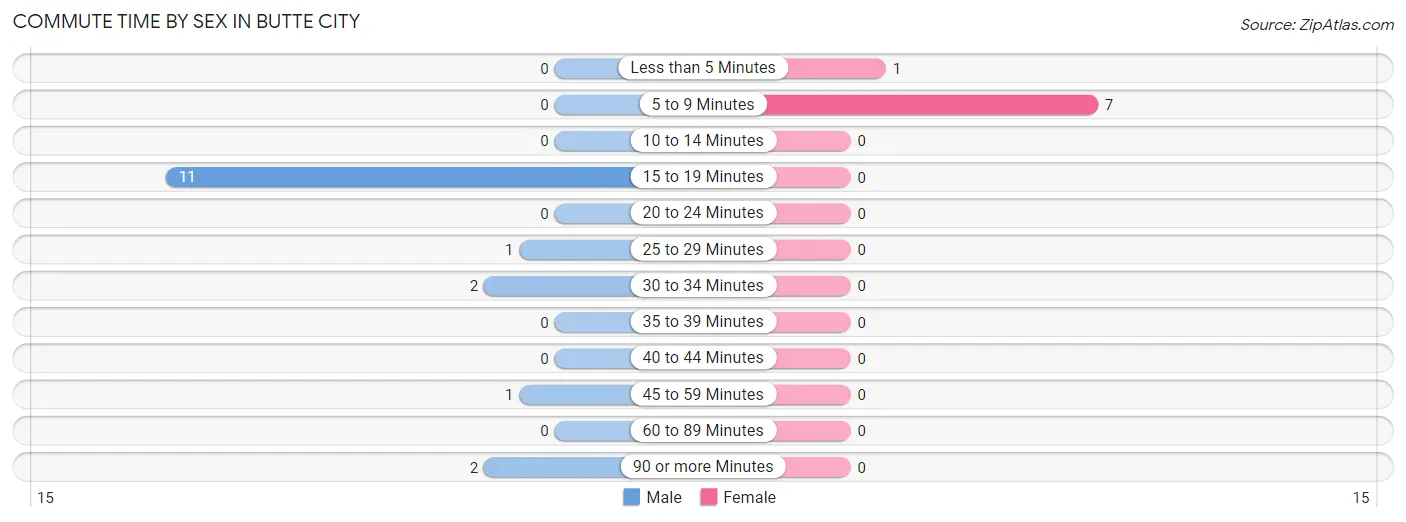
| Commute Time | Male | Female |
| Less than 5 Minutes | 0 (0.0%) | 1 (12.5%) |
| 5 to 9 Minutes | 0 (0.0%) | 7 (87.5%) |
| 10 to 14 Minutes | 0 (0.0%) | 0 (0.0%) |
| 15 to 19 Minutes | 11 (64.7%) | 0 (0.0%) |
| 20 to 24 Minutes | 0 (0.0%) | 0 (0.0%) |
| 25 to 29 Minutes | 1 (5.9%) | 0 (0.0%) |
| 30 to 34 Minutes | 2 (11.8%) | 0 (0.0%) |
| 35 to 39 Minutes | 0 (0.0%) | 0 (0.0%) |
| 40 to 44 Minutes | 0 (0.0%) | 0 (0.0%) |
| 45 to 59 Minutes | 1 (5.9%) | 0 (0.0%) |
| 60 to 89 Minutes | 0 (0.0%) | 0 (0.0%) |
| 90 or more Minutes | 2 (11.8%) | 0 (0.0%) |
Time of Departure to Work by Sex in Butte City
The most frequent times of departure to work in Butte City are 6:00 AM to 6:29 AM (12, 70.6%) for males and 10:00 AM to 10:59 AM (4, 50.0%) for females.
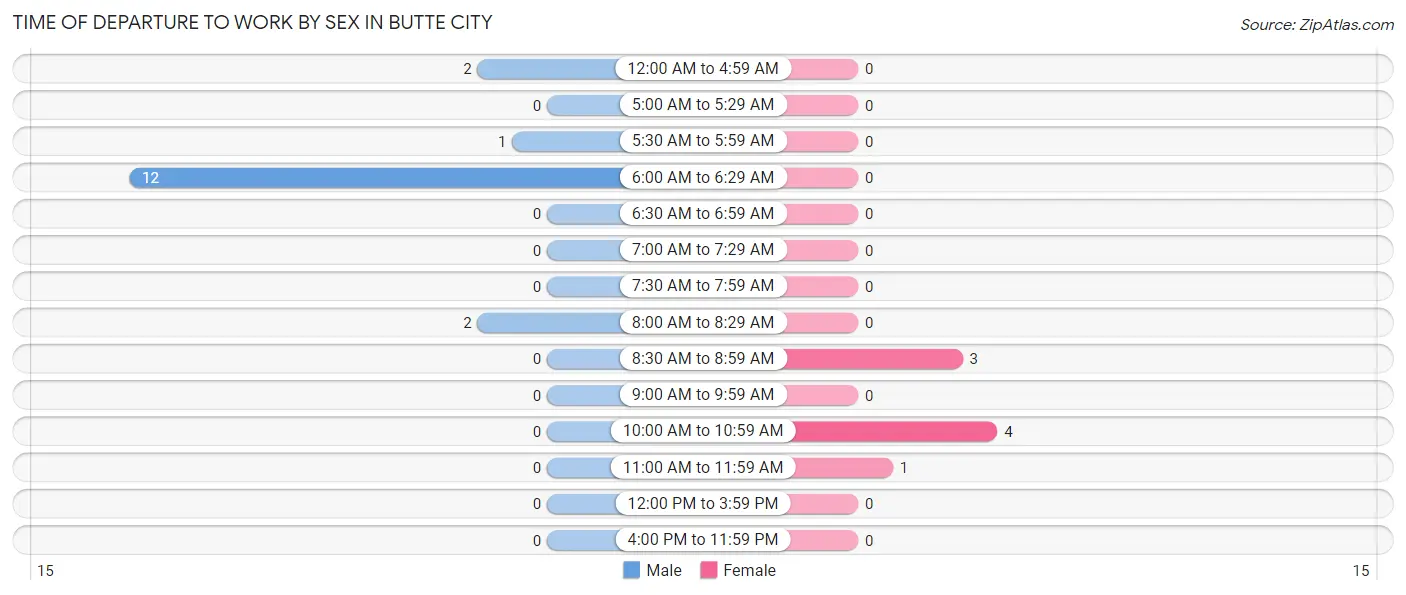
| Time of Departure | Male | Female |
| 12:00 AM to 4:59 AM | 2 (11.8%) | 0 (0.0%) |
| 5:00 AM to 5:29 AM | 0 (0.0%) | 0 (0.0%) |
| 5:30 AM to 5:59 AM | 1 (5.9%) | 0 (0.0%) |
| 6:00 AM to 6:29 AM | 12 (70.6%) | 0 (0.0%) |
| 6:30 AM to 6:59 AM | 0 (0.0%) | 0 (0.0%) |
| 7:00 AM to 7:29 AM | 0 (0.0%) | 0 (0.0%) |
| 7:30 AM to 7:59 AM | 0 (0.0%) | 0 (0.0%) |
| 8:00 AM to 8:29 AM | 2 (11.8%) | 0 (0.0%) |
| 8:30 AM to 8:59 AM | 0 (0.0%) | 3 (37.5%) |
| 9:00 AM to 9:59 AM | 0 (0.0%) | 0 (0.0%) |
| 10:00 AM to 10:59 AM | 0 (0.0%) | 4 (50.0%) |
| 11:00 AM to 11:59 AM | 0 (0.0%) | 1 (12.5%) |
| 12:00 PM to 3:59 PM | 0 (0.0%) | 0 (0.0%) |
| 4:00 PM to 11:59 PM | 0 (0.0%) | 0 (0.0%) |
| Total | 17 (100.0%) | 8 (100.0%) |
Housing Occupancy in Butte City
Occupancy by Ownership in Butte City
Of the total 55 dwellings in Butte City, owner-occupied units account for 35 (63.6%), while renter-occupied units make up 20 (36.4%).
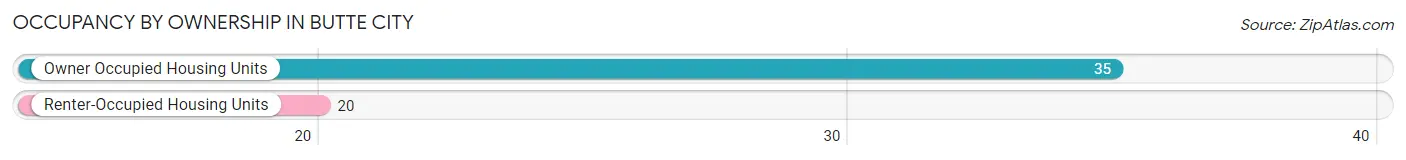
| Occupancy | # Housing Units | % Housing Units |
| Owner Occupied Housing Units | 35 | 63.6% |
| Renter-Occupied Housing Units | 20 | 36.4% |
| Total Occupied Housing Units | 55 | 100.0% |
Occupancy by Household Size in Butte City
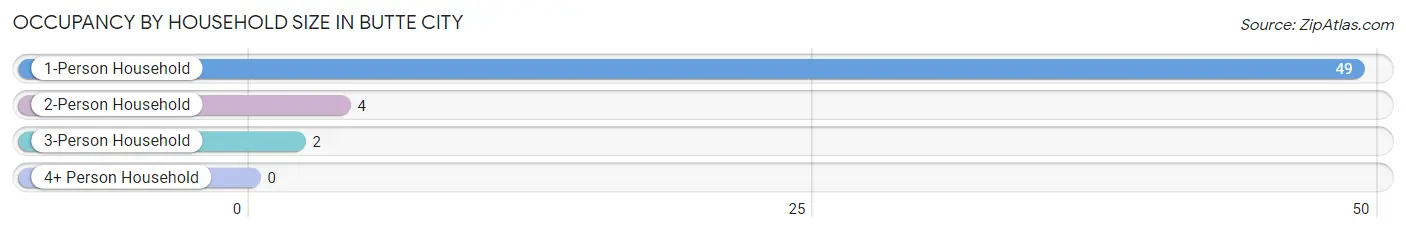
| Household Size | # Housing Units | % Housing Units |
| 1-Person Household | 49 | 89.1% |
| 2-Person Household | 4 | 7.3% |
| 3-Person Household | 2 | 3.6% |
| 4+ Person Household | 0 | 0.0% |
| Total Housing Units | 55 | 100.0% |
Occupancy by Ownership by Household Size in Butte City
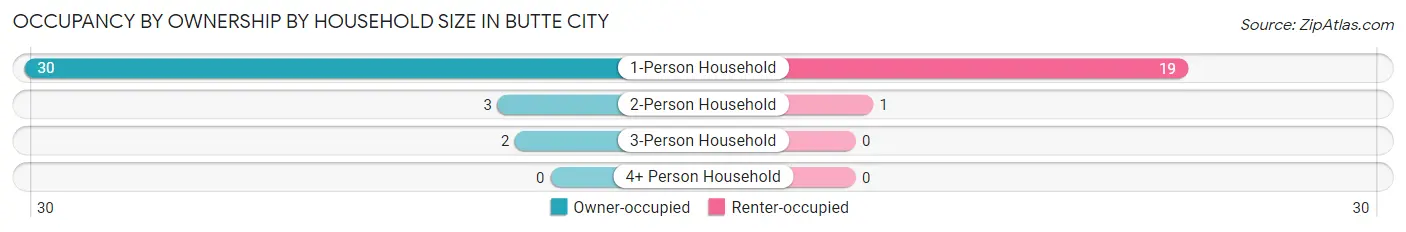
| Household Size | Owner-occupied | Renter-occupied |
| 1-Person Household | 30 (61.2%) | 19 (38.8%) |
| 2-Person Household | 3 (75.0%) | 1 (25.0%) |
| 3-Person Household | 2 (100.0%) | 0 (0.0%) |
| 4+ Person Household | 0 (0.0%) | 0 (0.0%) |
| Total Housing Units | 35 (63.6%) | 20 (36.4%) |
Occupancy by Educational Attainment in Butte City
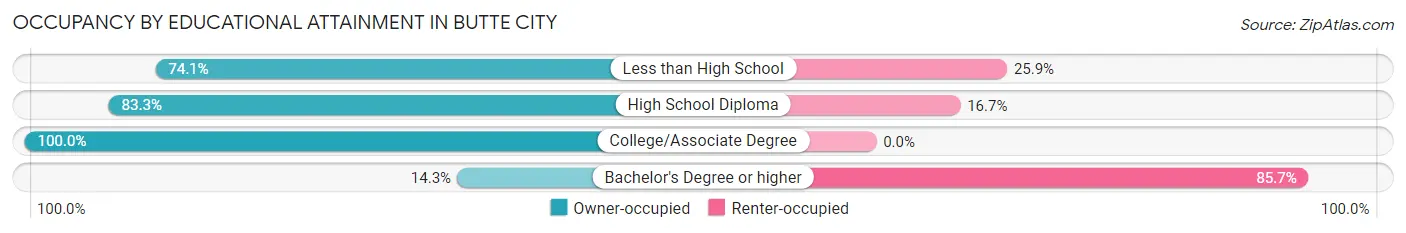
| Household Size | Owner-occupied | Renter-occupied |
| Less than High School | 20 (74.1%) | 7 (25.9%) |
| High School Diploma | 5 (83.3%) | 1 (16.7%) |
| College/Associate Degree | 8 (100.0%) | 0 (0.0%) |
| Bachelor's Degree or higher | 2 (14.3%) | 12 (85.7%) |
Occupancy by Age of Householder in Butte City
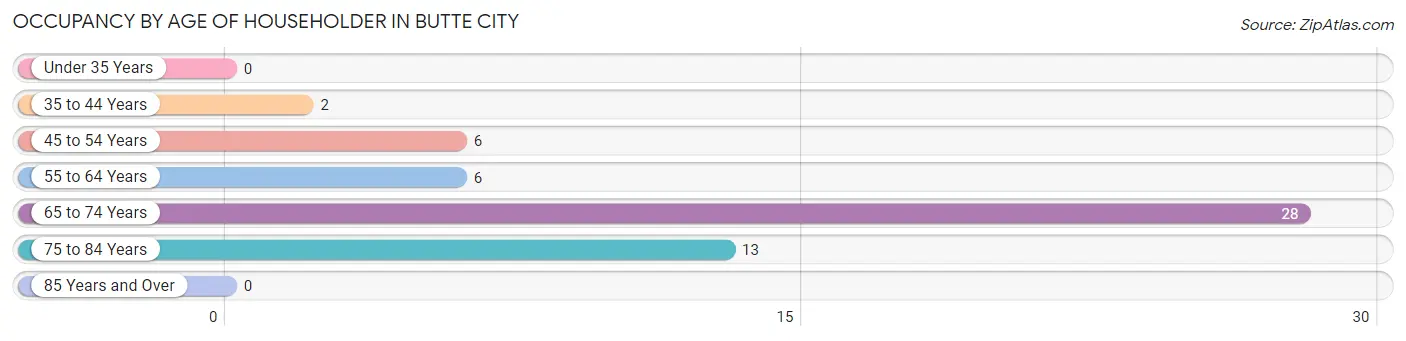
| Age Bracket | # Households | % Households |
| Under 35 Years | 0 | 0.0% |
| 35 to 44 Years | 2 | 3.6% |
| 45 to 54 Years | 6 | 10.9% |
| 55 to 64 Years | 6 | 10.9% |
| 65 to 74 Years | 28 | 50.9% |
| 75 to 84 Years | 13 | 23.6% |
| 85 Years and Over | 0 | 0.0% |
| Total | 55 | 100.0% |
Housing Finances in Butte City
Median Income by Occupancy in Butte City
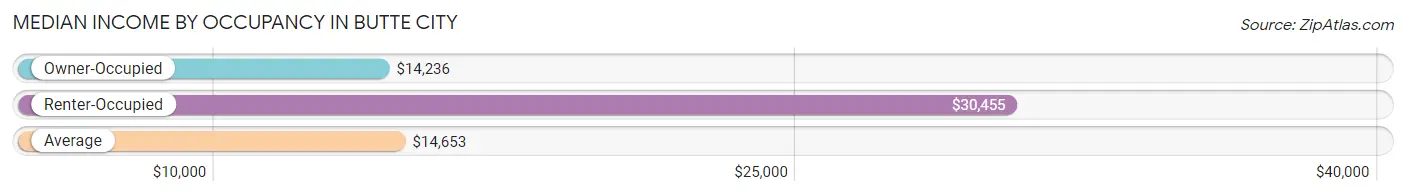
| Occupancy Type | # Households | Median Income |
| Owner-Occupied | 35 (63.6%) | $14,236 |
| Renter-Occupied | 20 (36.4%) | $30,455 |
| Average | 55 (100.0%) | $14,653 |
Occupancy by Householder Income Bracket in Butte City
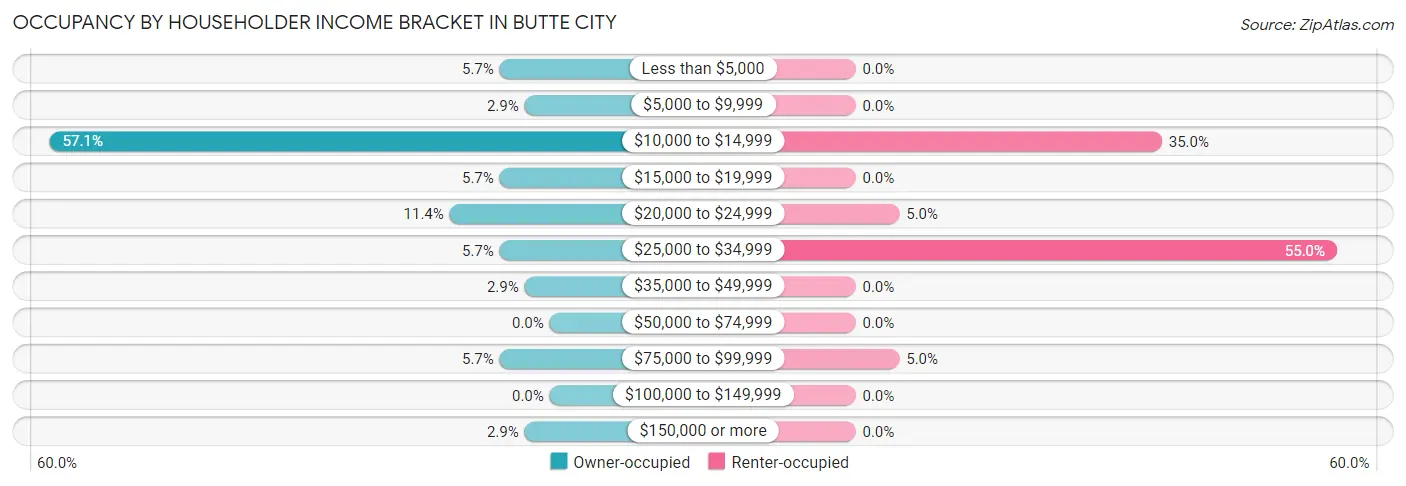
| Income Bracket | Owner-occupied | Renter-occupied |
| Less than $5,000 | 2 (5.7%) | 0 (0.0%) |
| $5,000 to $9,999 | 1 (2.9%) | 0 (0.0%) |
| $10,000 to $14,999 | 20 (57.1%) | 7 (35.0%) |
| $15,000 to $19,999 | 2 (5.7%) | 0 (0.0%) |
| $20,000 to $24,999 | 4 (11.4%) | 1 (5.0%) |
| $25,000 to $34,999 | 2 (5.7%) | 11 (55.0%) |
| $35,000 to $49,999 | 1 (2.9%) | 0 (0.0%) |
| $50,000 to $74,999 | 0 (0.0%) | 0 (0.0%) |
| $75,000 to $99,999 | 2 (5.7%) | 1 (5.0%) |
| $100,000 to $149,999 | 0 (0.0%) | 0 (0.0%) |
| $150,000 or more | 1 (2.9%) | 0 (0.0%) |
| Total | 35 (100.0%) | 20 (100.0%) |
Monthly Housing Cost Tiers in Butte City
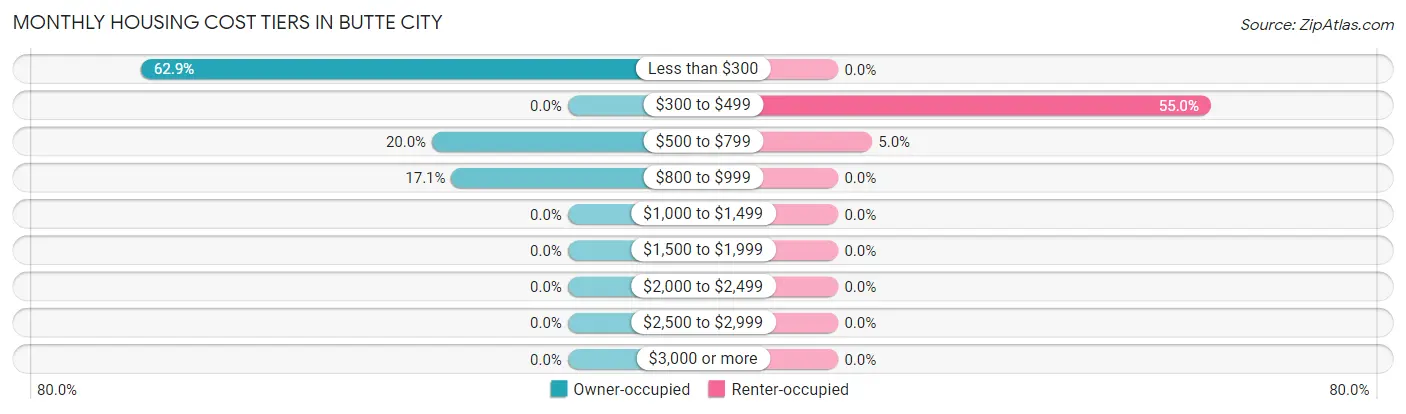
| Monthly Cost | Owner-occupied | Renter-occupied |
| Less than $300 | 22 (62.9%) | 0 (0.0%) |
| $300 to $499 | 0 (0.0%) | 11 (55.0%) |
| $500 to $799 | 7 (20.0%) | 1 (5.0%) |
| $800 to $999 | 6 (17.1%) | 0 (0.0%) |
| $1,000 to $1,499 | 0 (0.0%) | 0 (0.0%) |
| $1,500 to $1,999 | 0 (0.0%) | 0 (0.0%) |
| $2,000 to $2,499 | 0 (0.0%) | 0 (0.0%) |
| $2,500 to $2,999 | 0 (0.0%) | 0 (0.0%) |
| $3,000 or more | 0 (0.0%) | 0 (0.0%) |
| Total | 35 (100.0%) | 20 (100.0%) |
Physical Housing Characteristics in Butte City
Housing Structures in Butte City
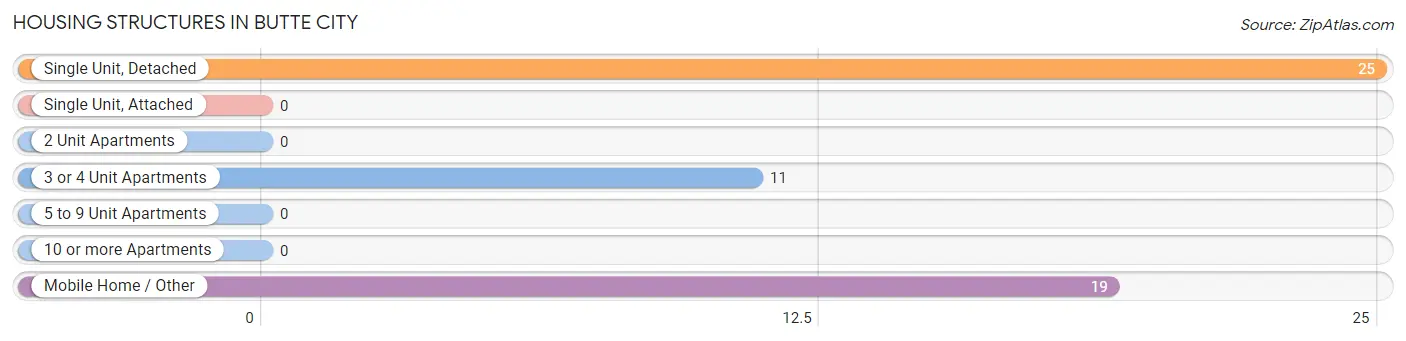
| Structure Type | # Housing Units | % Housing Units |
| Single Unit, Detached | 25 | 45.5% |
| Single Unit, Attached | 0 | 0.0% |
| 2 Unit Apartments | 0 | 0.0% |
| 3 or 4 Unit Apartments | 11 | 20.0% |
| 5 to 9 Unit Apartments | 0 | 0.0% |
| 10 or more Apartments | 0 | 0.0% |
| Mobile Home / Other | 19 | 34.5% |
| Total | 55 | 100.0% |
Housing Structures by Occupancy in Butte City
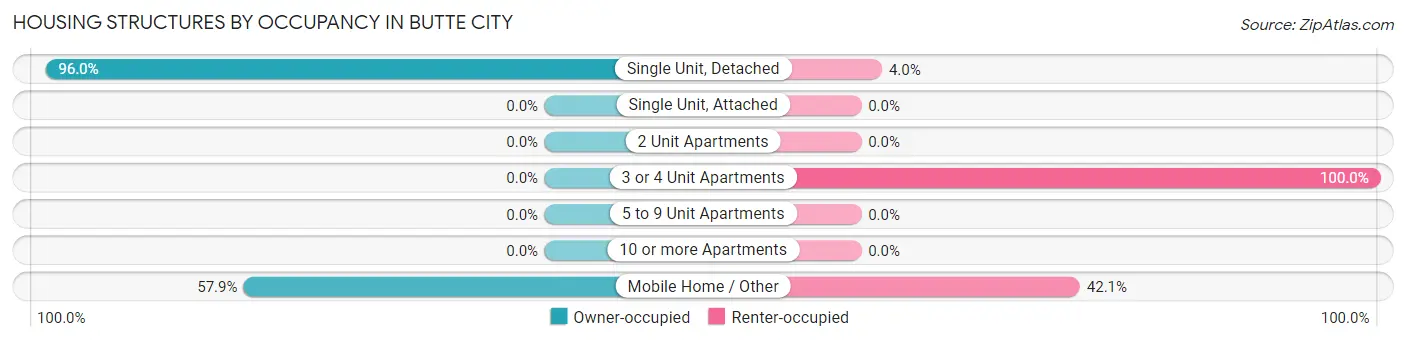
| Structure Type | Owner-occupied | Renter-occupied |
| Single Unit, Detached | 24 (96.0%) | 1 (4.0%) |
| Single Unit, Attached | 0 (0.0%) | 0 (0.0%) |
| 2 Unit Apartments | 0 (0.0%) | 0 (0.0%) |
| 3 or 4 Unit Apartments | 0 (0.0%) | 11 (100.0%) |
| 5 to 9 Unit Apartments | 0 (0.0%) | 0 (0.0%) |
| 10 or more Apartments | 0 (0.0%) | 0 (0.0%) |
| Mobile Home / Other | 11 (57.9%) | 8 (42.1%) |
| Total | 35 (63.6%) | 20 (36.4%) |
Housing Structures by Number of Rooms in Butte City
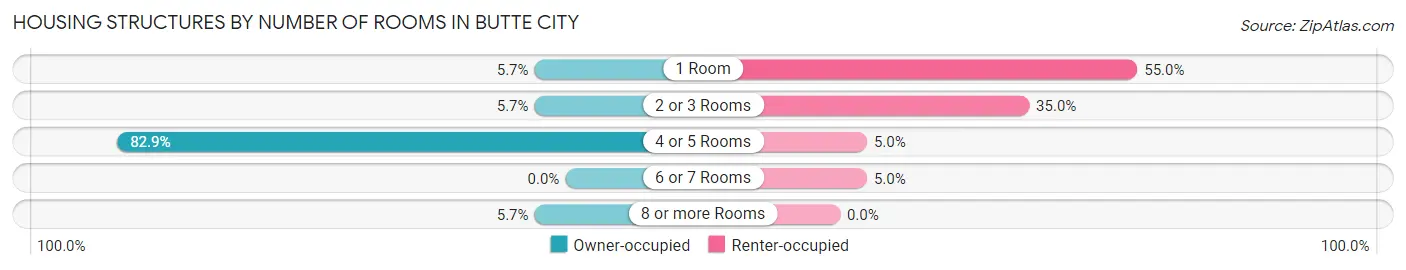
| Number of Rooms | Owner-occupied | Renter-occupied |
| 1 Room | 2 (5.7%) | 11 (55.0%) |
| 2 or 3 Rooms | 2 (5.7%) | 7 (35.0%) |
| 4 or 5 Rooms | 29 (82.9%) | 1 (5.0%) |
| 6 or 7 Rooms | 0 (0.0%) | 1 (5.0%) |
| 8 or more Rooms | 2 (5.7%) | 0 (0.0%) |
| Total | 35 (100.0%) | 20 (100.0%) |
Housing Structure by Heating Type in Butte City
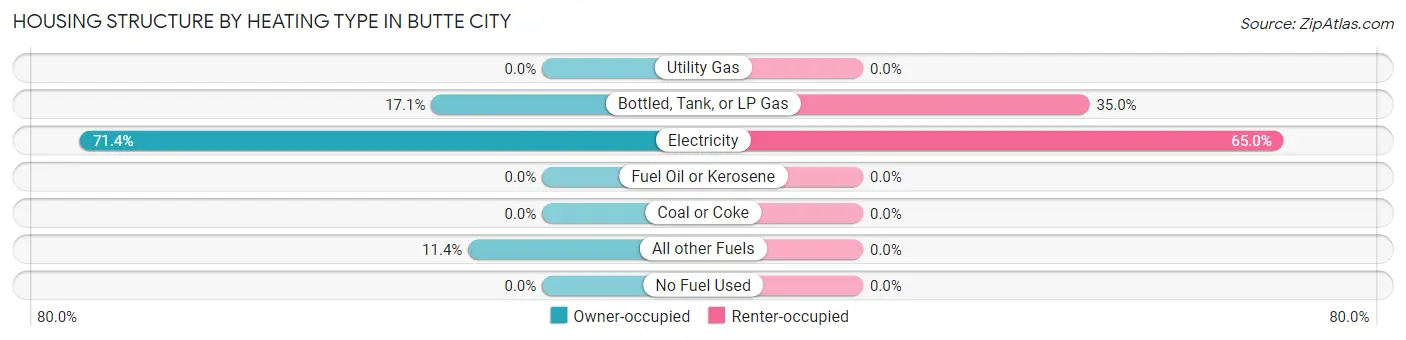
| Heating Type | Owner-occupied | Renter-occupied |
| Utility Gas | 0 (0.0%) | 0 (0.0%) |
| Bottled, Tank, or LP Gas | 6 (17.1%) | 7 (35.0%) |
| Electricity | 25 (71.4%) | 13 (65.0%) |
| Fuel Oil or Kerosene | 0 (0.0%) | 0 (0.0%) |
| Coal or Coke | 0 (0.0%) | 0 (0.0%) |
| All other Fuels | 4 (11.4%) | 0 (0.0%) |
| No Fuel Used | 0 (0.0%) | 0 (0.0%) |
| Total | 35 (100.0%) | 20 (100.0%) |
Household Vehicle Usage in Butte City
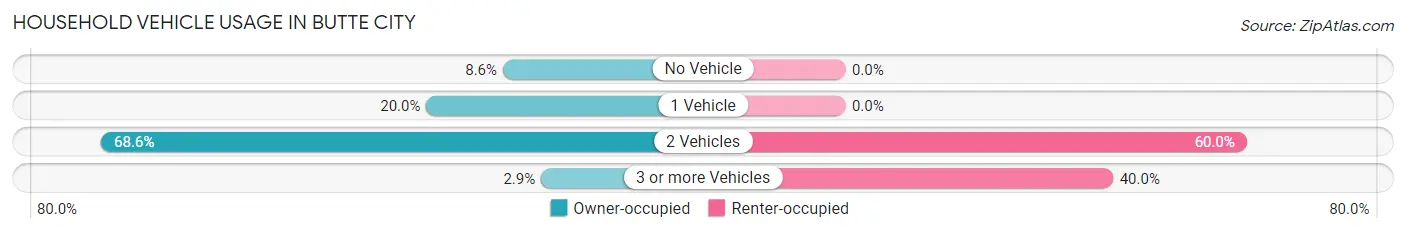
| Vehicles per Household | Owner-occupied | Renter-occupied |
| No Vehicle | 3 (8.6%) | 0 (0.0%) |
| 1 Vehicle | 7 (20.0%) | 0 (0.0%) |
| 2 Vehicles | 24 (68.6%) | 12 (60.0%) |
| 3 or more Vehicles | 1 (2.9%) | 8 (40.0%) |
| Total | 35 (100.0%) | 20 (100.0%) |
Real Estate & Mortgages in Butte City
Real Estate and Mortgage Overview in Butte City
| Characteristic | Without Mortgage | With Mortgage |
| Housing Units | 27 | 8 |
| Median Property Value | $74,100 | $125,000 |
| Median Household Income | $13,828 | $0 |
| Monthly Housing Costs | $230 | $0 |
| Real Estate Taxes | $347 | $0 |
Property Value by Mortgage Status in Butte City
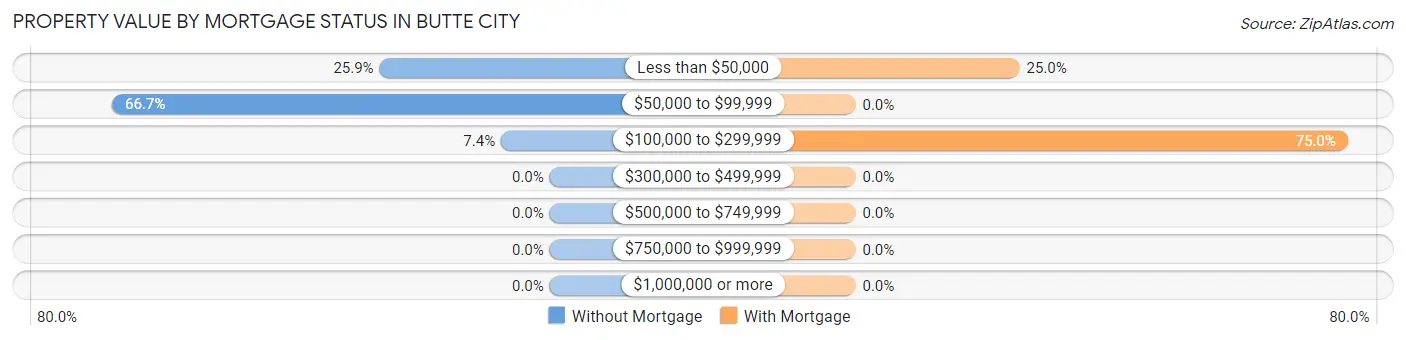
| Property Value | Without Mortgage | With Mortgage |
| Less than $50,000 | 7 (25.9%) | 2 (25.0%) |
| $50,000 to $99,999 | 18 (66.7%) | 0 (0.0%) |
| $100,000 to $299,999 | 2 (7.4%) | 6 (75.0%) |
| $300,000 to $499,999 | 0 (0.0%) | 0 (0.0%) |
| $500,000 to $749,999 | 0 (0.0%) | 0 (0.0%) |
| $750,000 to $999,999 | 0 (0.0%) | 0 (0.0%) |
| $1,000,000 or more | 0 (0.0%) | 0 (0.0%) |
| Total | 27 (100.0%) | 8 (100.0%) |
Household Income by Mortgage Status in Butte City
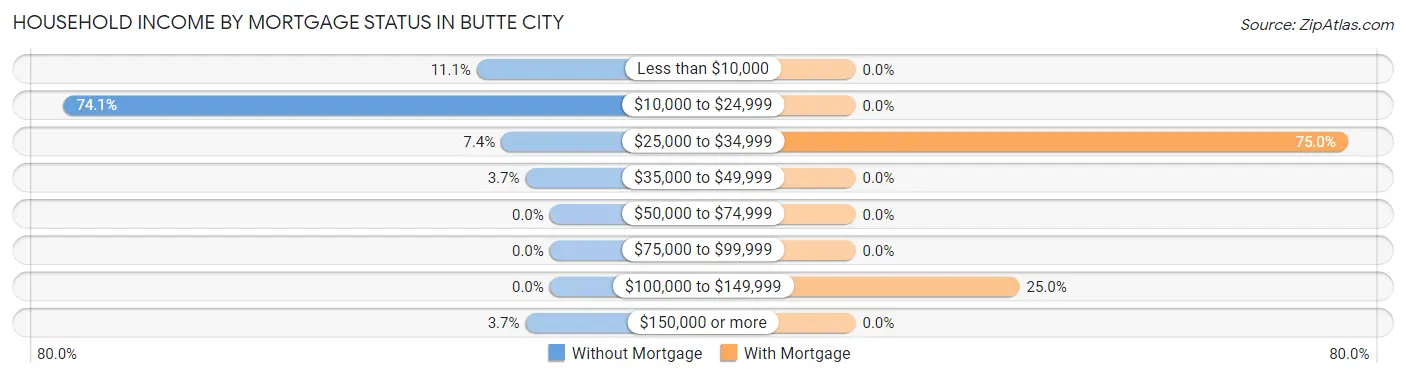
| Household Income | Without Mortgage | With Mortgage |
| Less than $10,000 | 3 (11.1%) | 0 (0.0%) |
| $10,000 to $24,999 | 20 (74.1%) | 0 (0.0%) |
| $25,000 to $34,999 | 2 (7.4%) | 6 (75.0%) |
| $35,000 to $49,999 | 1 (3.7%) | 0 (0.0%) |
| $50,000 to $74,999 | 0 (0.0%) | 0 (0.0%) |
| $75,000 to $99,999 | 0 (0.0%) | 0 (0.0%) |
| $100,000 to $149,999 | 0 (0.0%) | 2 (25.0%) |
| $150,000 or more | 1 (3.7%) | 0 (0.0%) |
| Total | 27 (100.0%) | 8 (100.0%) |
Property Value to Household Income Ratio in Butte City
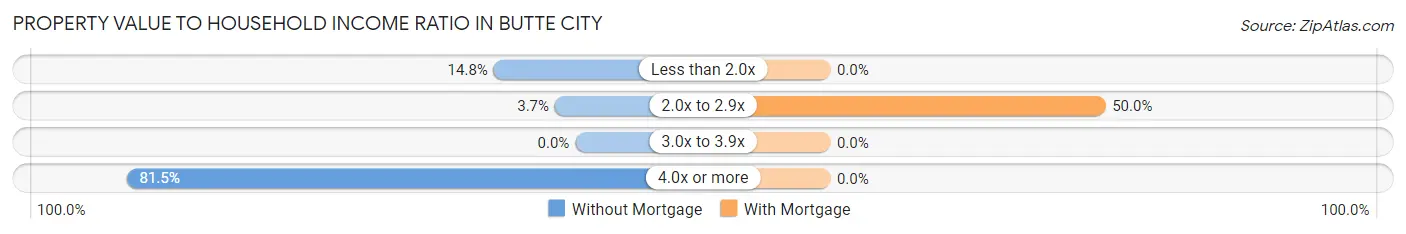
| Value-to-Income Ratio | Without Mortgage | With Mortgage |
| Less than 2.0x | 4 (14.8%) | 0 (0.0%) |
| 2.0x to 2.9x | 1 (3.7%) | 4 (50.0%) |
| 3.0x to 3.9x | 0 (0.0%) | 0 (0.0%) |
| 4.0x or more | 22 (81.5%) | 0 (0.0%) |
| Total | 27 (100.0%) | 8 (100.0%) |
Real Estate Taxes by Mortgage Status in Butte City
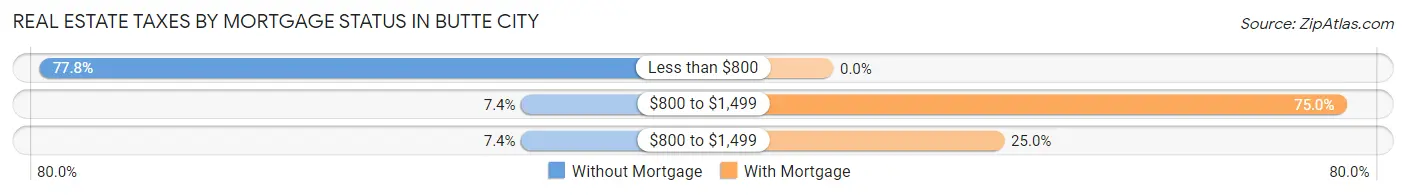
| Property Taxes | Without Mortgage | With Mortgage |
| Less than $800 | 21 (77.8%) | 0 (0.0%) |
| $800 to $1,499 | 2 (7.4%) | 6 (75.0%) |
| $800 to $1,499 | 2 (7.4%) | 2 (25.0%) |
| Total | 27 (100.0%) | 8 (100.0%) |
Health & Disability in Butte City
Health Insurance Coverage by Age in Butte City
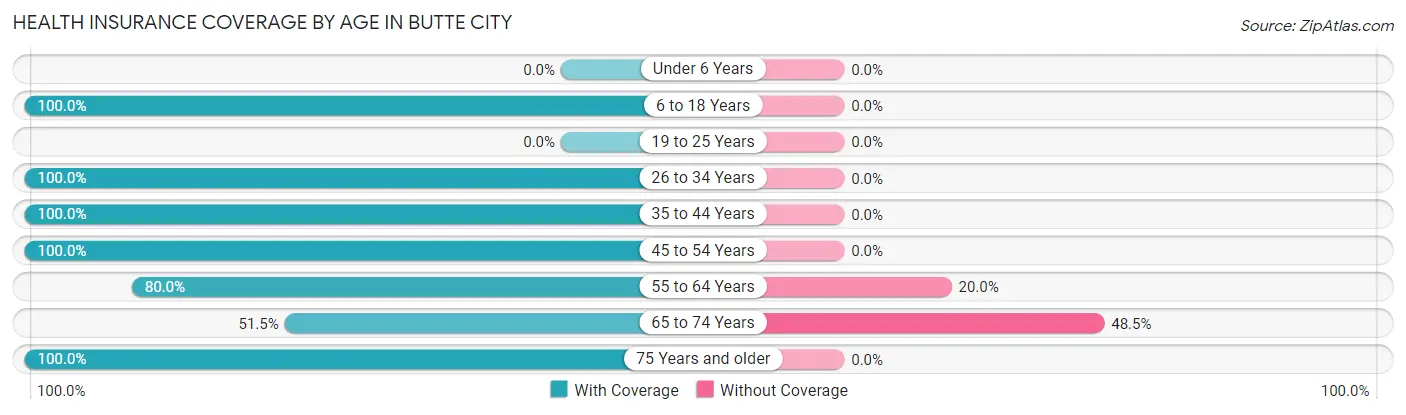
| Age Bracket | With Coverage | Without Coverage |
| Under 6 Years | 0 (0.0%) | 0 (0.0%) |
| 6 to 18 Years | 4 (100.0%) | 0 (0.0%) |
| 19 to 25 Years | 0 (0.0%) | 0 (0.0%) |
| 26 to 34 Years | 3 (100.0%) | 0 (0.0%) |
| 35 to 44 Years | 2 (100.0%) | 0 (0.0%) |
| 45 to 54 Years | 7 (100.0%) | 0 (0.0%) |
| 55 to 64 Years | 8 (80.0%) | 2 (20.0%) |
| 65 to 74 Years | 17 (51.5%) | 16 (48.5%) |
| 75 Years and older | 13 (100.0%) | 0 (0.0%) |
| Total | 54 (75.0%) | 18 (25.0%) |
Health Insurance Coverage by Citizenship Status in Butte City
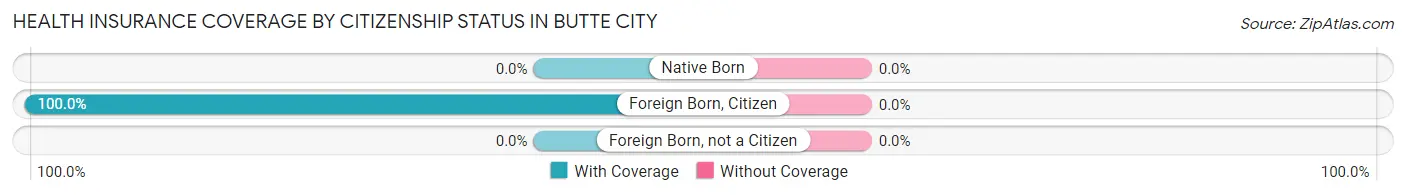
| Citizenship Status | With Coverage | Without Coverage |
| Native Born | 0 (0.0%) | 0 (0.0%) |
| Foreign Born, Citizen | 4 (100.0%) | 0 (0.0%) |
| Foreign Born, not a Citizen | 0 (0.0%) | 0 (0.0%) |
Health Insurance Coverage by Household Income in Butte City
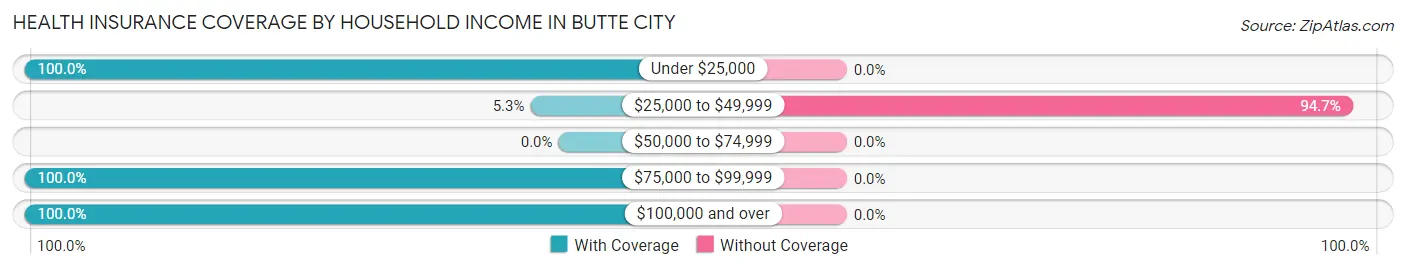
| Household Income | With Coverage | Without Coverage |
| Under $25,000 | 37 (100.0%) | 0 (0.0%) |
| $25,000 to $49,999 | 1 (5.3%) | 18 (94.7%) |
| $50,000 to $74,999 | 0 (0.0%) | 0 (0.0%) |
| $75,000 to $99,999 | 14 (100.0%) | 0 (0.0%) |
| $100,000 and over | 2 (100.0%) | 0 (0.0%) |
Public vs Private Health Insurance Coverage by Age in Butte City
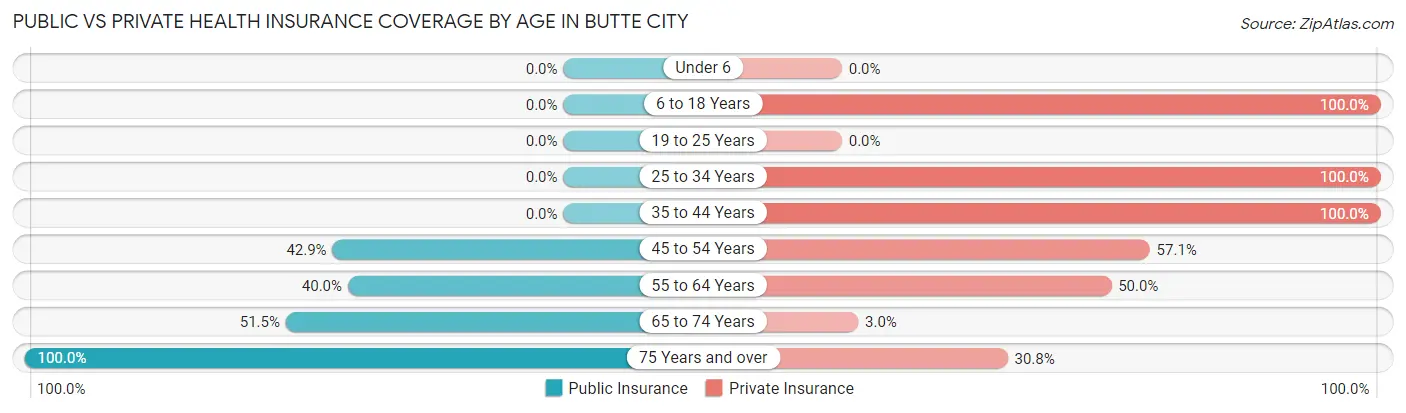
| Age Bracket | Public Insurance | Private Insurance |
| Under 6 | 0 (0.0%) | 0 (0.0%) |
| 6 to 18 Years | 0 (0.0%) | 4 (100.0%) |
| 19 to 25 Years | 0 (0.0%) | 0 (0.0%) |
| 25 to 34 Years | 0 (0.0%) | 3 (100.0%) |
| 35 to 44 Years | 0 (0.0%) | 2 (100.0%) |
| 45 to 54 Years | 3 (42.9%) | 4 (57.1%) |
| 55 to 64 Years | 4 (40.0%) | 5 (50.0%) |
| 65 to 74 Years | 17 (51.5%) | 1 (3.0%) |
| 75 Years and over | 13 (100.0%) | 4 (30.8%) |
| Total | 37 (51.4%) | 23 (31.9%) |
Disability Status by Sex by Age in Butte City
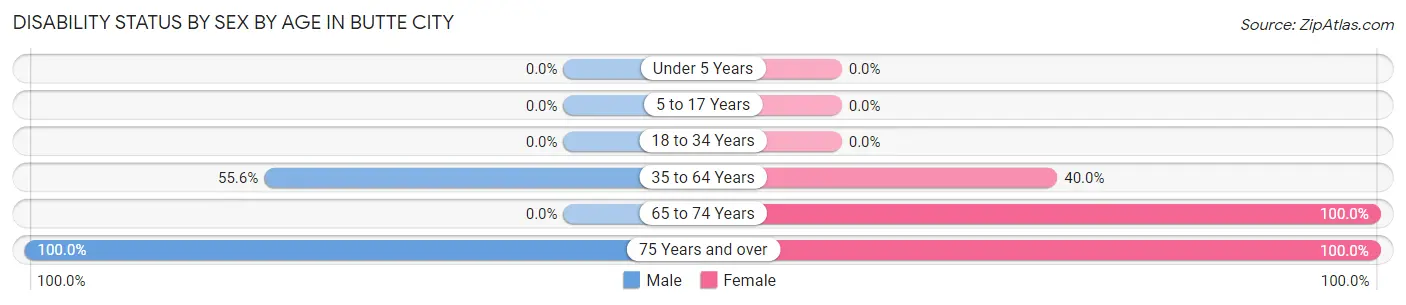
| Age Bracket | Male | Female |
| Under 5 Years | 0 (0.0%) | 0 (0.0%) |
| 5 to 17 Years | 0 (0.0%) | 0 (0.0%) |
| 18 to 34 Years | 0 (0.0%) | 0 (0.0%) |
| 35 to 64 Years | 5 (55.6%) | 4 (40.0%) |
| 65 to 74 Years | 0 (0.0%) | 16 (100.0%) |
| 75 Years and over | 11 (100.0%) | 2 (100.0%) |
Disability Class by Sex by Age in Butte City
Disability Class: Hearing Difficulty
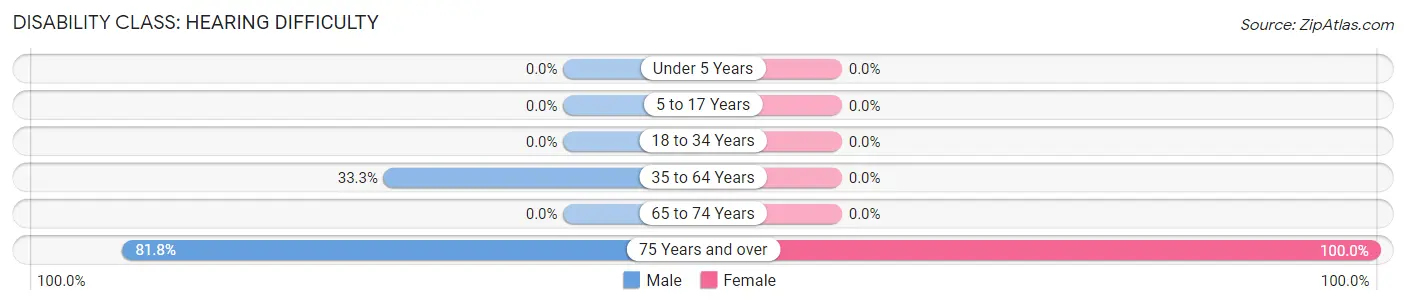
| Age Bracket | Male | Female |
| Under 5 Years | 0 (0.0%) | 0 (0.0%) |
| 5 to 17 Years | 0 (0.0%) | 0 (0.0%) |
| 18 to 34 Years | 0 (0.0%) | 0 (0.0%) |
| 35 to 64 Years | 3 (33.3%) | 0 (0.0%) |
| 65 to 74 Years | 0 (0.0%) | 0 (0.0%) |
| 75 Years and over | 9 (81.8%) | 2 (100.0%) |
Disability Class: Vision Difficulty
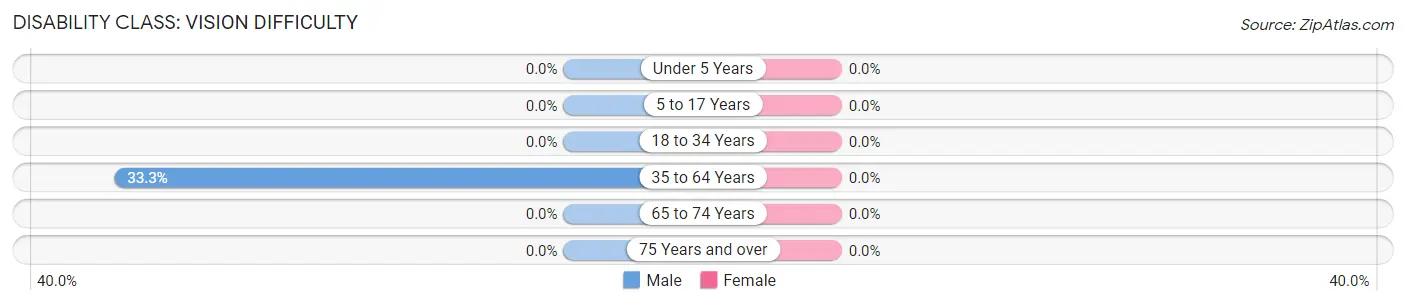
| Age Bracket | Male | Female |
| Under 5 Years | 0 (0.0%) | 0 (0.0%) |
| 5 to 17 Years | 0 (0.0%) | 0 (0.0%) |
| 18 to 34 Years | 0 (0.0%) | 0 (0.0%) |
| 35 to 64 Years | 3 (33.3%) | 0 (0.0%) |
| 65 to 74 Years | 0 (0.0%) | 0 (0.0%) |
| 75 Years and over | 0 (0.0%) | 0 (0.0%) |
Disability Class: Cognitive Difficulty

| Age Bracket | Male | Female |
| 5 to 17 Years | 0 (0.0%) | 0 (0.0%) |
| 18 to 34 Years | 0 (0.0%) | 0 (0.0%) |
| 35 to 64 Years | 2 (22.2%) | 0 (0.0%) |
| 65 to 74 Years | 0 (0.0%) | 0 (0.0%) |
| 75 Years and over | 2 (18.2%) | 0 (0.0%) |
Disability Class: Ambulatory Difficulty
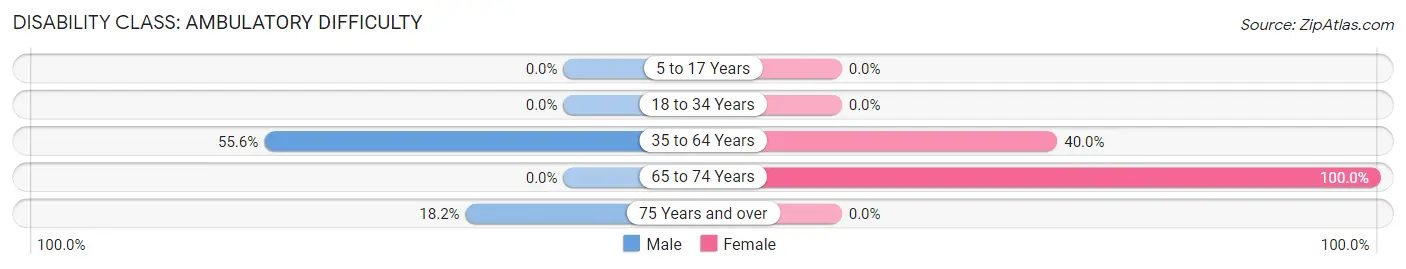
| Age Bracket | Male | Female |
| 5 to 17 Years | 0 (0.0%) | 0 (0.0%) |
| 18 to 34 Years | 0 (0.0%) | 0 (0.0%) |
| 35 to 64 Years | 5 (55.6%) | 4 (40.0%) |
| 65 to 74 Years | 0 (0.0%) | 16 (100.0%) |
| 75 Years and over | 2 (18.2%) | 0 (0.0%) |
Disability Class: Self-Care Difficulty
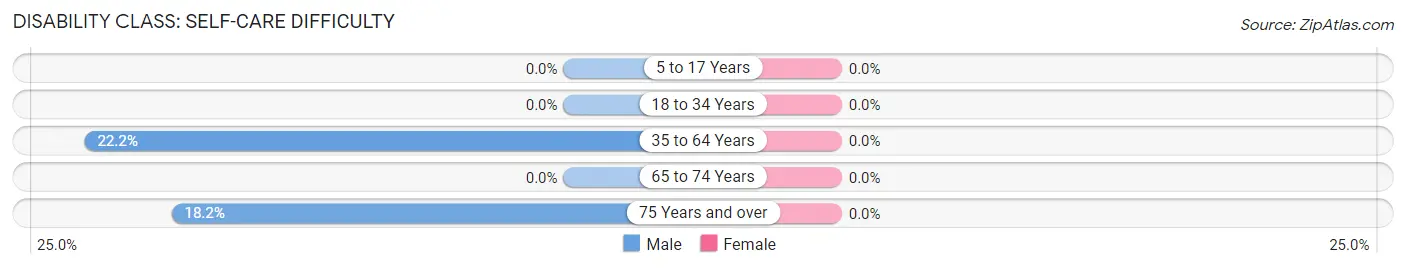
| Age Bracket | Male | Female |
| 5 to 17 Years | 0 (0.0%) | 0 (0.0%) |
| 18 to 34 Years | 0 (0.0%) | 0 (0.0%) |
| 35 to 64 Years | 2 (22.2%) | 0 (0.0%) |
| 65 to 74 Years | 0 (0.0%) | 0 (0.0%) |
| 75 Years and over | 2 (18.2%) | 0 (0.0%) |
Technology Access in Butte City
Computing Device Access in Butte City
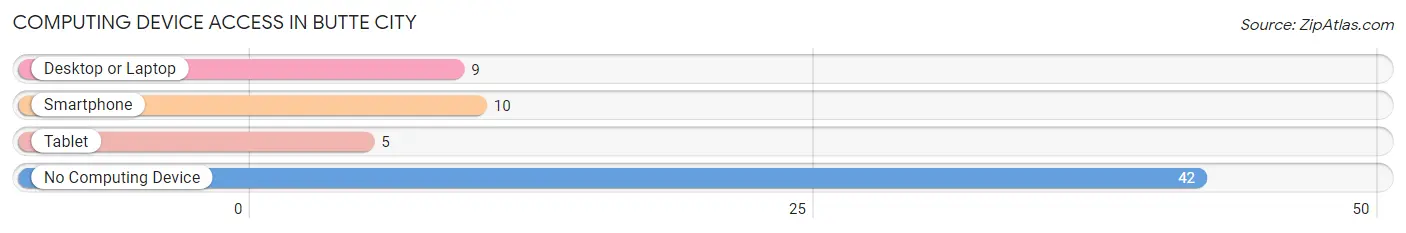
| Device Type | # Households | % Households |
| Desktop or Laptop | 9 | 16.4% |
| Smartphone | 10 | 18.2% |
| Tablet | 5 | 9.1% |
| No Computing Device | 42 | 76.4% |
| Total | 55 | 100.0% |
Internet Access in Butte City
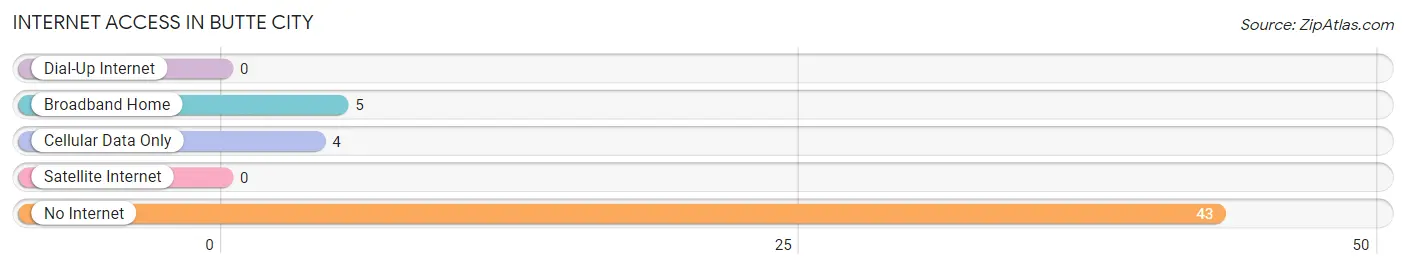
| Internet Type | # Households | % Households |
| Dial-Up Internet | 0 | 0.0% |
| Broadband Home | 5 | 9.1% |
| Cellular Data Only | 4 | 7.3% |
| Satellite Internet | 0 | 0.0% |
| No Internet | 43 | 78.2% |
| Total | 55 | 100.0% |
Butte City Summary
Butte City is a small city located in the southeastern corner of Idaho, in the United States. It is situated in the Snake River Plain, a region of the Great Basin Desert. The city is located in the county of Butte, and is the county seat. The population of Butte City was estimated to be 1,845 in 2019.
History
Butte City was founded in 1883 by a group of settlers from Utah. The city was named after the nearby Butte Creek, which was named after the nearby Butte Mountains. The city was originally a farming community, and the settlers grew wheat, barley, and potatoes. The city was incorporated in 1887.
In the early 1900s, the city began to grow and develop. The railroad arrived in 1906, and the city became a major shipping center for the region. The city also became a center for mining, as copper, lead, and zinc were discovered in the area. The city also became a center for the timber industry, as the nearby forests were logged for lumber.
In the 1950s, the city began to decline as the mining and timber industries declined. The city was also affected by the Great Depression, and many of the businesses in the city closed. The city was revitalized in the 1970s, when the nearby Grand Teton National Park was established. The city became a popular tourist destination, and the economy began to improve.
Geography
Butte City is located in the southeastern corner of Idaho, in the Snake River Plain. The city is situated at an elevation of 4,890 feet above sea level. The city is located in the county of Butte, and is the county seat. The city is surrounded by the Butte Mountains to the north, the Snake River to the east, and the Grand Teton National Park to the south.
The climate in Butte City is semi-arid, with hot summers and cold winters. The average annual temperature is 44°F, and the average annual precipitation is 11.5 inches.
Economy
The economy of Butte City is largely based on tourism. The city is a popular destination for visitors to the Grand Teton National Park, and the nearby forests and mountains provide opportunities for outdoor recreation. The city is also home to several businesses, including restaurants, hotels, and retail stores.
The city is also home to several manufacturing companies, including a furniture factory and a metal fabrication plant. The city is also home to several agricultural operations, including cattle ranches and farms.
Demographics
As of 2019, the population of Butte City was estimated to be 1,845. The population is predominantly white, with a small Hispanic population. The median household income is $45,000, and the median home value is $150,000. The city has a low unemployment rate, and the poverty rate is below the national average.
Conclusion
Butte City is a small city located in the southeastern corner of Idaho. The city was founded in 1883, and was originally a farming community. The city has since become a popular tourist destination, and the economy is largely based on tourism. The population of Butte City is predominantly white, with a small Hispanic population. The median household income is $45,000, and the median home value is $150,000. The city has a low unemployment rate, and the poverty rate is below the national average.
Common Questions
What is Per Capita Income in Butte City?
Per Capita income in Butte City is $22,578.
What is the Median Household income in Butte City?
Median Household Income in Butte City is $14,653.
What is Income or Wage Gap in Butte City?
Income or Wage Gap in Butte City is 32.5%.
Women in Butte City earn 67.5 cents for every dollar earned by a man.
What is Inequality or Gini Index in Butte City?
Inequality or Gini Index in Butte City is 0.42.
What is the Total Population of Butte City?
Total Population of Butte City is 72.
What is the Total Male Population of Butte City?
Total Male Population of Butte City is 37.
What is the Total Female Population of Butte City?
Total Female Population of Butte City is 35.
What is the Ratio of Males per 100 Females in Butte City?
There are 105.71 Males per 100 Females in Butte City.
What is the Ratio of Females per 100 Males in Butte City?
There are 94.59 Females per 100 Males in Butte City.
What is the Median Population Age in Butte City?
Median Population Age in Butte City is 72.1 Years.
What is the Average Family Size in Butte City
Average Family Size in Butte City is 4.5 People.
What is the Average Household Size in Butte City
Average Household Size in Butte City is 1.3 People.
How Large is the Labor Force in Butte City?
There are 30 People in the Labor Forcein in Butte City.
What is the Percentage of People in the Labor Force in Butte City?
44.1% of People are in the Labor Force in Butte City.
What is the Unemployment Rate in Butte City?
Unemployment Rate in Butte City is 10.0%.