Zip Codes with the Highest Percentage of Population Employed in Architecture & Engineering in Idaho
RELATED REPORTS & OPTIONS
Architecture & Engineering
Idaho
Compare Zip Codes
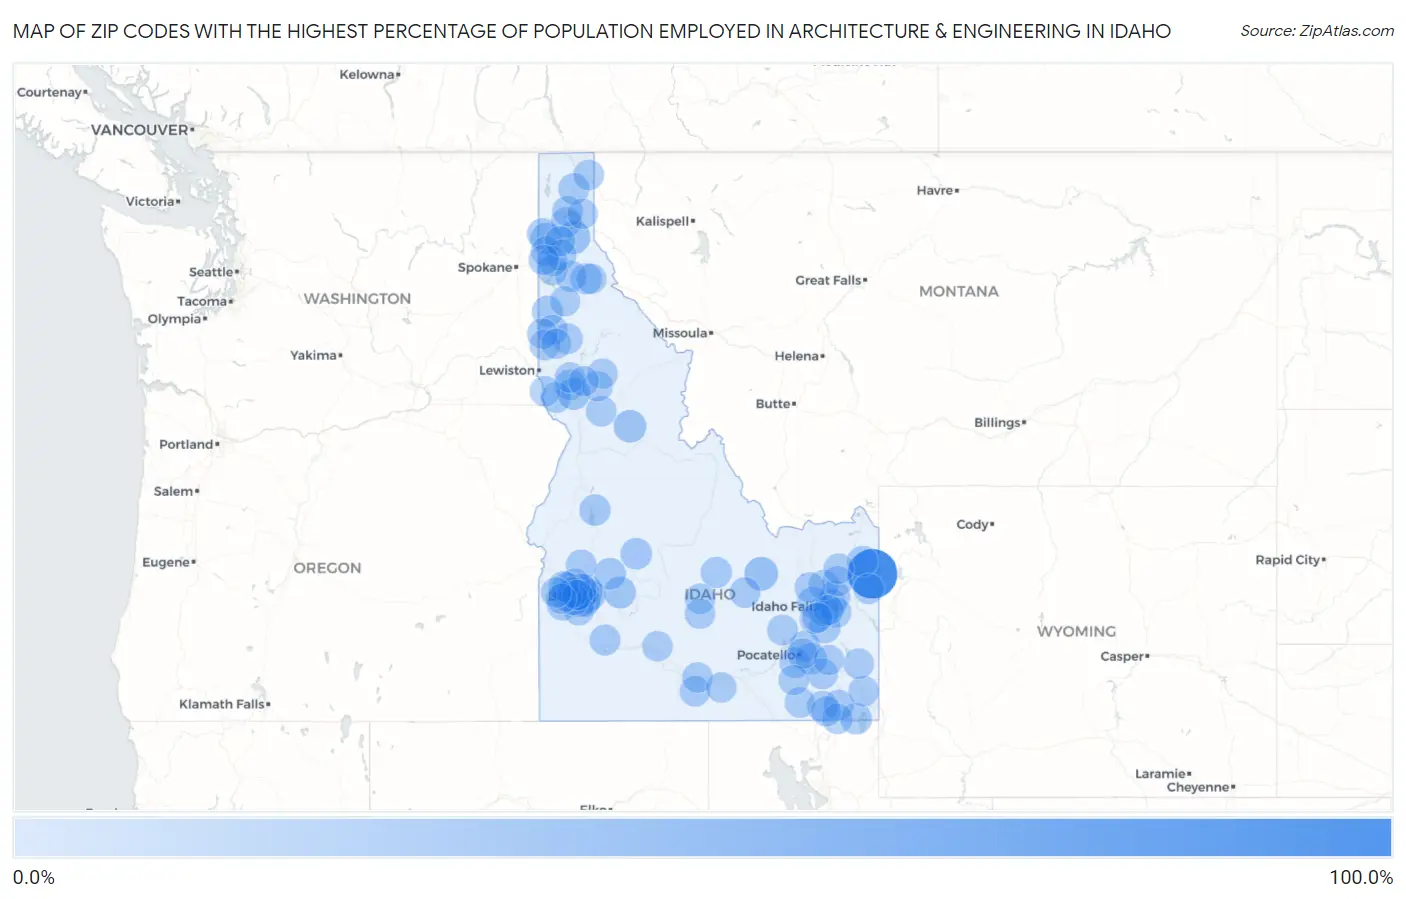
Map of Zip Codes with the Highest Percentage of Population Employed in Architecture & Engineering in Idaho
0.0%
100.0%
Zip Codes with the Highest Percentage of Population Employed in Architecture & Engineering in Idaho
| Zip Code | % Employed | vs State | vs National | |
| 1. | 83424 | 100.0% | 2.2%(+97.8)#1 | 2.1%(+97.9)#2 |
| 2. | 83244 | 18.0% | 2.2%(+15.8)#2 | 2.1%(+15.8)#112 |
| 3. | 83803 | 15.3% | 2.2%(+13.1)#3 | 2.1%(+13.1)#142 |
| 4. | 83525 | 12.2% | 2.2%(+10.0)#4 | 2.1%(+10.0)#231 |
| 5. | 83526 | 10.6% | 2.2%(+8.38)#5 | 2.1%(+8.41)#309 |
| 6. | 83716 | 8.7% | 2.2%(+6.51)#6 | 2.1%(+6.54)#466 |
| 7. | 83631 | 7.6% | 2.2%(+5.46)#7 | 2.1%(+5.49)#632 |
| 8. | 83287 | 7.0% | 2.2%(+4.84)#8 | 2.1%(+4.87)#748 |
| 9. | 83637 | 6.9% | 2.2%(+4.72)#9 | 2.1%(+4.75)#776 |
| 10. | 83869 | 6.8% | 2.2%(+4.59)#10 | 2.1%(+4.61)#808 |
| 11. | 83236 | 6.2% | 2.2%(+4.01)#11 | 2.1%(+4.04)#1,007 |
| 12. | 83706 | 6.1% | 2.2%(+3.90)#12 | 2.1%(+3.93)#1,048 |
| 13. | 83868 | 5.6% | 2.2%(+3.45)#13 | 2.1%(+3.48)#1,262 |
| 14. | 83615 | 5.6% | 2.2%(+3.40)#14 | 2.1%(+3.43)#1,292 |
| 15. | 83870 | 5.6% | 2.2%(+3.38)#15 | 2.1%(+3.41)#1,303 |
| 16. | 83245 | 5.3% | 2.2%(+3.10)#16 | 2.1%(+3.13)#1,466 |
| 17. | 83810 | 4.8% | 2.2%(+2.58)#17 | 2.1%(+2.61)#1,869 |
| 18. | 83251 | 4.8% | 2.2%(+2.57)#18 | 2.1%(+2.60)#1,880 |
| 19. | 83712 | 4.4% | 2.2%(+2.22)#19 | 2.1%(+2.25)#2,257 |
| 20. | 83847 | 4.3% | 2.2%(+2.17)#20 | 2.1%(+2.20)#2,319 |
| 21. | 83804 | 4.3% | 2.2%(+2.08)#21 | 2.1%(+2.11)#2,418 |
| 22. | 83246 | 4.0% | 2.2%(+1.86)#22 | 2.1%(+1.89)#2,712 |
| 23. | 83709 | 4.0% | 2.2%(+1.86)#23 | 2.1%(+1.89)#2,721 |
| 24. | 83402 | 3.9% | 2.2%(+1.72)#24 | 2.1%(+1.75)#2,941 |
| 25. | 83648 | 3.8% | 2.2%(+1.66)#25 | 2.1%(+1.69)#3,027 |
| 26. | 83702 | 3.8% | 2.2%(+1.57)#26 | 2.1%(+1.60)#3,197 |
| 27. | 83202 | 3.7% | 2.2%(+1.57)#27 | 2.1%(+1.59)#3,212 |
| 28. | 83523 | 3.7% | 2.2%(+1.56)#28 | 2.1%(+1.59)#3,225 |
| 29. | 83420 | 3.6% | 2.2%(+1.45)#29 | 2.1%(+1.48)#3,445 |
| 30. | 83204 | 3.6% | 2.2%(+1.43)#30 | 2.1%(+1.46)#3,488 |
| 31. | 83228 | 3.5% | 2.2%(+1.28)#31 | 2.1%(+1.31)#3,830 |
| 32. | 83686 | 3.2% | 2.2%(+1.06)#32 | 2.1%(+1.09)#4,370 |
| 33. | 83823 | 3.2% | 2.2%(+0.994)#33 | 2.1%(+1.02)#4,536 |
| 34. | 83703 | 3.1% | 2.2%(+0.946)#34 | 2.1%(+0.976)#4,675 |
| 35. | 83860 | 3.1% | 2.2%(+0.936)#35 | 2.1%(+0.965)#4,707 |
| 36. | 83670 | 3.1% | 2.2%(+0.929)#36 | 2.1%(+0.958)#4,718 |
| 37. | 83262 | 3.1% | 2.2%(+0.898)#37 | 2.1%(+0.928)#4,799 |
| 38. | 83704 | 3.0% | 2.2%(+0.841)#38 | 2.1%(+0.871)#4,984 |
| 39. | 83213 | 3.0% | 2.2%(+0.840)#39 | 2.1%(+0.870)#4,992 |
| 40. | 83705 | 3.0% | 2.2%(+0.777)#40 | 2.1%(+0.807)#5,214 |
| 41. | 83263 | 2.9% | 2.2%(+0.706)#41 | 2.1%(+0.735)#5,471 |
| 42. | 83218 | 2.8% | 2.2%(+0.638)#42 | 2.1%(+0.668)#5,726 |
| 43. | 83840 | 2.7% | 2.2%(+0.561)#43 | 2.1%(+0.591)#6,004 |
| 44. | 83616 | 2.7% | 2.2%(+0.481)#44 | 2.1%(+0.510)#6,332 |
| 45. | 83714 | 2.6% | 2.2%(+0.450)#45 | 2.1%(+0.479)#6,452 |
| 46. | 83857 | 2.6% | 2.2%(+0.439)#46 | 2.1%(+0.469)#6,498 |
| 47. | 83843 | 2.5% | 2.2%(+0.366)#47 | 2.1%(+0.395)#6,818 |
| 48. | 83634 | 2.5% | 2.2%(+0.317)#48 | 2.1%(+0.347)#7,010 |
| 49. | 83404 | 2.5% | 2.2%(+0.309)#49 | 2.1%(+0.338)#7,057 |
| 50. | 83442 | 2.5% | 2.2%(+0.290)#50 | 2.1%(+0.319)#7,142 |
| 51. | 83201 | 2.4% | 2.2%(+0.258)#51 | 2.1%(+0.287)#7,301 |
| 52. | 83835 | 2.4% | 2.2%(+0.247)#52 | 2.1%(+0.276)#7,352 |
| 53. | 83669 | 2.4% | 2.2%(+0.213)#53 | 2.1%(+0.242)#7,508 |
| 54. | 83872 | 2.4% | 2.2%(+0.209)#54 | 2.1%(+0.238)#7,532 |
| 55. | 83642 | 2.4% | 2.2%(+0.200)#55 | 2.1%(+0.230)#7,574 |
| 56. | 83334 | 2.4% | 2.2%(+0.189)#56 | 2.1%(+0.218)#7,631 |
| 57. | 83254 | 2.4% | 2.2%(+0.178)#57 | 2.1%(+0.208)#7,688 |
| 58. | 83422 | 2.3% | 2.2%(+0.161)#58 | 2.1%(+0.191)#7,761 |
| 59. | 83687 | 2.3% | 2.2%(+0.160)#59 | 2.1%(+0.189)#7,768 |
| 60. | 83845 | 2.3% | 2.2%(+0.151)#60 | 2.1%(+0.180)#7,802 |
| 61. | 83530 | 2.2% | 2.2%(+0.071)#61 | 2.1%(+0.100)#8,206 |
| 62. | 83646 | 2.2% | 2.2%(+0.066)#62 | 2.1%(+0.095)#8,225 |
| 63. | 83333 | 2.2% | 2.2%(+0.038)#63 | 2.1%(+0.067)#8,399 |
| 64. | 83555 | 2.2% | 2.2%(+0.011)#64 | 2.1%(+0.041)#8,528 |
| 65. | 83814 | 2.2% | 2.2%(+0.003)#65 | 2.1%(+0.033)#8,585 |
| 66. | 83325 | 2.2% | 2.2%(-0.012)#66 | 2.1%(+0.018)#8,672 |
| 67. | 83858 | 2.0% | 2.2%(-0.138)#67 | 2.1%(-0.109)#9,372 |
| 68. | 83548 | 2.0% | 2.2%(-0.179)#68 | 2.1%(-0.149)#9,609 |
| 69. | 83401 | 2.0% | 2.2%(-0.220)#69 | 2.1%(-0.190)#9,861 |
| 70. | 83237 | 1.9% | 2.2%(-0.286)#70 | 2.1%(-0.257)#10,296 |
| 71. | 83427 | 1.9% | 2.2%(-0.301)#71 | 2.1%(-0.271)#10,379 |
| 72. | 83644 | 1.9% | 2.2%(-0.302)#72 | 2.1%(-0.272)#10,388 |
| 73. | 83217 | 1.8% | 2.2%(-0.389)#73 | 2.1%(-0.360)#10,884 |
| 74. | 83815 | 1.8% | 2.2%(-0.394)#74 | 2.1%(-0.364)#10,912 |
| 75. | 83252 | 1.8% | 2.2%(-0.401)#75 | 2.1%(-0.372)#10,964 |
| 76. | 83536 | 1.8% | 2.2%(-0.408)#76 | 2.1%(-0.379)#11,002 |
| 77. | 83434 | 1.8% | 2.2%(-0.422)#77 | 2.1%(-0.392)#11,090 |
| 78. | 83440 | 1.7% | 2.2%(-0.438)#78 | 2.1%(-0.409)#11,236 |
| 79. | 83276 | 1.7% | 2.2%(-0.441)#79 | 2.1%(-0.412)#11,250 |
| 80. | 83713 | 1.7% | 2.2%(-0.455)#80 | 2.1%(-0.426)#11,339 |
| 81. | 83444 | 1.7% | 2.2%(-0.466)#81 | 2.1%(-0.437)#11,406 |
| 82. | 83651 | 1.7% | 2.2%(-0.478)#82 | 2.1%(-0.448)#11,485 |
| 83. | 83801 | 1.7% | 2.2%(-0.487)#83 | 2.1%(-0.458)#11,554 |
| 84. | 83406 | 1.7% | 2.2%(-0.517)#84 | 2.1%(-0.488)#11,761 |
| 85. | 83232 | 1.7% | 2.2%(-0.519)#85 | 2.1%(-0.489)#11,768 |
| 86. | 83854 | 1.6% | 2.2%(-0.580)#86 | 2.1%(-0.551)#12,191 |
| 87. | 83836 | 1.6% | 2.2%(-0.599)#87 | 2.1%(-0.569)#12,305 |
| 88. | 83871 | 1.6% | 2.2%(-0.607)#88 | 2.1%(-0.578)#12,360 |
| 89. | 83212 | 1.5% | 2.2%(-0.632)#89 | 2.1%(-0.603)#12,529 |
| 90. | 83501 | 1.5% | 2.2%(-0.632)#90 | 2.1%(-0.603)#12,531 |
| 91. | 83553 | 1.5% | 2.2%(-0.640)#91 | 2.1%(-0.611)#12,583 |
| 92. | 83607 | 1.4% | 2.2%(-0.747)#92 | 2.1%(-0.718)#13,347 |
| 93. | 83438 | 1.4% | 2.2%(-0.750)#93 | 2.1%(-0.721)#13,365 |
| 94. | 83314 | 1.4% | 2.2%(-0.764)#94 | 2.1%(-0.734)#13,474 |
| 95. | 83837 | 1.4% | 2.2%(-0.777)#95 | 2.1%(-0.747)#13,567 |
| 96. | 83318 | 1.4% | 2.2%(-0.780)#96 | 2.1%(-0.751)#13,594 |
| 97. | 83861 | 1.4% | 2.2%(-0.818)#97 | 2.1%(-0.788)#13,869 |
| 98. | 83313 | 1.3% | 2.2%(-0.862)#98 | 2.1%(-0.833)#14,203 |
| 99. | 83543 | 1.3% | 2.2%(-0.907)#99 | 2.1%(-0.878)#14,517 |
| 100. | 83274 | 1.3% | 2.2%(-0.929)#100 | 2.1%(-0.899)#14,675 |
Common Questions
What are the Top 10 Zip Codes with the Highest Percentage of Population Employed in Architecture & Engineering in Idaho?
Top 10 Zip Codes with the Highest Percentage of Population Employed in Architecture & Engineering in Idaho are:
What zip code has the Highest Percentage of Population Employed in Architecture & Engineering in Idaho?
83424 has the Highest Percentage of Population Employed in Architecture & Engineering in Idaho with 100.0%.
What is the Percentage of Population Employed in Architecture & Engineering in the State of Idaho?
Percentage of Population Employed in Architecture & Engineering in Idaho is 2.2%.
What is the Percentage of Population Employed in Architecture & Engineering in the United States?
Percentage of Population Employed in Architecture & Engineering in the United States is 2.1%.