Zip Codes with the Highest Percentage of Population Employed in Architecture & Engineering in Nampa, ID
RELATED REPORTS & OPTIONS
Architecture & Engineering
Nampa
Compare Zip Codes
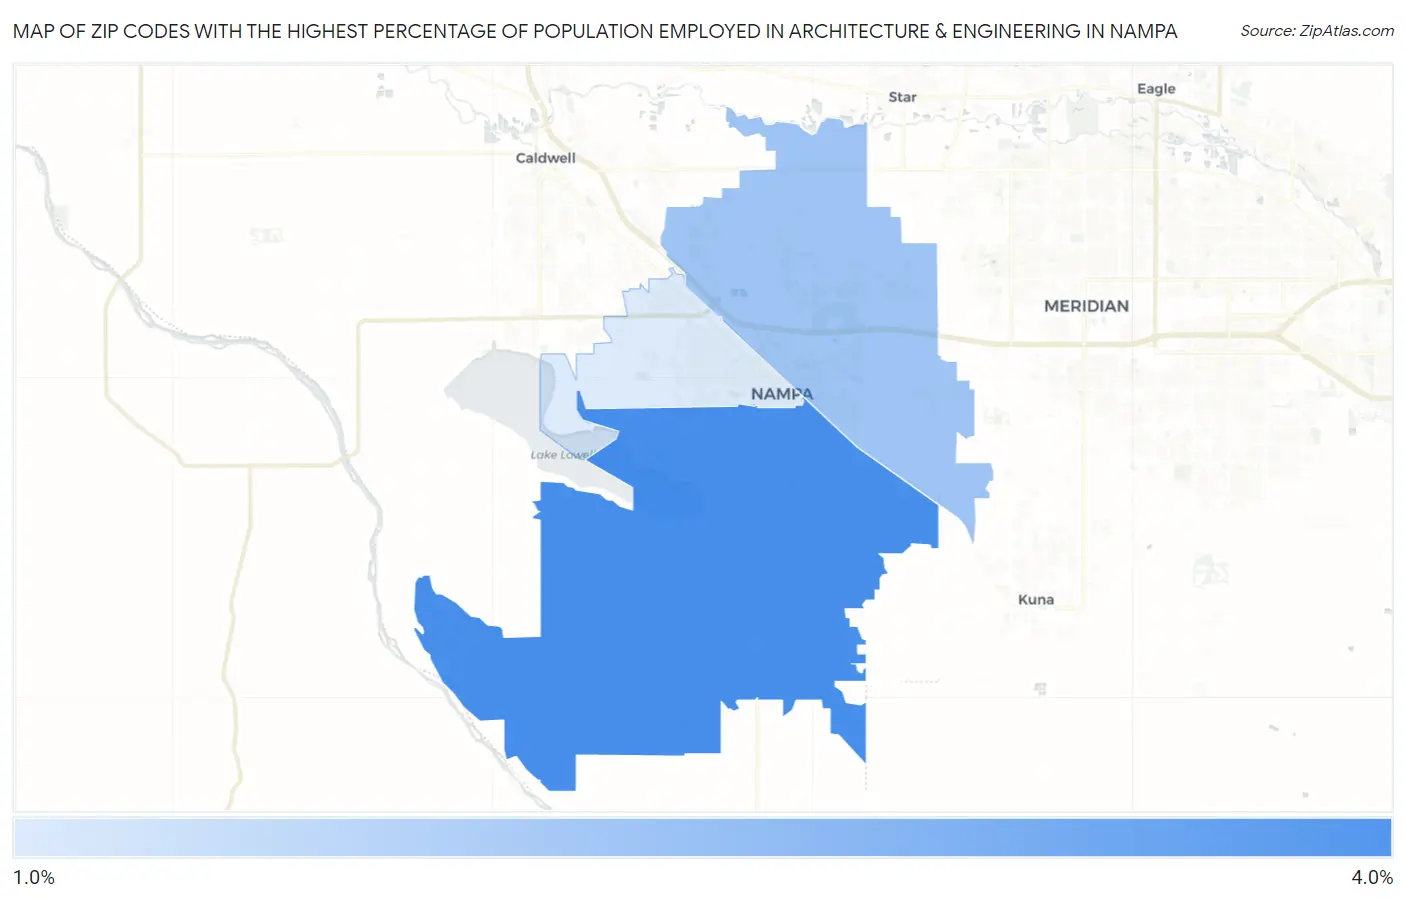
Map of Zip Codes with the Highest Percentage of Population Employed in Architecture & Engineering in Nampa
1.7%
3.2%
Zip Codes with the Highest Percentage of Population Employed in Architecture & Engineering in Nampa, ID
| Zip Code | % Employed | vs State | vs National | |
| 1. | 83686 | 3.2% | 2.2%(+1.06)#32 | 2.1%(+1.09)#4,370 |
| 2. | 83687 | 2.3% | 2.2%(+0.160)#59 | 2.1%(+0.189)#7,768 |
| 3. | 83651 | 1.7% | 2.2%(-0.478)#82 | 2.1%(-0.448)#11,485 |
1
Common Questions
What are the Top Zip Codes with the Highest Percentage of Population Employed in Architecture & Engineering in Nampa, ID?
Top Zip Codes with the Highest Percentage of Population Employed in Architecture & Engineering in Nampa, ID are:
What zip code has the Highest Percentage of Population Employed in Architecture & Engineering in Nampa, ID?
83686 has the Highest Percentage of Population Employed in Architecture & Engineering in Nampa, ID with 3.2%.
What is the Percentage of Population Employed in Architecture & Engineering in Nampa, ID?
Percentage of Population Employed in Architecture & Engineering in Nampa is 2.0%.
What is the Percentage of Population Employed in Architecture & Engineering in Idaho?
Percentage of Population Employed in Architecture & Engineering in Idaho is 2.2%.
What is the Percentage of Population Employed in Architecture & Engineering in the United States?
Percentage of Population Employed in Architecture & Engineering in the United States is 2.1%.