Rigby, ID Map & Demographics
Rigby Map
Rigby Overview
$26,951
PER CAPITA INCOME
$80,469
AVG FAMILY INCOME
$73,807
AVG HOUSEHOLD INCOME
40.9%
WAGE / INCOME GAP [ % ]
59.1¢/ $1
WAGE / INCOME GAP [ $ ]
0.36
INEQUALITY / GINI INDEX
5,097
TOTAL POPULATION
2,498
MALE POPULATION
2,599
FEMALE POPULATION
96.11
MALES / 100 FEMALES
104.04
FEMALES / 100 MALES
28.9
MEDIAN AGE
3.3
AVG FAMILY SIZE
2.7
AVG HOUSEHOLD SIZE
2,272
LABOR FORCE [ PEOPLE ]
65.6%
PERCENT IN LABOR FORCE
2.2%
UNEMPLOYMENT RATE
Rigby Zip Codes
Rigby Area Codes
Income in Rigby
Income Overview in Rigby
Per Capita Income in Rigby is $26,951, while median incomes of families and households are $80,469 and $73,807 respectively.
| Characteristic | Number | Measure |
| Per Capita Income | 5,097 | $26,951 |
| Median Family Income | 1,330 | $80,469 |
| Mean Family Income | 1,330 | $79,106 |
| Median Household Income | 1,845 | $73,807 |
| Mean Household Income | 1,845 | $72,998 |
| Income Deficit | 1,330 | $0 |
| Wage / Income Gap (%) | 5,097 | 40.93% |
| Wage / Income Gap ($) | 5,097 | 59.07¢ per $1 |
| Gini / Inequality Index | 5,097 | 0.36 |
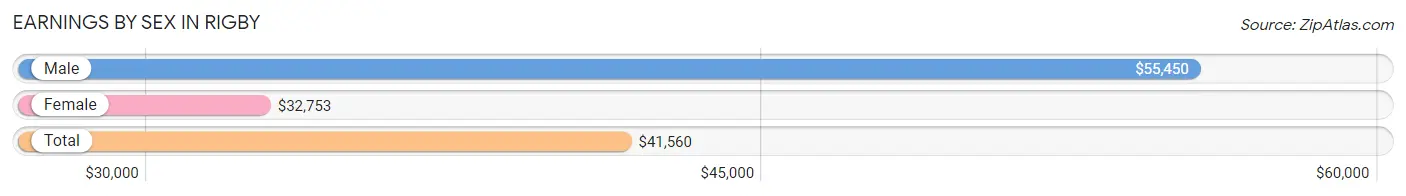
Earnings by Sex in Rigby
Average Earnings in Rigby are $41,560, $55,450 for men and $32,753 for women, a difference of 40.9%.
| Sex | Number | Average Earnings |
| Male | 1,543 (61.3%) | $55,450 |
| Female | 976 (38.8%) | $32,753 |
| Total | 2,519 (100.0%) | $41,560 |
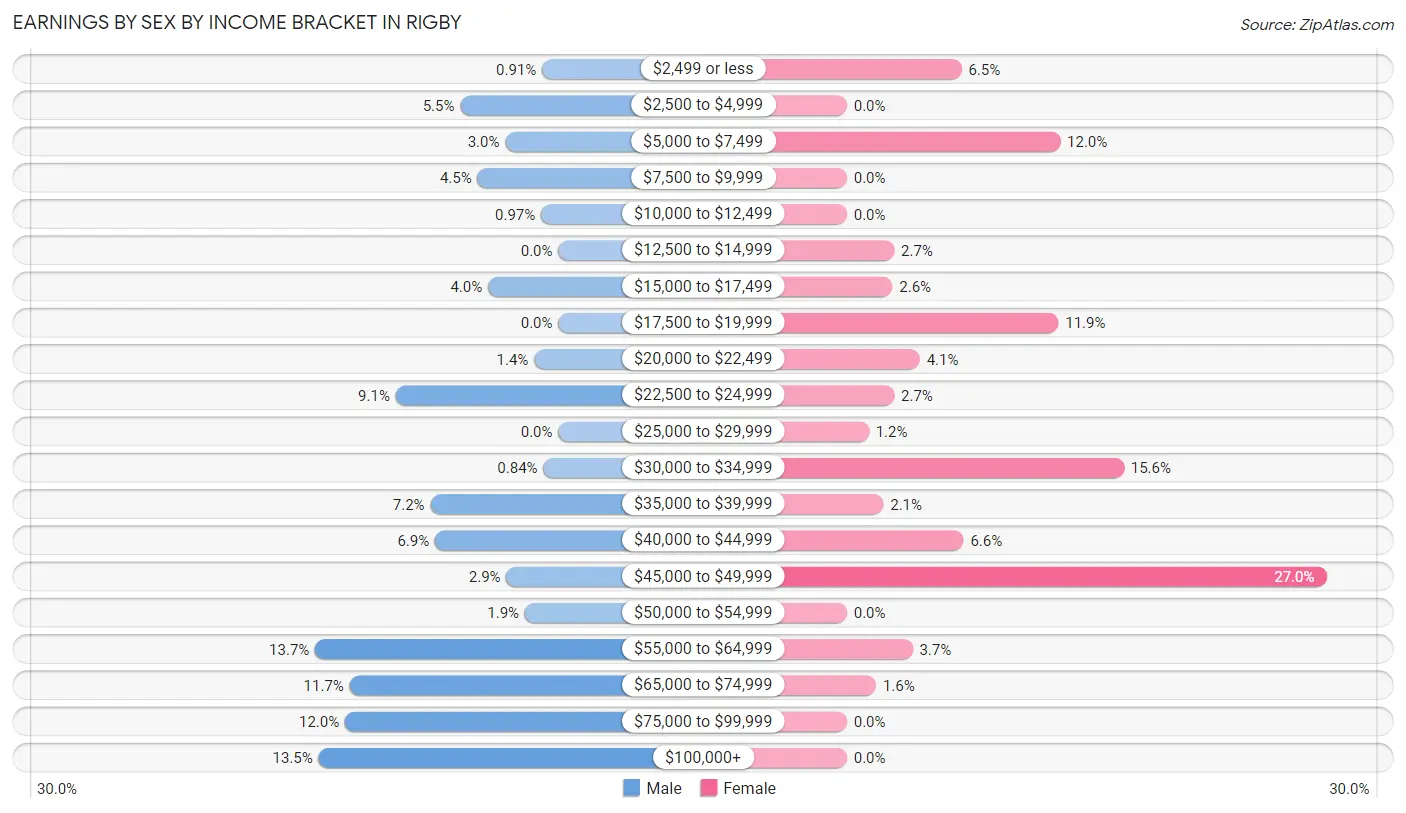
Earnings by Sex by Income Bracket in Rigby
The most common earnings brackets in Rigby are $55,000 to $64,999 for men (211 | 13.7%) and $45,000 to $49,999 for women (263 | 27.0%).
| Income | Male | Female |
| $2,499 or less | 14 (0.9%) | 63 (6.5%) |
| $2,500 to $4,999 | 85 (5.5%) | 0 (0.0%) |
| $5,000 to $7,499 | 46 (3.0%) | 117 (12.0%) |
| $7,500 to $9,999 | 70 (4.5%) | 0 (0.0%) |
| $10,000 to $12,499 | 15 (1.0%) | 0 (0.0%) |
| $12,500 to $14,999 | 0 (0.0%) | 26 (2.7%) |
| $15,000 to $17,499 | 61 (4.0%) | 25 (2.6%) |
| $17,500 to $19,999 | 0 (0.0%) | 116 (11.9%) |
| $20,000 to $22,499 | 21 (1.4%) | 40 (4.1%) |
| $22,500 to $24,999 | 141 (9.1%) | 26 (2.7%) |
| $25,000 to $29,999 | 0 (0.0%) | 12 (1.2%) |
| $30,000 to $34,999 | 13 (0.8%) | 152 (15.6%) |
| $35,000 to $39,999 | 111 (7.2%) | 20 (2.1%) |
| $40,000 to $44,999 | 107 (6.9%) | 64 (6.6%) |
| $45,000 to $49,999 | 45 (2.9%) | 263 (27.0%) |
| $50,000 to $54,999 | 29 (1.9%) | 0 (0.0%) |
| $55,000 to $64,999 | 211 (13.7%) | 36 (3.7%) |
| $65,000 to $74,999 | 181 (11.7%) | 16 (1.6%) |
| $75,000 to $99,999 | 185 (12.0%) | 0 (0.0%) |
| $100,000+ | 208 (13.5%) | 0 (0.0%) |
| Total | 1,543 (100.0%) | 976 (100.0%) |
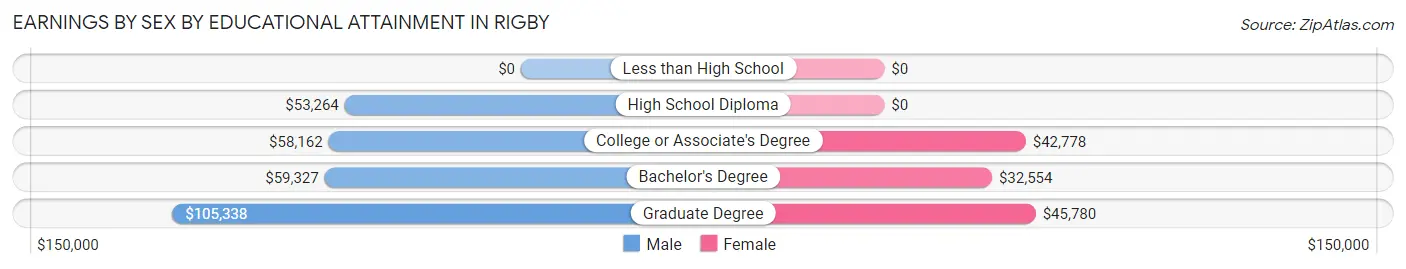
Earnings by Sex by Educational Attainment in Rigby
Average earnings in Rigby are $59,222 for men and $34,066 for women, a difference of 42.5%. Men with an educational attainment of graduate degree enjoy the highest average annual earnings of $105,338, while those with high school diploma education earn the least with $53,264. Women with an educational attainment of graduate degree earn the most with the average annual earnings of $45,780, while those with bachelor's degree education have the smallest earnings of $32,554.
| Educational Attainment | Male Income | Female Income |
| Less than High School | - | - |
| High School Diploma | $53,264 | $0 |
| College or Associate's Degree | $58,162 | $42,778 |
| Bachelor's Degree | $59,327 | $32,554 |
| Graduate Degree | $105,338 | $45,780 |
| Total | $59,222 | $34,066 |
Family Income in Rigby
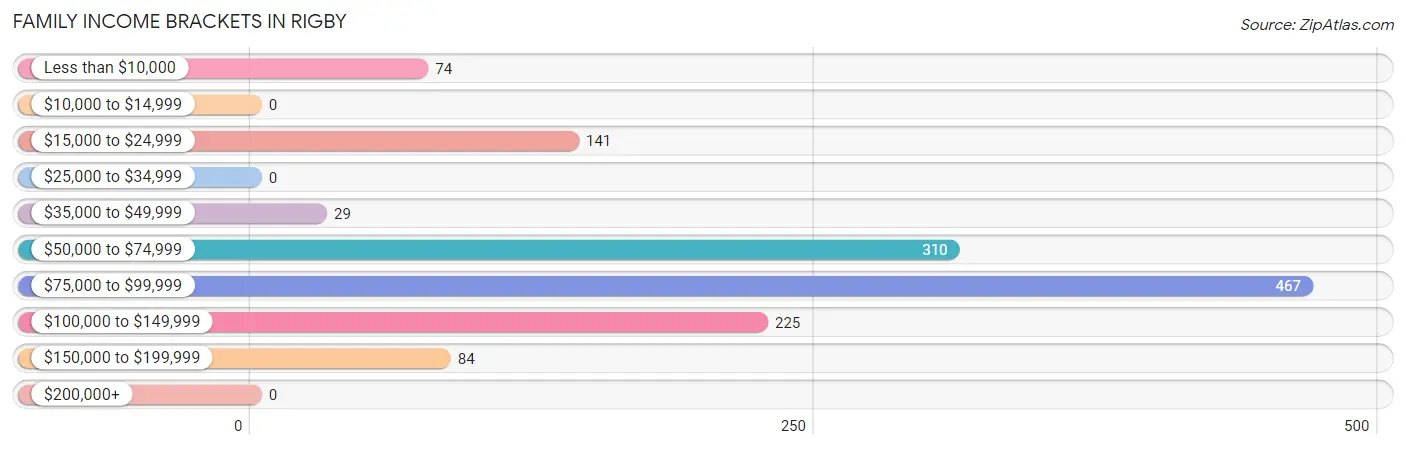
Family Income Brackets in Rigby
According to the Rigby family income data, there are 467 families falling into the $75,000 to $99,999 income range, which is the most common income bracket and makes up 35.1% of all families.
| Income Bracket | # Families | % Families |
| Less than $10,000 | 74 | 5.6% |
| $10,000 to $14,999 | 0 | 0.0% |
| $15,000 to $24,999 | 141 | 10.6% |
| $25,000 to $34,999 | 0 | 0.0% |
| $35,000 to $49,999 | 29 | 2.2% |
| $50,000 to $74,999 | 310 | 23.3% |
| $75,000 to $99,999 | 467 | 35.1% |
| $100,000 to $149,999 | 225 | 16.9% |
| $150,000 to $199,999 | 84 | 6.3% |
| $200,000+ | 0 | 0.0% |
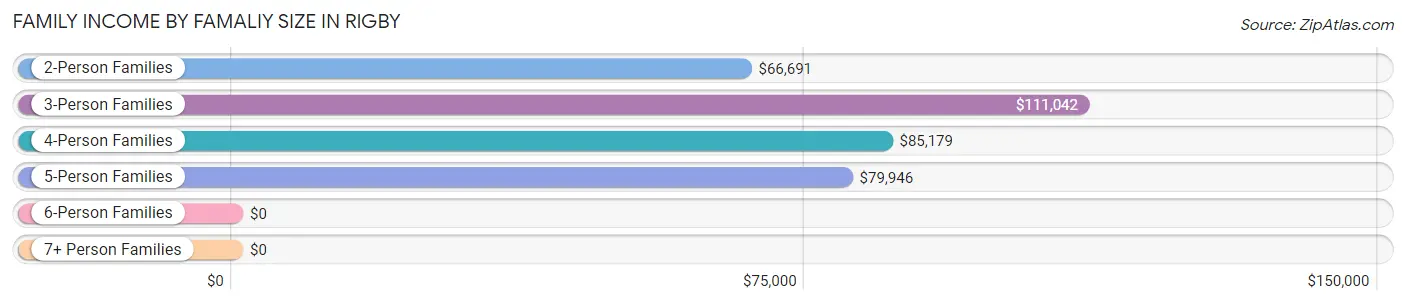
Family Income by Famaliy Size in Rigby
3-person families (160 | 12.0%) account for the highest median family income in Rigby with $111,042 per family, while 3-person families (160 | 12.0%) have the highest median income of $37,014 per family member.
| Income Bracket | # Families | Median Income |
| 2-Person Families | 563 (42.3%) | $66,691 |
| 3-Person Families | 160 (12.0%) | $111,042 |
| 4-Person Families | 433 (32.6%) | $85,179 |
| 5-Person Families | 71 (5.3%) | $79,946 |
| 6-Person Families | 19 (1.4%) | $0 |
| 7+ Person Families | 84 (6.3%) | $0 |
| Total | 1,330 (100.0%) | $80,469 |
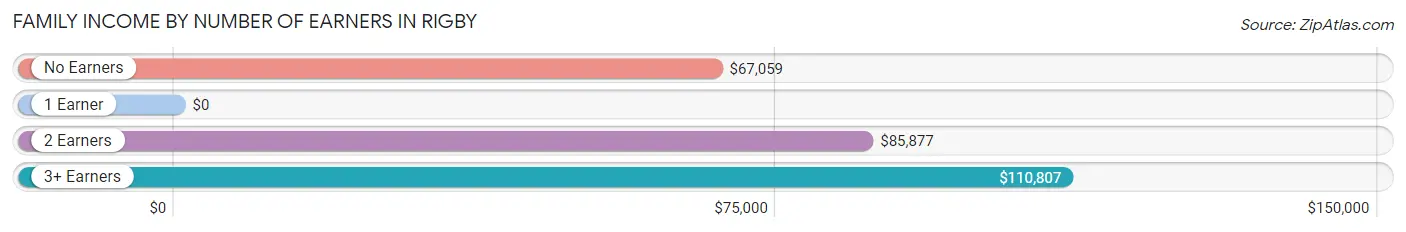
Family Income by Number of Earners in Rigby
| Number of Earners | # Families | Median Income |
| No Earners | 224 (16.8%) | $67,059 |
| 1 Earner | 283 (21.3%) | $0 |
| 2 Earners | 734 (55.2%) | $85,877 |
| 3+ Earners | 89 (6.7%) | $110,807 |
| Total | 1,330 (100.0%) | $80,469 |
Household Income in Rigby
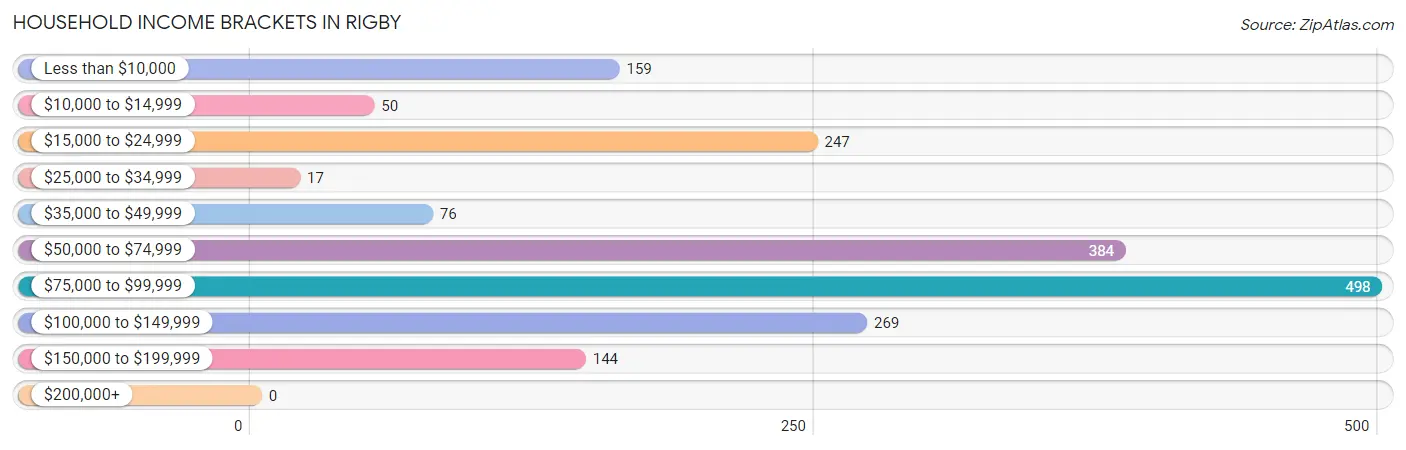
Household Income Brackets in Rigby
With 498 households falling in the category, the $75,000 to $99,999 income range is the most frequent in Rigby, accounting for 27.0% of all households.
| Income Bracket | # Households | % Households |
| Less than $10,000 | 159 | 8.6% |
| $10,000 to $14,999 | 50 | 2.7% |
| $15,000 to $24,999 | 247 | 13.4% |
| $25,000 to $34,999 | 17 | 0.9% |
| $35,000 to $49,999 | 76 | 4.1% |
| $50,000 to $74,999 | 384 | 20.8% |
| $75,000 to $99,999 | 498 | 27.0% |
| $100,000 to $149,999 | 269 | 14.6% |
| $150,000 to $199,999 | 144 | 7.8% |
| $200,000+ | 0 | 0.0% |
Household Income by Householder Age in Rigby
The median household income in Rigby is $73,807, with the highest median household income of $85,686 found in the 25 to 44 years age bracket for the primary householder. A total of 859 households (46.6%) fall into this category. Meanwhile, the 65+ years age bracket for the primary householder has the lowest median household income of $0, with 344 households (18.6%) in this group.
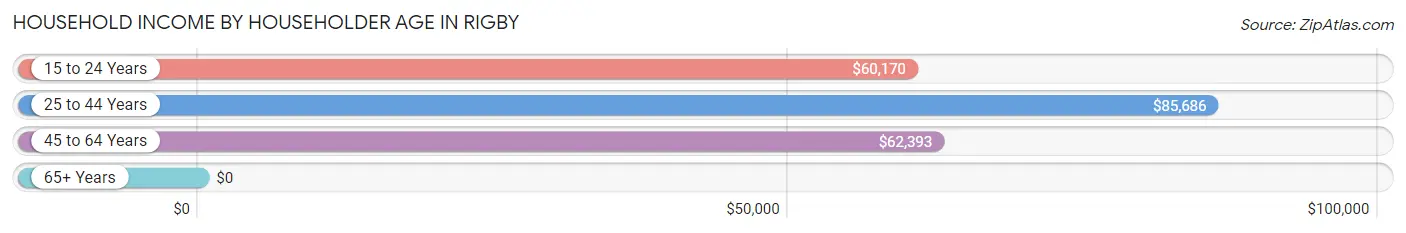
| Income Bracket | # Households | Median Income |
| 15 to 24 Years | 189 (10.2%) | $60,170 |
| 25 to 44 Years | 859 (46.6%) | $85,686 |
| 45 to 64 Years | 453 (24.5%) | $62,393 |
| 65+ Years | 344 (18.6%) | $0 |
| Total | 1,845 (100.0%) | $73,807 |
Poverty in Rigby
Income Below Poverty by Sex and Age in Rigby
With 15.9% poverty level for males and 14.0% for females among the residents of Rigby, under 5 year old males and 18 to 24 year old females are the most vulnerable to poverty, with 184 males (41.5%) and 80 females (41.4%) in their respective age groups living below the poverty level.
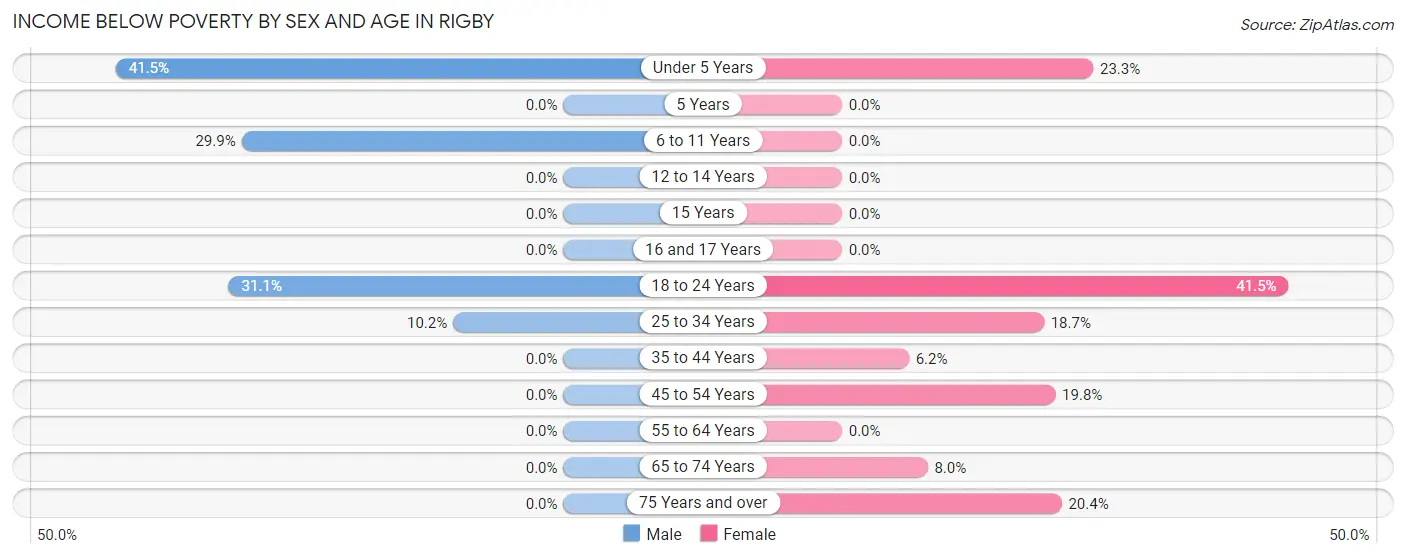
| Age Bracket | Male | Female |
| Under 5 Years | 184 (41.5%) | 90 (23.3%) |
| 5 Years | 0 (0.0%) | 0 (0.0%) |
| 6 to 11 Years | 69 (29.9%) | 0 (0.0%) |
| 12 to 14 Years | 0 (0.0%) | 0 (0.0%) |
| 15 Years | 0 (0.0%) | 0 (0.0%) |
| 16 and 17 Years | 0 (0.0%) | 0 (0.0%) |
| 18 to 24 Years | 91 (31.1%) | 80 (41.4%) |
| 25 to 34 Years | 46 (10.2%) | 83 (18.7%) |
| 35 to 44 Years | 0 (0.0%) | 20 (6.2%) |
| 45 to 54 Years | 0 (0.0%) | 39 (19.8%) |
| 55 to 64 Years | 0 (0.0%) | 0 (0.0%) |
| 65 to 74 Years | 0 (0.0%) | 19 (8.0%) |
| 75 Years and over | 0 (0.0%) | 31 (20.4%) |
| Total | 390 (15.9%) | 362 (14.0%) |
Income Above Poverty by Sex and Age in Rigby
According to the poverty statistics in Rigby, males aged 12 to 14 years and females aged 6 to 11 years are the age groups that are most secure financially, with 100.0% of males and 100.0% of females in these age groups living above the poverty line.
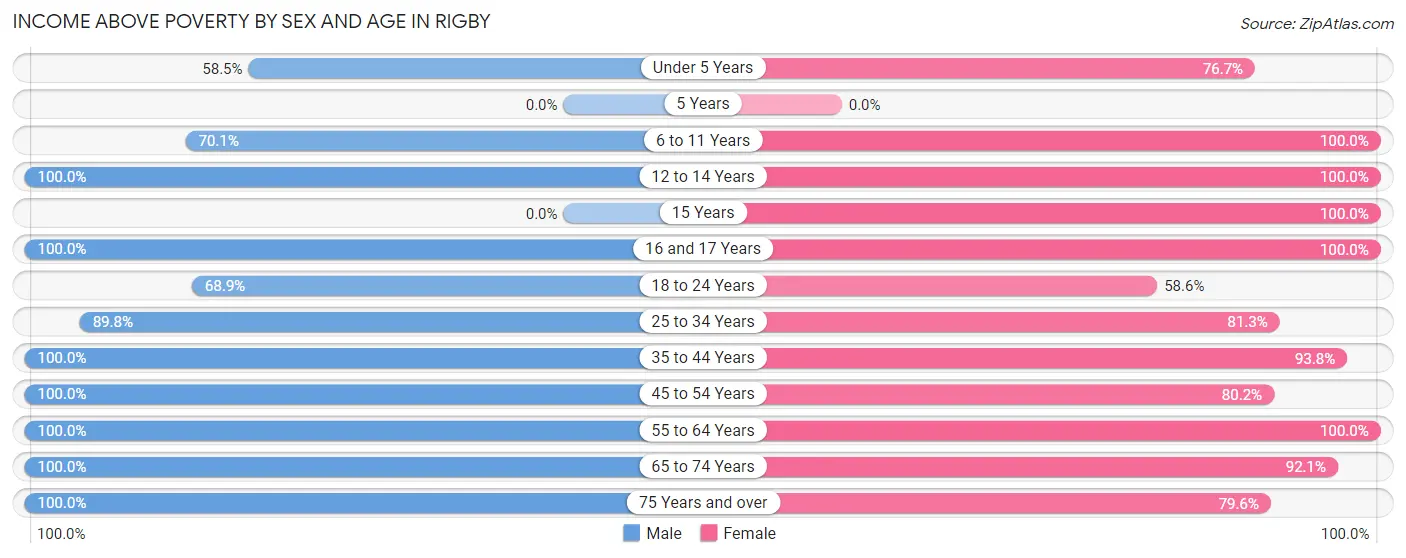
| Age Bracket | Male | Female |
| Under 5 Years | 259 (58.5%) | 296 (76.7%) |
| 5 Years | 0 (0.0%) | 0 (0.0%) |
| 6 to 11 Years | 162 (70.1%) | 337 (100.0%) |
| 12 to 14 Years | 86 (100.0%) | 103 (100.0%) |
| 15 Years | 0 (0.0%) | 48 (100.0%) |
| 16 and 17 Years | 33 (100.0%) | 38 (100.0%) |
| 18 to 24 Years | 202 (68.9%) | 113 (58.6%) |
| 25 to 34 Years | 403 (89.8%) | 360 (81.3%) |
| 35 to 44 Years | 322 (100.0%) | 302 (93.8%) |
| 45 to 54 Years | 305 (100.0%) | 158 (80.2%) |
| 55 to 64 Years | 134 (100.0%) | 127 (100.0%) |
| 65 to 74 Years | 111 (100.0%) | 220 (92.0%) |
| 75 Years and over | 39 (100.0%) | 121 (79.6%) |
| Total | 2,056 (84.1%) | 2,223 (86.0%) |
Income Below Poverty Among Married-Couple Families in Rigby
The poverty statistics for married-couple families in Rigby show that 6.9% or 80 of the total 1,161 families live below the poverty line. Families with 1 or 2 children have the highest poverty rate of 15.7%, comprising of 80 families. On the other hand, families with no children have the lowest poverty rate of 0.0%, which includes 0 families.
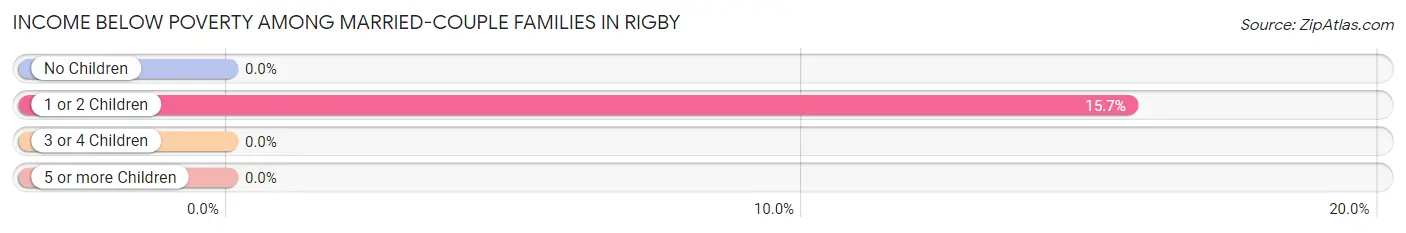
| Children | Above Poverty | Below Poverty |
| No Children | 488 (100.0%) | 0 (0.0%) |
| 1 or 2 Children | 431 (84.3%) | 80 (15.7%) |
| 3 or 4 Children | 78 (100.0%) | 0 (0.0%) |
| 5 or more Children | 84 (100.0%) | 0 (0.0%) |
| Total | 1,081 (93.1%) | 80 (6.9%) |
Income Below Poverty Among Single-Parent Households in Rigby
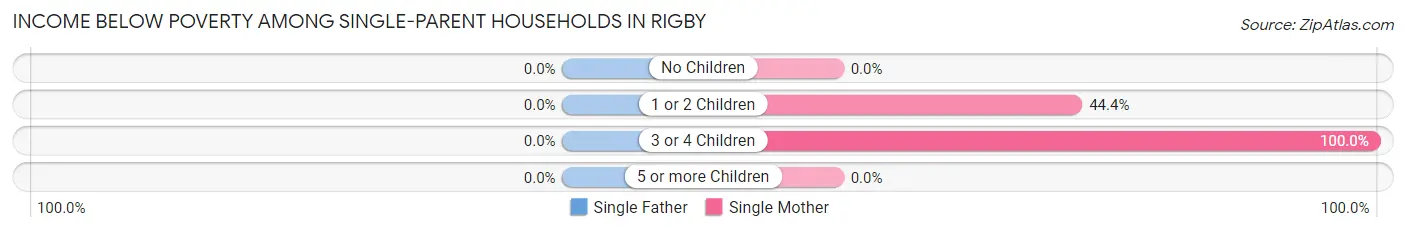
| Children | Single Father | Single Mother |
| No Children | 0 (0.0%) | 0 (0.0%) |
| 1 or 2 Children | 0 (0.0%) | 40 (44.4%) |
| 3 or 4 Children | 0 (0.0%) | 34 (100.0%) |
| 5 or more Children | 0 (0.0%) | 0 (0.0%) |
| Total | 0 (0.0%) | 74 (47.1%) |
Income Below Poverty Among Married-Couple vs Single-Parent Households in Rigby
The poverty data for Rigby shows that 80 of the married-couple family households (6.9%) and 74 of the single-parent households (43.8%) are living below the poverty level. Within the married-couple family households, those with 1 or 2 children have the highest poverty rate, with 80 households (15.7%) falling below the poverty line. Among the single-parent households, those with 3 or 4 children have the highest poverty rate, with 34 household (100.0%) living below poverty.
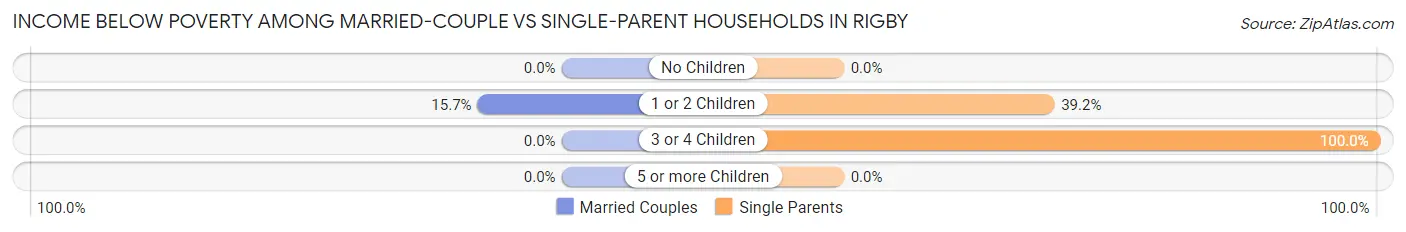
| Children | Married-Couple Families | Single-Parent Households |
| No Children | 0 (0.0%) | 0 (0.0%) |
| 1 or 2 Children | 80 (15.7%) | 40 (39.2%) |
| 3 or 4 Children | 0 (0.0%) | 34 (100.0%) |
| 5 or more Children | 0 (0.0%) | 0 (0.0%) |
| Total | 80 (6.9%) | 74 (43.8%) |
Race in Rigby
The most populous races in Rigby are White / Caucasian (4,367 | 85.7%), Hispanic or Latino (722 | 14.2%), and Some other Race (386 | 7.6%).
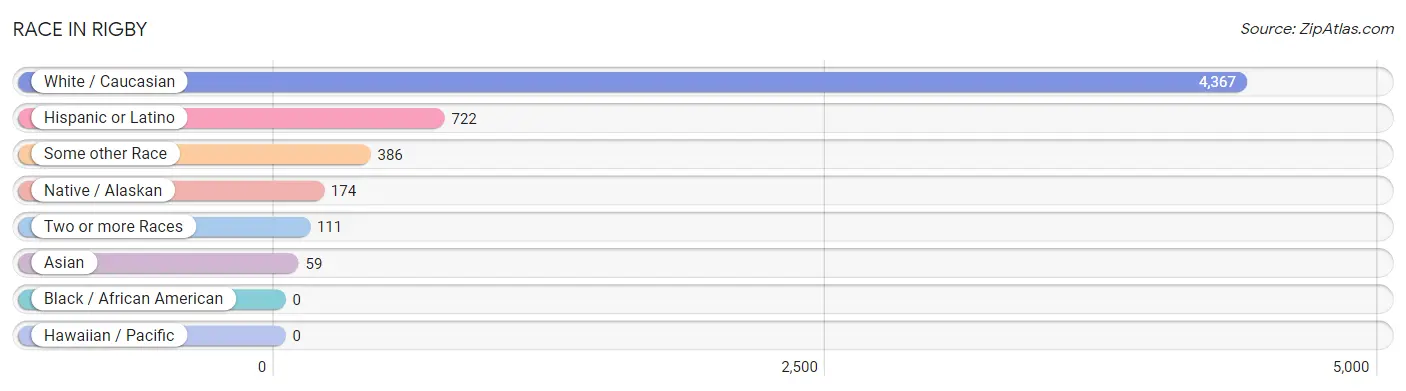
| Race | # Population | % Population |
| Asian | 59 | 1.2% |
| Black / African American | 0 | 0.0% |
| Hawaiian / Pacific | 0 | 0.0% |
| Hispanic or Latino | 722 | 14.2% |
| Native / Alaskan | 174 | 3.4% |
| White / Caucasian | 4,367 | 85.7% |
| Two or more Races | 111 | 2.2% |
| Some other Race | 386 | 7.6% |
| Total | 5,097 | 100.0% |
Ancestry in Rigby
The most populous ancestries reported in Rigby are English (2,350 | 46.1%), German (754 | 14.8%), Irish (614 | 12.0%), Mexican (501 | 9.8%), and French (295 | 5.8%), together accounting for 88.6% of all Rigby residents.
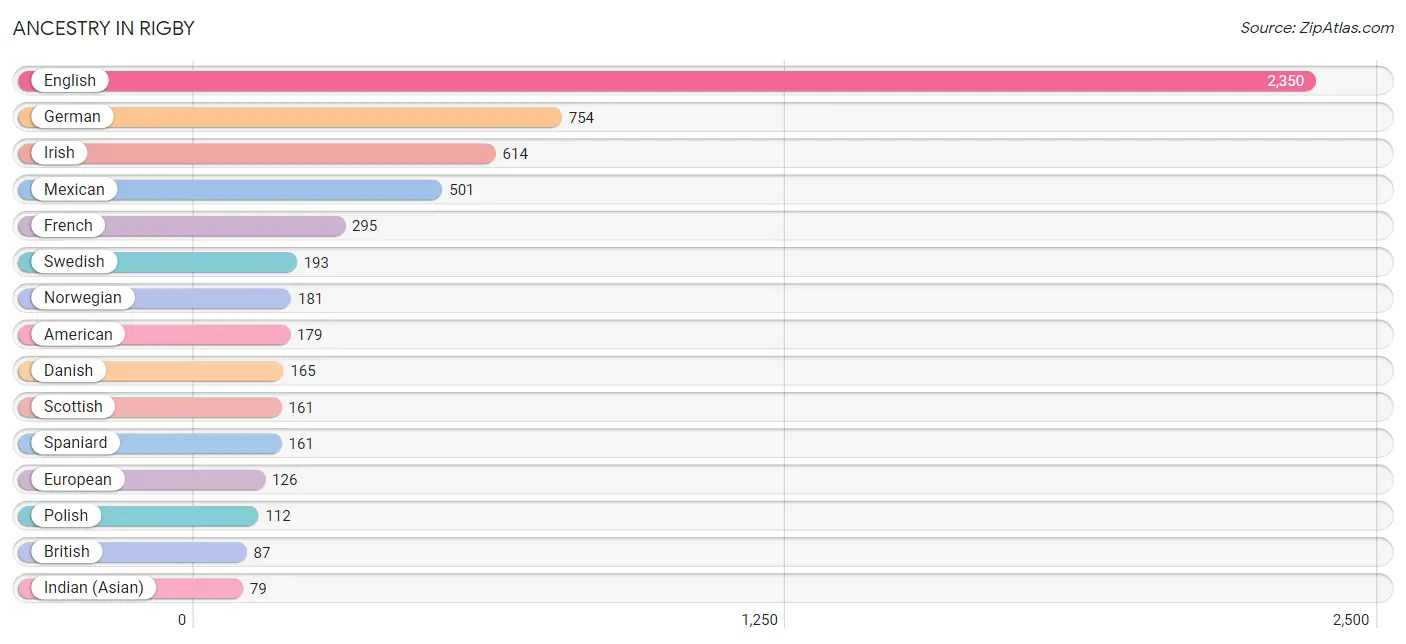
| Ancestry | # Population | % Population |
| American | 179 | 3.5% |
| Argentinean | 55 | 1.1% |
| Austrian | 20 | 0.4% |
| British | 87 | 1.7% |
| Burmese | 22 | 0.4% |
| Cherokee | 19 | 0.4% |
| Choctaw | 6 | 0.1% |
| Danish | 165 | 3.2% |
| Dutch | 14 | 0.3% |
| Eastern European | 38 | 0.7% |
| English | 2,350 | 46.1% |
| Ethiopian | 6 | 0.1% |
| European | 126 | 2.5% |
| French | 295 | 5.8% |
| German | 754 | 14.8% |
| Indian (Asian) | 79 | 1.5% |
| Irish | 614 | 12.0% |
| Italian | 48 | 0.9% |
| Korean | 39 | 0.8% |
| Mexican | 501 | 9.8% |
| Navajo | 56 | 1.1% |
| Norwegian | 181 | 3.5% |
| Polish | 112 | 2.2% |
| Samoan | 6 | 0.1% |
| Scotch-Irish | 13 | 0.3% |
| Scottish | 161 | 3.2% |
| South American | 55 | 1.1% |
| Spaniard | 161 | 3.2% |
| Subsaharan African | 6 | 0.1% |
| Swedish | 193 | 3.8% |
| Swiss | 20 | 0.4% |
| Thai | 6 | 0.1% |
| Welsh | 52 | 1.0% | View All 33 Rows |
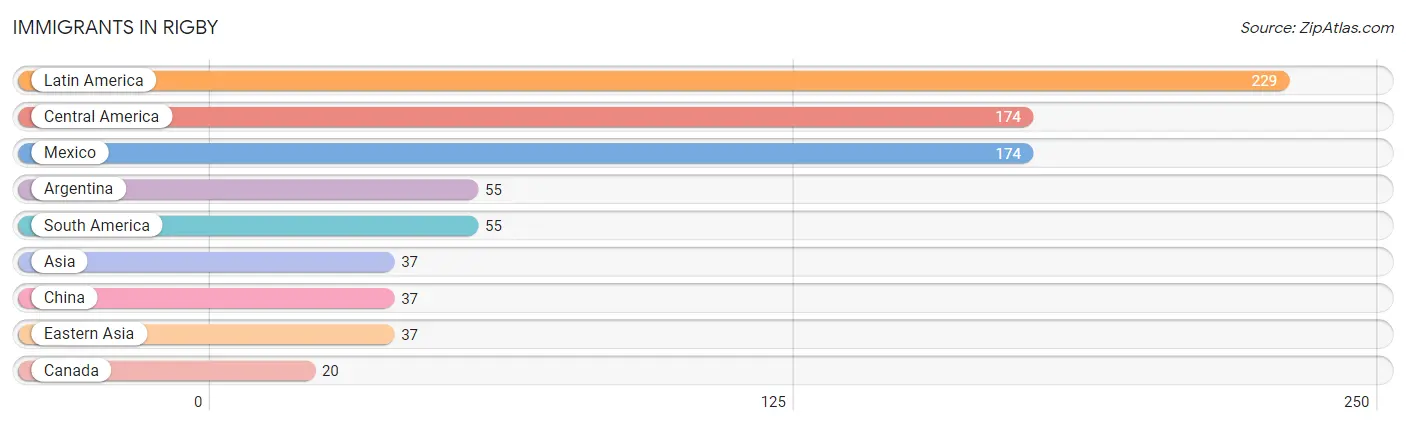
Immigrants in Rigby
The most numerous immigrant groups reported in Rigby came from Latin America (229 | 4.5%), Central America (174 | 3.4%), Mexico (174 | 3.4%), Argentina (55 | 1.1%), and South America (55 | 1.1%), together accounting for 13.5% of all Rigby residents.
| Immigration Origin | # Population | % Population |
| Argentina | 55 | 1.1% |
| Asia | 37 | 0.7% |
| Canada | 20 | 0.4% |
| Central America | 174 | 3.4% |
| China | 37 | 0.7% |
| Eastern Asia | 37 | 0.7% |
| Latin America | 229 | 4.5% |
| Mexico | 174 | 3.4% |
| South America | 55 | 1.1% | View All 9 Rows |
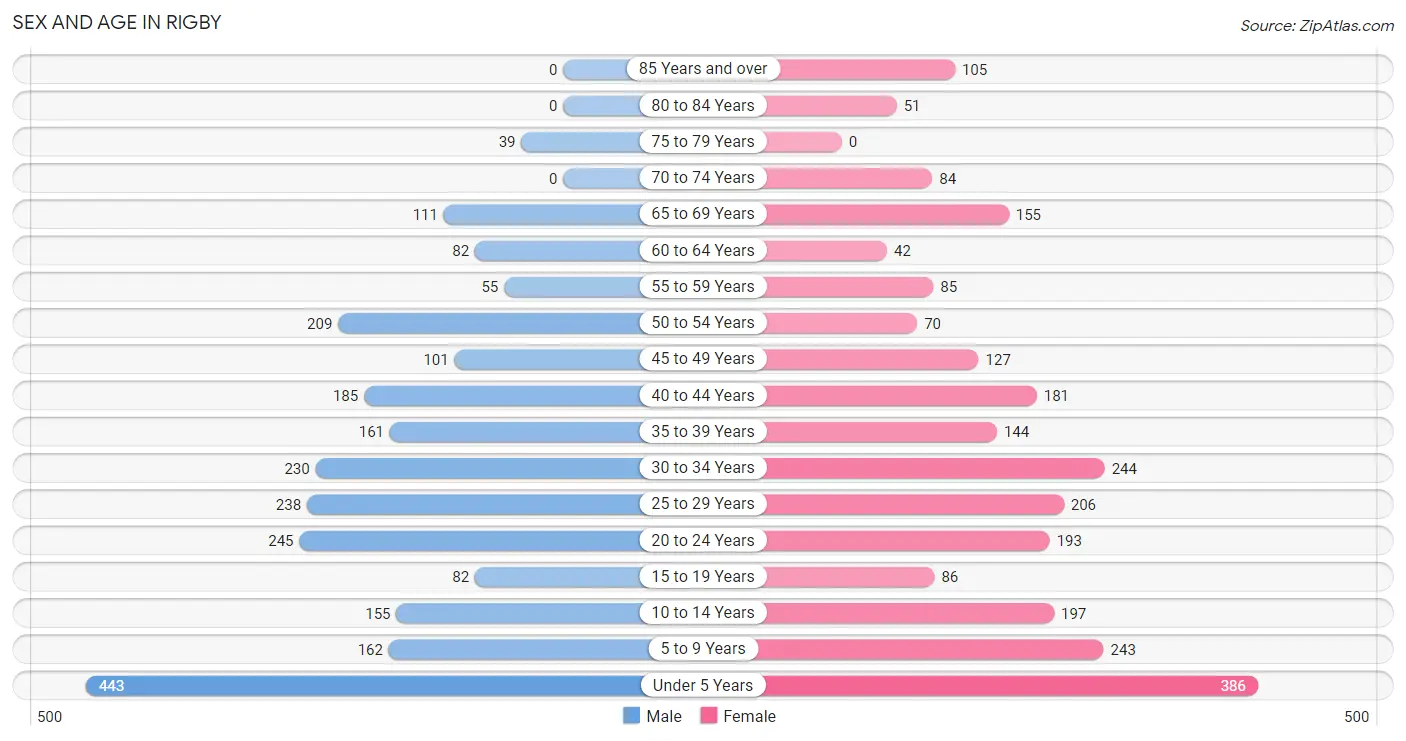
Sex and Age in Rigby
Sex and Age in Rigby
The most populous age groups in Rigby are Under 5 Years (443 | 17.7%) for men and Under 5 Years (386 | 14.8%) for women.
| Age Bracket | Male | Female |
| Under 5 Years | 443 (17.7%) | 386 (14.8%) |
| 5 to 9 Years | 162 (6.5%) | 243 (9.3%) |
| 10 to 14 Years | 155 (6.2%) | 197 (7.6%) |
| 15 to 19 Years | 82 (3.3%) | 86 (3.3%) |
| 20 to 24 Years | 245 (9.8%) | 193 (7.4%) |
| 25 to 29 Years | 238 (9.5%) | 206 (7.9%) |
| 30 to 34 Years | 230 (9.2%) | 244 (9.4%) |
| 35 to 39 Years | 161 (6.5%) | 144 (5.5%) |
| 40 to 44 Years | 185 (7.4%) | 181 (7.0%) |
| 45 to 49 Years | 101 (4.0%) | 127 (4.9%) |
| 50 to 54 Years | 209 (8.4%) | 70 (2.7%) |
| 55 to 59 Years | 55 (2.2%) | 85 (3.3%) |
| 60 to 64 Years | 82 (3.3%) | 42 (1.6%) |
| 65 to 69 Years | 111 (4.4%) | 155 (6.0%) |
| 70 to 74 Years | 0 (0.0%) | 84 (3.2%) |
| 75 to 79 Years | 39 (1.6%) | 0 (0.0%) |
| 80 to 84 Years | 0 (0.0%) | 51 (2.0%) |
| 85 Years and over | 0 (0.0%) | 105 (4.0%) |
| Total | 2,498 (100.0%) | 2,599 (100.0%) |
Families and Households in Rigby
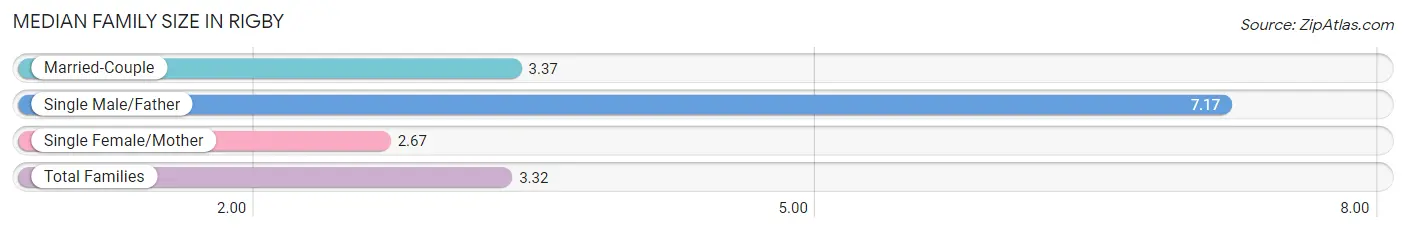
Median Family Size in Rigby
The median family size in Rigby is 3.32 persons per family, with single male/father families (12 | 0.9%) accounting for the largest median family size of 7.17 persons per family. On the other hand, single female/mother families (157 | 11.8%) represent the smallest median family size with 2.67 persons per family.
| Family Type | # Families | Family Size |
| Married-Couple | 1,161 (87.3%) | 3.37 |
| Single Male/Father | 12 (0.9%) | 7.17 |
| Single Female/Mother | 157 (11.8%) | 2.67 |
| Total Families | 1,330 (100.0%) | 3.32 |
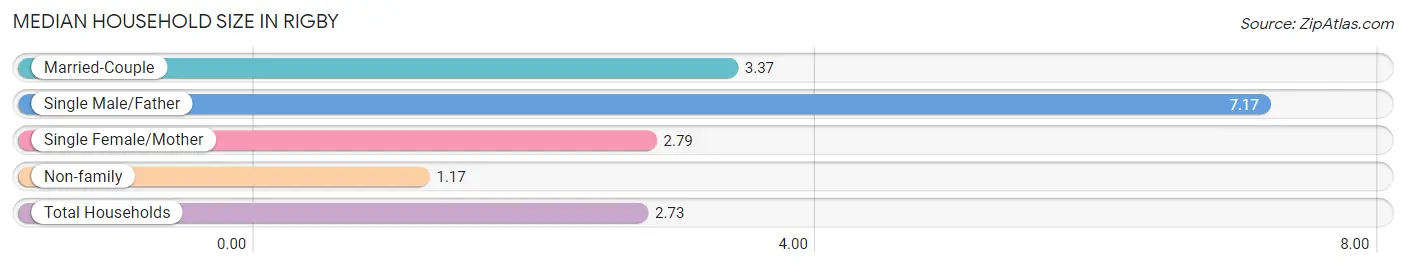
Median Household Size in Rigby
The median household size in Rigby is 2.73 persons per household, with single male/father households (12 | 0.6%) accounting for the largest median household size of 7.17 persons per household. non-family households (515 | 27.9%) represent the smallest median household size with 1.17 persons per household.
| Household Type | # Households | Household Size |
| Married-Couple | 1,161 (62.9%) | 3.37 |
| Single Male/Father | 12 (0.6%) | 7.17 |
| Single Female/Mother | 157 (8.5%) | 2.79 |
| Non-family | 515 (27.9%) | 1.17 |
| Total Households | 1,845 (100.0%) | 2.73 |
Household Size by Marriage Status in Rigby
Out of a total of 1,845 households in Rigby, 1,330 (72.1%) are family households, while 515 (27.9%) are nonfamily households. The most numerous type of family households are 2-person households, comprising 551, and the most common type of nonfamily households are 1-person households, comprising 409.
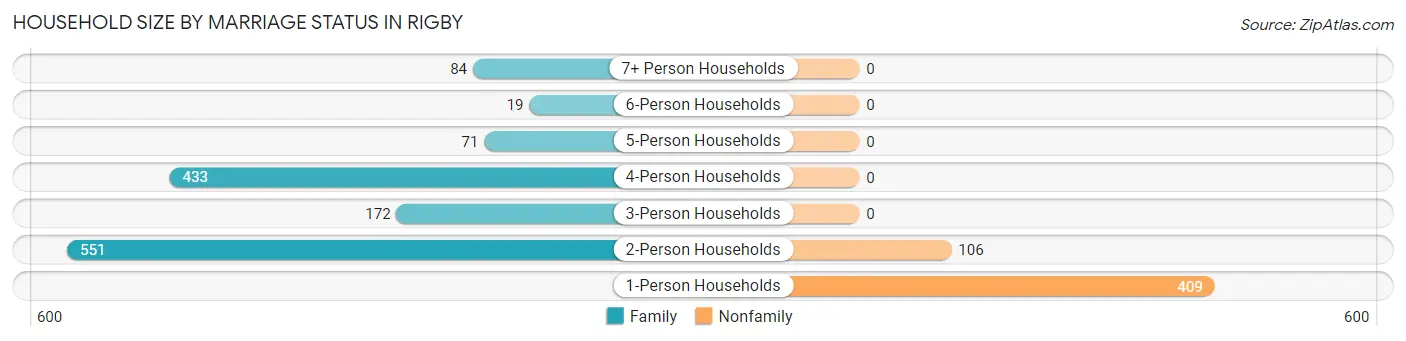
| Household Size | Family Households | Nonfamily Households |
| 1-Person Households | - | 409 (22.2%) |
| 2-Person Households | 551 (29.9%) | 106 (5.8%) |
| 3-Person Households | 172 (9.3%) | 0 (0.0%) |
| 4-Person Households | 433 (23.5%) | 0 (0.0%) |
| 5-Person Households | 71 (3.8%) | 0 (0.0%) |
| 6-Person Households | 19 (1.0%) | 0 (0.0%) |
| 7+ Person Households | 84 (4.5%) | 0 (0.0%) |
| Total | 1,330 (72.1%) | 515 (27.9%) |
Female Fertility in Rigby
Fertility by Age in Rigby
Average fertility rate in Rigby is 115.0 births per 1,000 women. Women in the age bracket of 20 to 34 years have the highest fertility rate with 177.0 births per 1,000 women. Women in the age bracket of 20 to 34 years acount for 83.2% of all women with births.
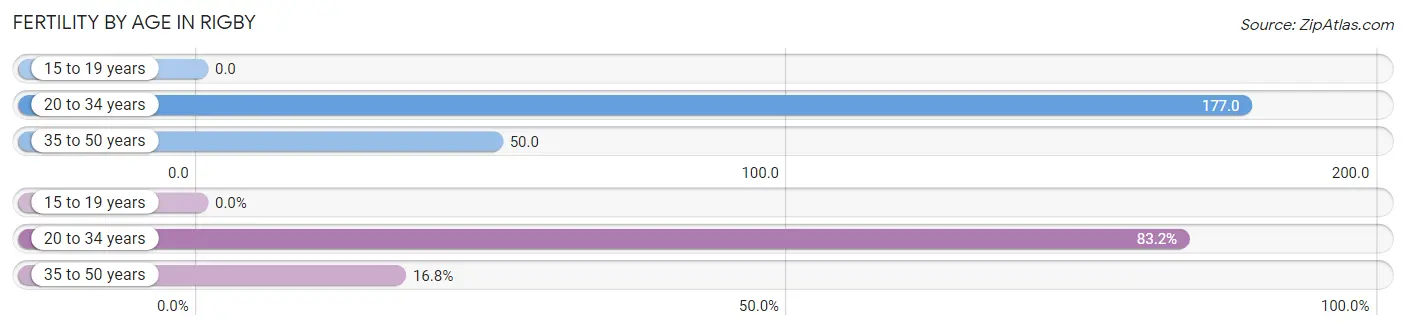
| Age Bracket | Women with Births | Births / 1,000 Women |
| 15 to 19 years | 0 (0.0%) | 0.0 |
| 20 to 34 years | 114 (83.2%) | 177.0 |
| 35 to 50 years | 23 (16.8%) | 50.0 |
| Total | 137 (100.0%) | 115.0 |
Fertility by Age by Marriage Status in Rigby
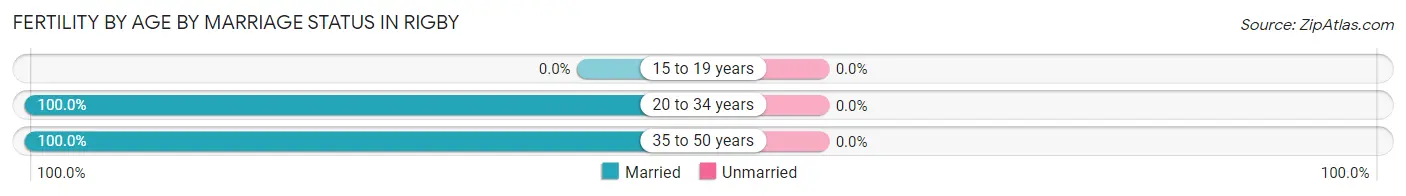
| Age Bracket | Married | Unmarried |
| 15 to 19 years | 0 (0.0%) | 0 (0.0%) |
| 20 to 34 years | 114 (100.0%) | 0 (0.0%) |
| 35 to 50 years | 23 (100.0%) | 0 (0.0%) |
| Total | 137 (100.0%) | 0 (0.0%) |
Fertility by Education in Rigby
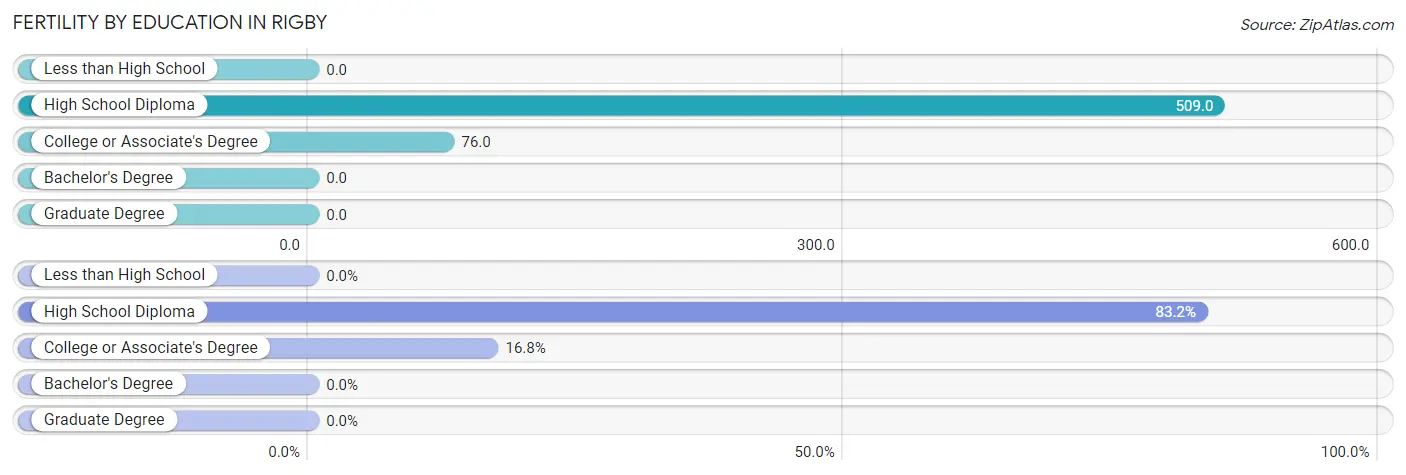
| Educational Attainment | Women with Births | Births / 1,000 Women |
| Less than High School | 0 (0.0%) | 0.0 |
| High School Diploma | 114 (83.2%) | 509.0 |
| College or Associate's Degree | 23 (16.8%) | 76.0 |
| Bachelor's Degree | 0 (0.0%) | 0.0 |
| Graduate Degree | 0 (0.0%) | 0.0 |
| Total | 137 (100.0%) | 115.0 |
Fertility by Education by Marriage Status in Rigby
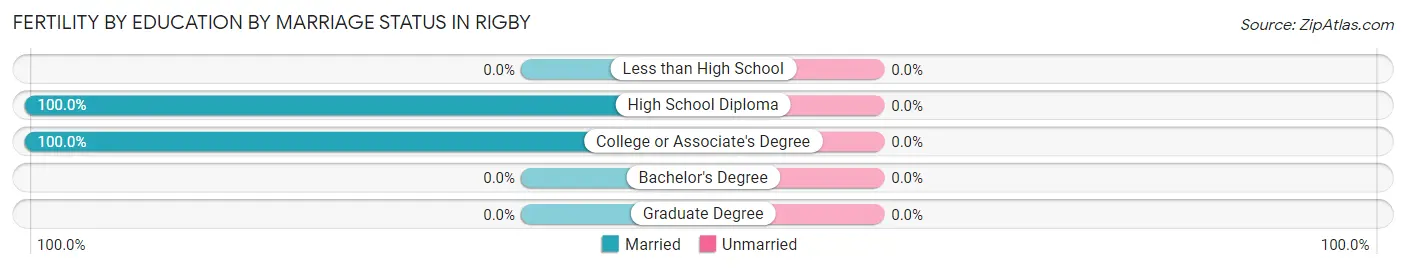
| Educational Attainment | Married | Unmarried |
| Less than High School | 0 (0.0%) | 0 (0.0%) |
| High School Diploma | 114 (100.0%) | 0 (0.0%) |
| College or Associate's Degree | 23 (100.0%) | 0 (0.0%) |
| Bachelor's Degree | 0 (0.0%) | 0 (0.0%) |
| Graduate Degree | 0 (0.0%) | 0 (0.0%) |
| Total | 137 (100.0%) | 0 (0.0%) |
Employment Characteristics in Rigby
Employment by Class of Employer in Rigby
Among the 2,210 employed individuals in Rigby, private company employees (1,196 | 54.1%), local government employees (312 | 14.1%), and self-employed (incorporated) (173 | 7.8%) make up the most common classes of employment.
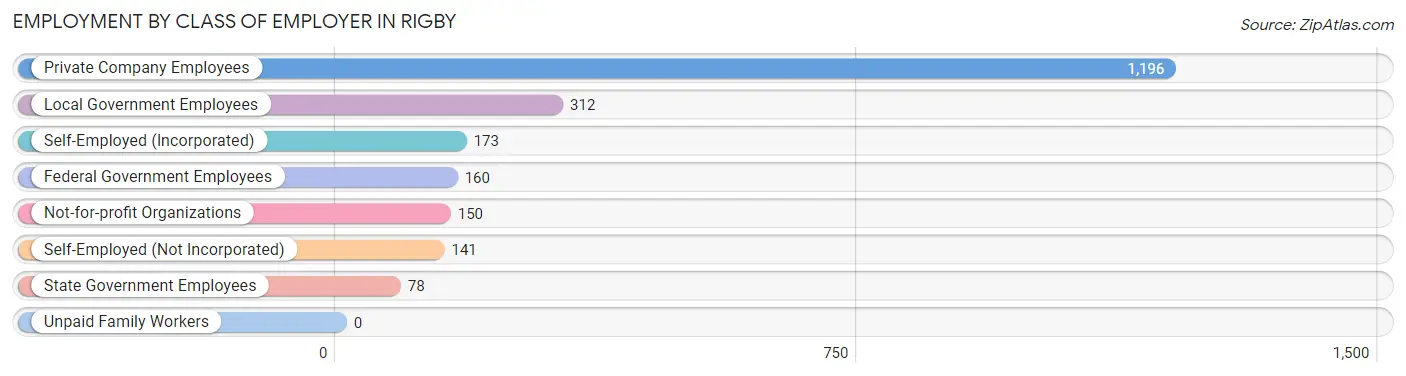
| Employer Class | # Employees | % Employees |
| Private Company Employees | 1,196 | 54.1% |
| Self-Employed (Incorporated) | 173 | 7.8% |
| Self-Employed (Not Incorporated) | 141 | 6.4% |
| Not-for-profit Organizations | 150 | 6.8% |
| Local Government Employees | 312 | 14.1% |
| State Government Employees | 78 | 3.5% |
| Federal Government Employees | 160 | 7.2% |
| Unpaid Family Workers | 0 | 0.0% |
| Total | 2,210 | 100.0% |
Employment Status by Age in Rigby
According to the labor force statistics for Rigby, out of the total population over 16 years of age (3,463), 65.6% or 2,272 individuals are in the labor force, with 2.2% or 50 of them unemployed. The age group with the highest labor force participation rate is 45 to 54 years, with 92.1% or 467 individuals in the labor force. Within the labor force, the 25 to 29 years age range has the highest percentage of unemployed individuals, with 10.3% or 34 of them being unemployed.
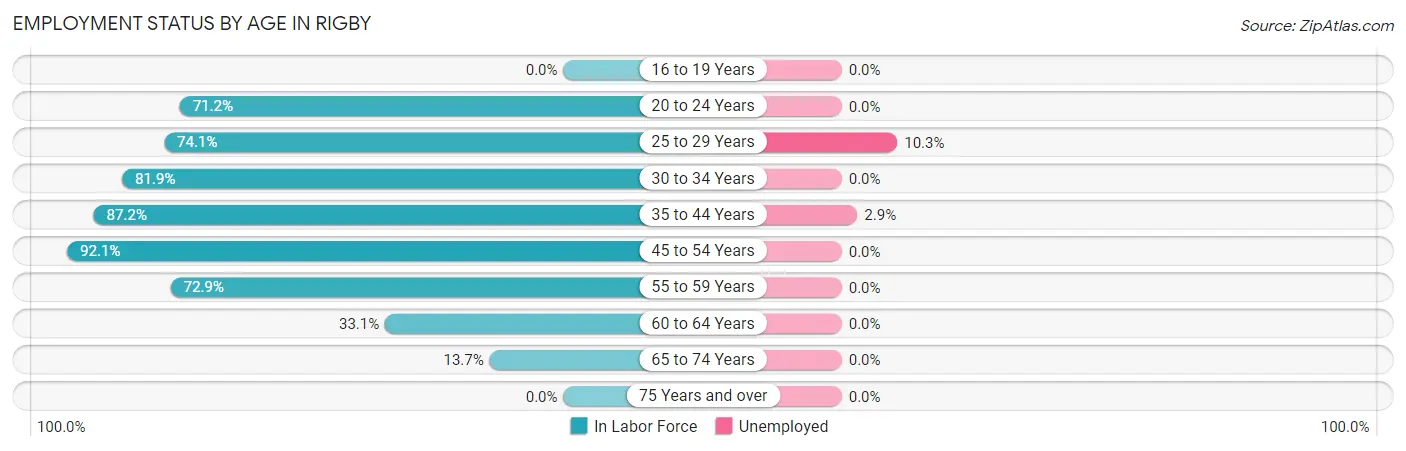
| Age Bracket | In Labor Force | Unemployed |
| 16 to 19 Years | 0 (0.0%) | 0 (0.0%) |
| 20 to 24 Years | 312 (71.2%) | 0 (0.0%) |
| 25 to 29 Years | 329 (74.1%) | 34 (10.3%) |
| 30 to 34 Years | 388 (81.9%) | 0 (0.0%) |
| 35 to 44 Years | 585 (87.2%) | 17 (2.9%) |
| 45 to 54 Years | 467 (92.1%) | 0 (0.0%) |
| 55 to 59 Years | 102 (72.9%) | 0 (0.0%) |
| 60 to 64 Years | 41 (33.1%) | 0 (0.0%) |
| 65 to 74 Years | 48 (13.7%) | 0 (0.0%) |
| 75 Years and over | 0 (0.0%) | 0 (0.0%) |
| Total | 2,272 (65.6%) | 50 (2.2%) |
Employment Status by Educational Attainment in Rigby
According to labor force statistics for Rigby, 81.0% of individuals (1,912) out of the total population between 25 and 64 years of age (2,360) are in the labor force, with 2.7% or 52 of them being unemployed. The group with the highest labor force participation rate are those with the educational attainment of high school diploma, with 85.8% or 320 individuals in the labor force. Within the labor force, individuals with high school diploma education have the highest percentage of unemployment, with 15.9% or 51 of them being unemployed.
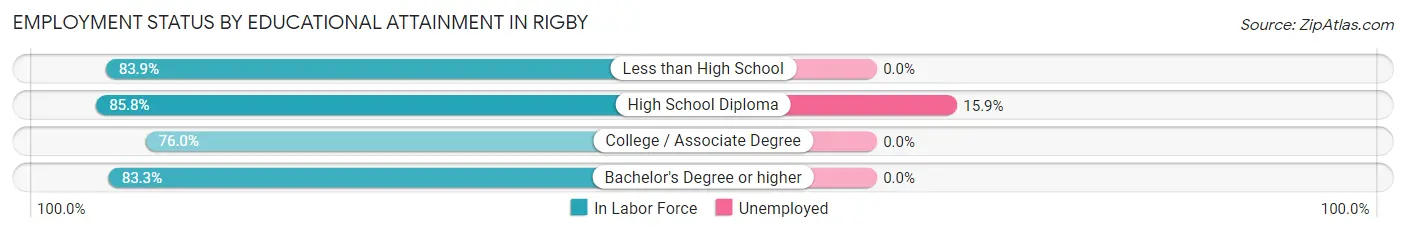
| Educational Attainment | In Labor Force | Unemployed |
| Less than High School | 73 (83.9%) | 0 (0.0%) |
| High School Diploma | 320 (85.8%) | 59 (15.9%) |
| College / Associate Degree | 666 (76.0%) | 0 (0.0%) |
| Bachelor's Degree or higher | 853 (83.3%) | 0 (0.0%) |
| Total | 1,912 (81.0%) | 64 (2.7%) |
Employment Occupations by Sex in Rigby
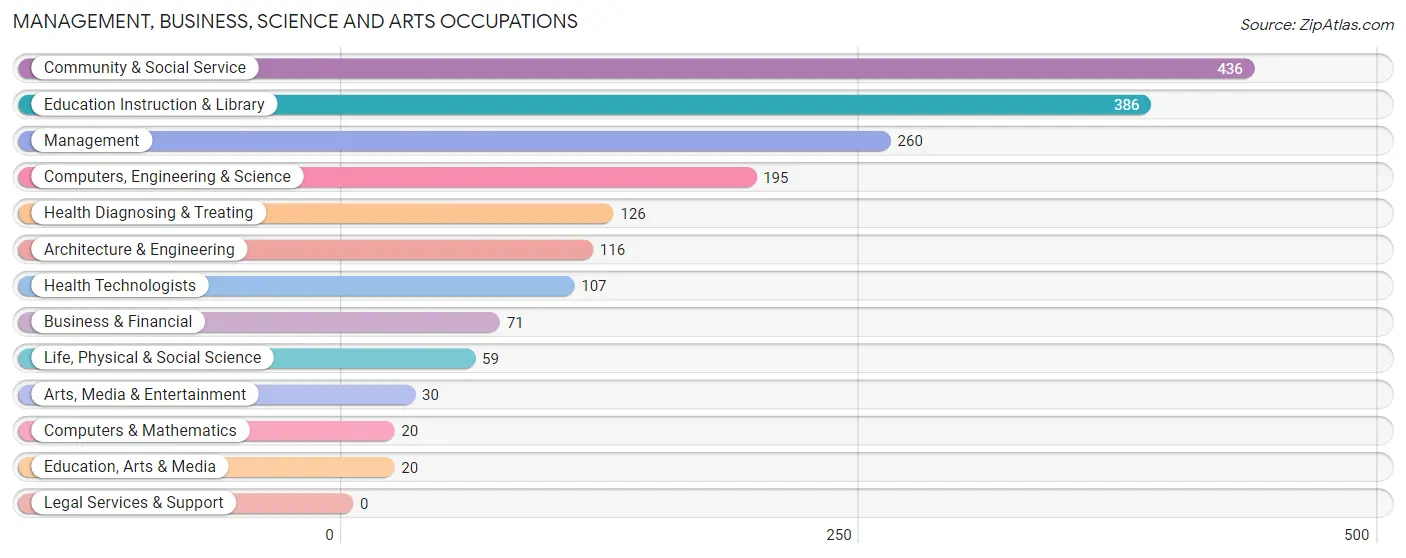
Management, Business, Science and Arts Occupations
The most common Management, Business, Science and Arts occupations in Rigby are Community & Social Service (436 | 19.6%), Education Instruction & Library (386 | 17.4%), Management (260 | 11.7%), Computers, Engineering & Science (195 | 8.8%), and Health Diagnosing & Treating (126 | 5.7%).
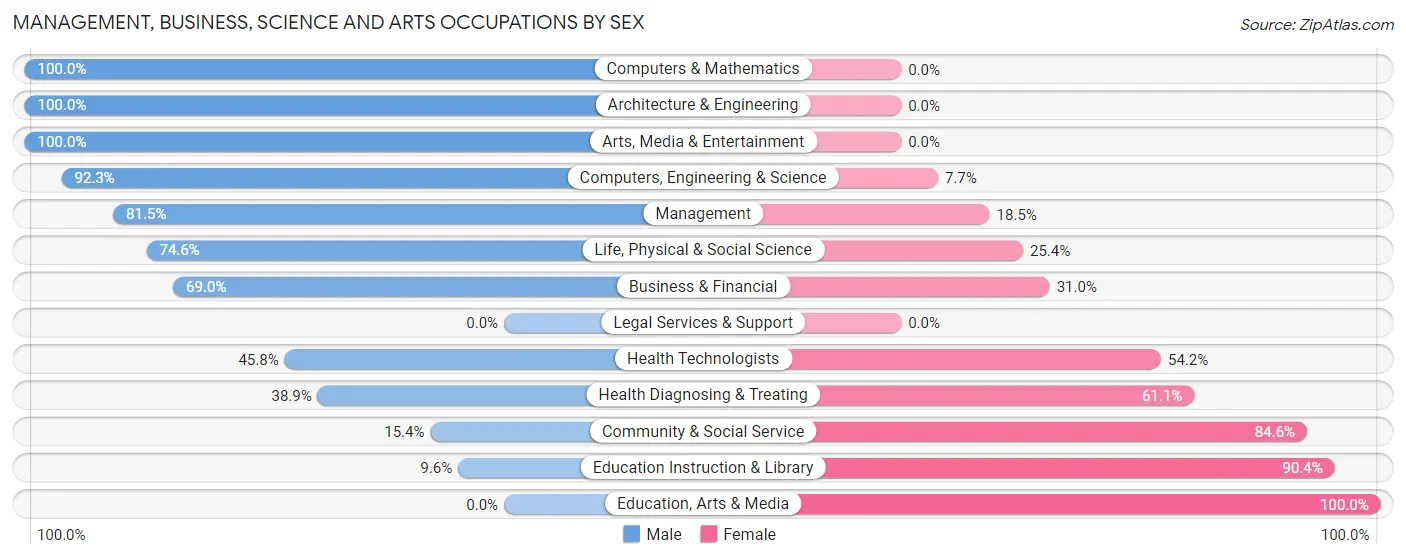
Management, Business, Science and Arts Occupations by Sex
Within the Management, Business, Science and Arts occupations in Rigby, the most male-oriented occupations are Computers & Mathematics (100.0%), Architecture & Engineering (100.0%), and Arts, Media & Entertainment (100.0%), while the most female-oriented occupations are Education, Arts & Media (100.0%), Education Instruction & Library (90.4%), and Community & Social Service (84.6%).
| Occupation | Male | Female |
| Management | 212 (81.5%) | 48 (18.5%) |
| Business & Financial | 49 (69.0%) | 22 (31.0%) |
| Computers, Engineering & Science | 180 (92.3%) | 15 (7.7%) |
| Computers & Mathematics | 20 (100.0%) | 0 (0.0%) |
| Architecture & Engineering | 116 (100.0%) | 0 (0.0%) |
| Life, Physical & Social Science | 44 (74.6%) | 15 (25.4%) |
| Community & Social Service | 67 (15.4%) | 369 (84.6%) |
| Education, Arts & Media | 0 (0.0%) | 20 (100.0%) |
| Legal Services & Support | 0 (0.0%) | 0 (0.0%) |
| Education Instruction & Library | 37 (9.6%) | 349 (90.4%) |
| Arts, Media & Entertainment | 30 (100.0%) | 0 (0.0%) |
| Health Diagnosing & Treating | 49 (38.9%) | 77 (61.1%) |
| Health Technologists | 49 (45.8%) | 58 (54.2%) |
| Total (Category) | 557 (51.2%) | 531 (48.8%) |
| Total (Overall) | 1,385 (62.4%) | 836 (37.6%) |
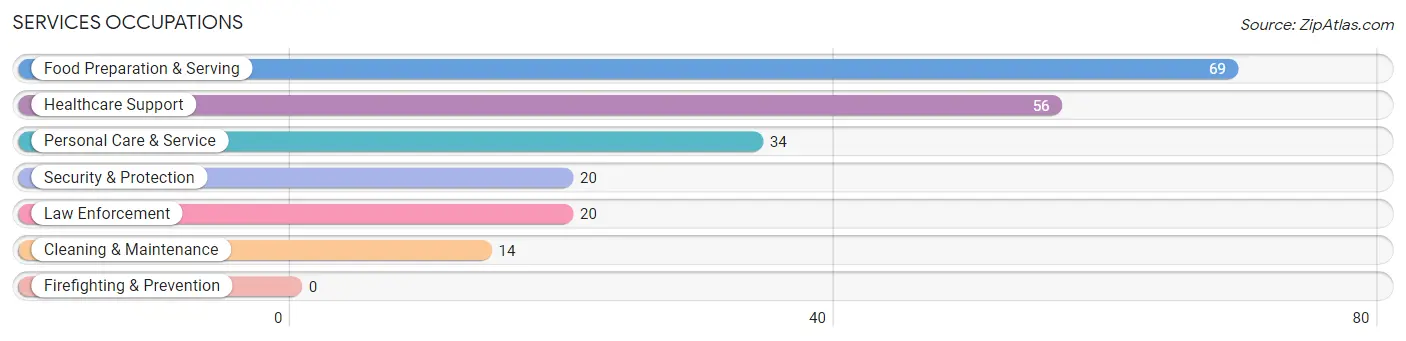
Services Occupations
The most common Services occupations in Rigby are Food Preparation & Serving (69 | 3.1%), Healthcare Support (56 | 2.5%), Personal Care & Service (34 | 1.5%), Security & Protection (20 | 0.9%), and Law Enforcement (20 | 0.9%).
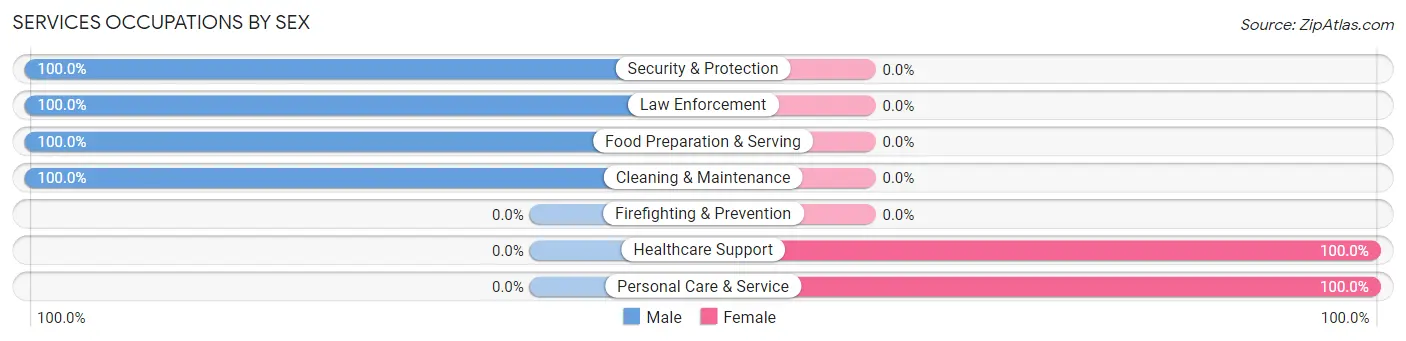
Services Occupations by Sex
Within the Services occupations in Rigby, the most male-oriented occupations are Security & Protection (100.0%), Law Enforcement (100.0%), and Food Preparation & Serving (100.0%), while the most female-oriented occupations are Healthcare Support (100.0%), and Personal Care & Service (100.0%).
| Occupation | Male | Female |
| Healthcare Support | 0 (0.0%) | 56 (100.0%) |
| Security & Protection | 20 (100.0%) | 0 (0.0%) |
| Firefighting & Prevention | 0 (0.0%) | 0 (0.0%) |
| Law Enforcement | 20 (100.0%) | 0 (0.0%) |
| Food Preparation & Serving | 69 (100.0%) | 0 (0.0%) |
| Cleaning & Maintenance | 14 (100.0%) | 0 (0.0%) |
| Personal Care & Service | 0 (0.0%) | 34 (100.0%) |
| Total (Category) | 103 (53.4%) | 90 (46.6%) |
| Total (Overall) | 1,385 (62.4%) | 836 (37.6%) |
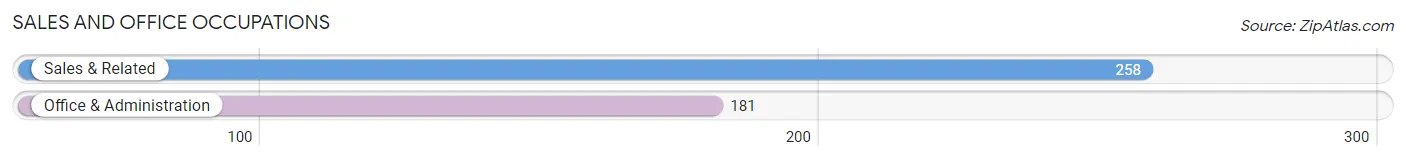
Sales and Office Occupations
The most common Sales and Office occupations in Rigby are Sales & Related (258 | 11.6%), and Office & Administration (181 | 8.2%).
Sales and Office Occupations by Sex
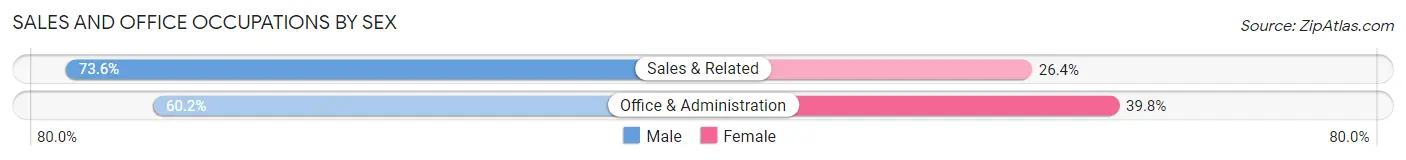
| Occupation | Male | Female |
| Sales & Related | 190 (73.6%) | 68 (26.4%) |
| Office & Administration | 109 (60.2%) | 72 (39.8%) |
| Total (Category) | 299 (68.1%) | 140 (31.9%) |
| Total (Overall) | 1,385 (62.4%) | 836 (37.6%) |
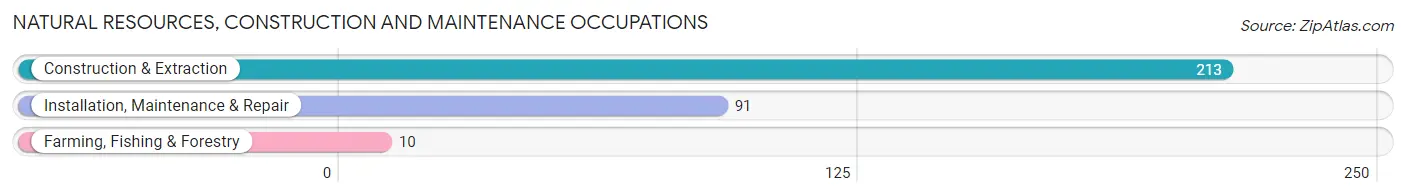
Natural Resources, Construction and Maintenance Occupations
The most common Natural Resources, Construction and Maintenance occupations in Rigby are Construction & Extraction (213 | 9.6%), Installation, Maintenance & Repair (91 | 4.1%), and Farming, Fishing & Forestry (10 | 0.4%).
Natural Resources, Construction and Maintenance Occupations by Sex
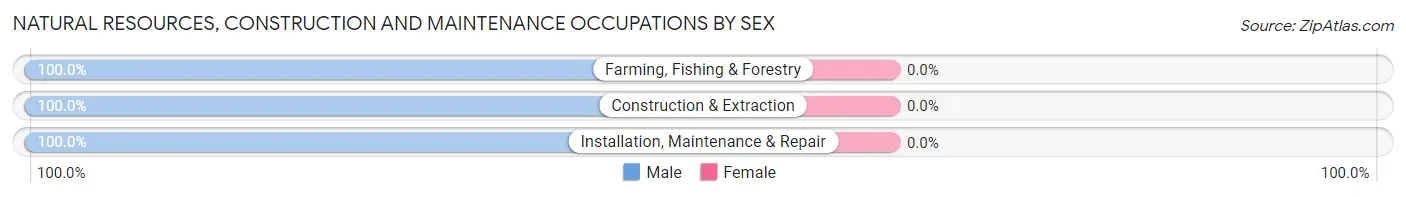
| Occupation | Male | Female |
| Farming, Fishing & Forestry | 10 (100.0%) | 0 (0.0%) |
| Construction & Extraction | 213 (100.0%) | 0 (0.0%) |
| Installation, Maintenance & Repair | 91 (100.0%) | 0 (0.0%) |
| Total (Category) | 314 (100.0%) | 0 (0.0%) |
| Total (Overall) | 1,385 (62.4%) | 836 (37.6%) |
Production, Transportation and Moving Occupations
The most common Production, Transportation and Moving occupations in Rigby are Transportation (97 | 4.4%), and Production (90 | 4.1%).
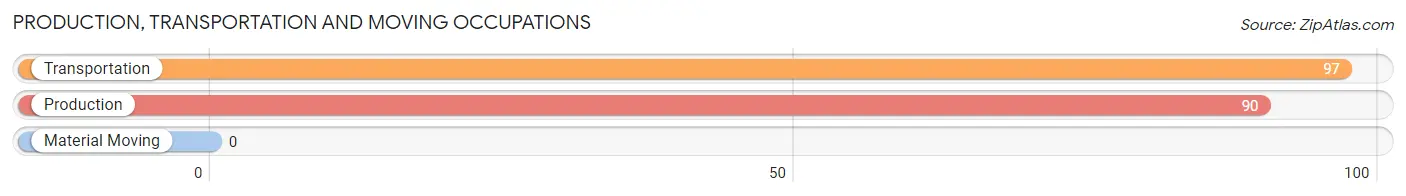
Production, Transportation and Moving Occupations by Sex
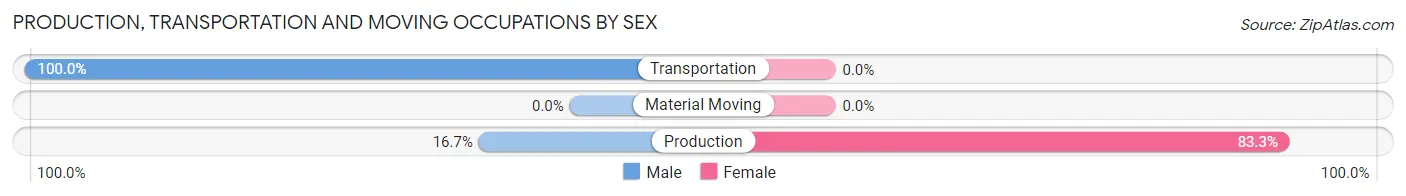
| Occupation | Male | Female |
| Production | 15 (16.7%) | 75 (83.3%) |
| Transportation | 97 (100.0%) | 0 (0.0%) |
| Material Moving | 0 (0.0%) | 0 (0.0%) |
| Total (Category) | 112 (59.9%) | 75 (40.1%) |
| Total (Overall) | 1,385 (62.4%) | 836 (37.6%) |
Employment Industries by Sex in Rigby
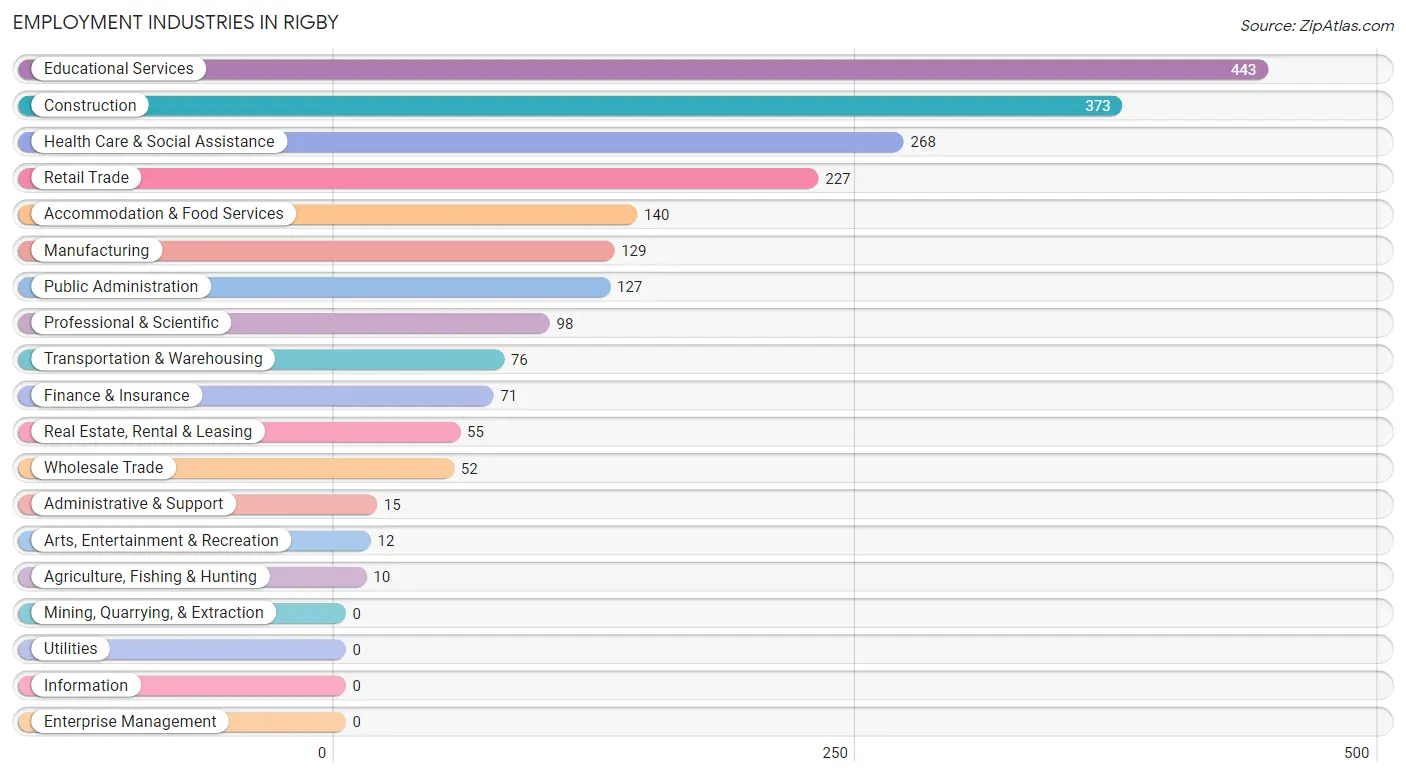
Employment Industries in Rigby
The major employment industries in Rigby include Educational Services (443 | 20.0%), Construction (373 | 16.8%), Health Care & Social Assistance (268 | 12.1%), Retail Trade (227 | 10.2%), and Accommodation & Food Services (140 | 6.3%).
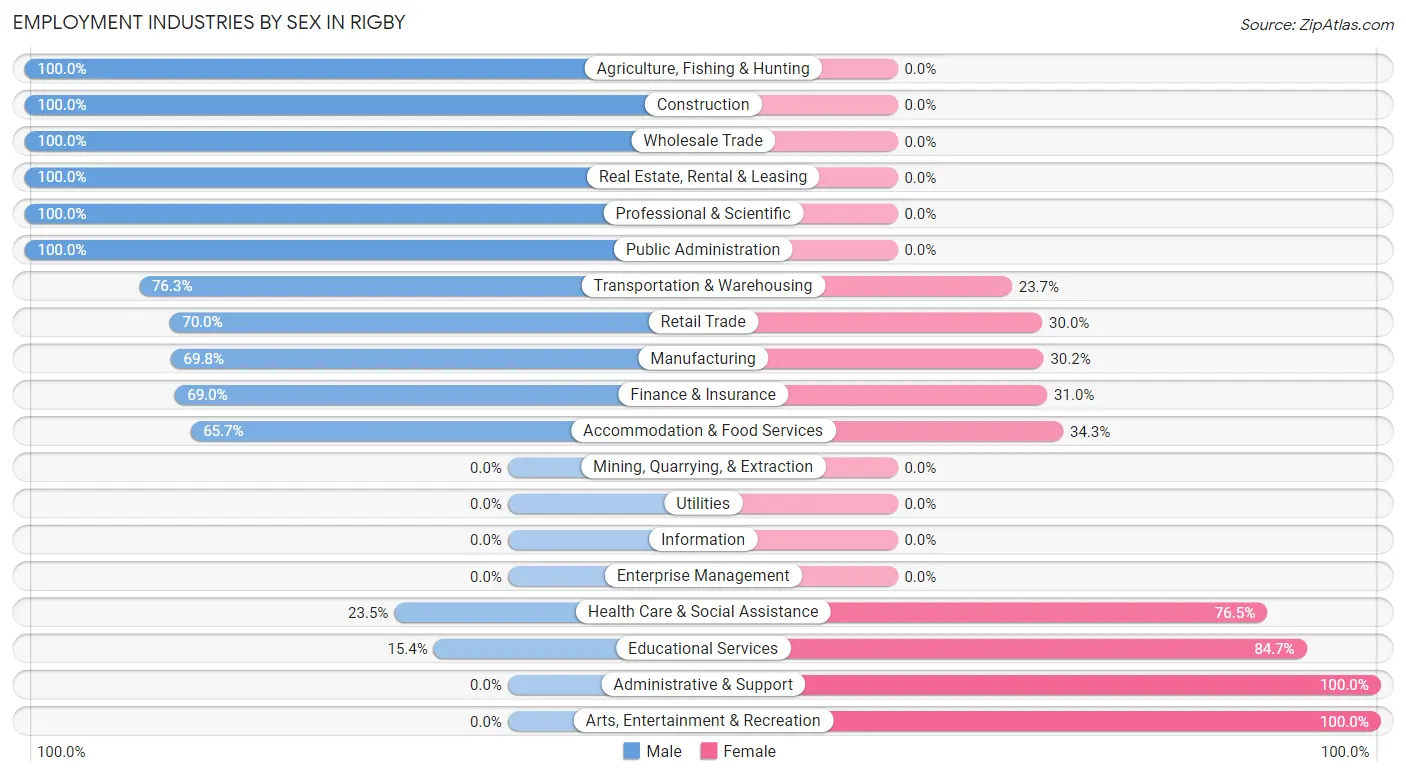
Employment Industries by Sex in Rigby
The Rigby industries that see more men than women are Agriculture, Fishing & Hunting (100.0%), Construction (100.0%), and Wholesale Trade (100.0%), whereas the industries that tend to have a higher number of women are Administrative & Support (100.0%), Arts, Entertainment & Recreation (100.0%), and Educational Services (84.7%).
| Industry | Male | Female |
| Agriculture, Fishing & Hunting | 10 (100.0%) | 0 (0.0%) |
| Mining, Quarrying, & Extraction | 0 (0.0%) | 0 (0.0%) |
| Construction | 373 (100.0%) | 0 (0.0%) |
| Manufacturing | 90 (69.8%) | 39 (30.2%) |
| Wholesale Trade | 52 (100.0%) | 0 (0.0%) |
| Retail Trade | 159 (70.0%) | 68 (30.0%) |
| Transportation & Warehousing | 58 (76.3%) | 18 (23.7%) |
| Utilities | 0 (0.0%) | 0 (0.0%) |
| Information | 0 (0.0%) | 0 (0.0%) |
| Finance & Insurance | 49 (69.0%) | 22 (31.0%) |
| Real Estate, Rental & Leasing | 55 (100.0%) | 0 (0.0%) |
| Professional & Scientific | 98 (100.0%) | 0 (0.0%) |
| Enterprise Management | 0 (0.0%) | 0 (0.0%) |
| Administrative & Support | 0 (0.0%) | 15 (100.0%) |
| Educational Services | 68 (15.3%) | 375 (84.7%) |
| Health Care & Social Assistance | 63 (23.5%) | 205 (76.5%) |
| Arts, Entertainment & Recreation | 0 (0.0%) | 12 (100.0%) |
| Accommodation & Food Services | 92 (65.7%) | 48 (34.3%) |
| Public Administration | 127 (100.0%) | 0 (0.0%) |
| Total | 1,385 (62.4%) | 836 (37.6%) |
Education in Rigby
School Enrollment in Rigby
The most common levels of schooling among the 1,546 students in Rigby are elementary school (353 | 22.8%), middle school (332 | 21.5%), and nursery / preschool (211 | 13.7%).
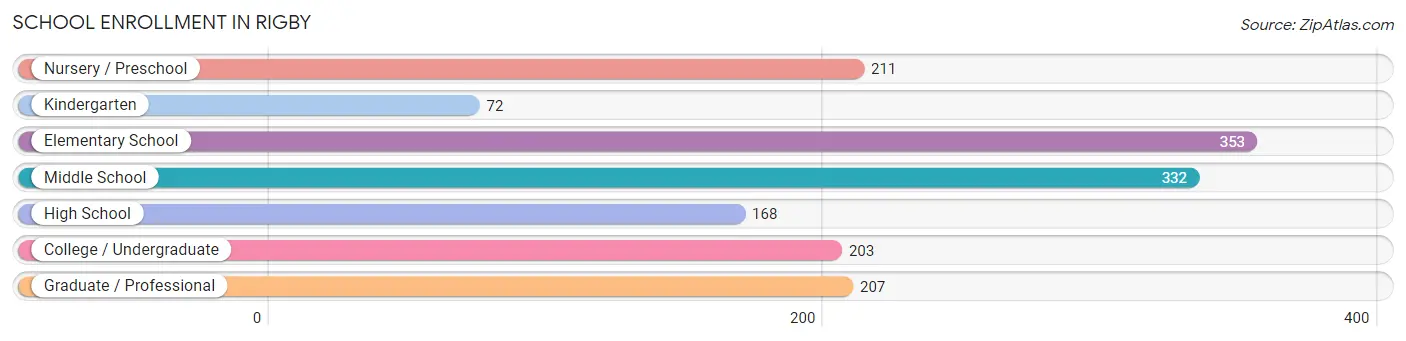
| School Level | # Students | % Students |
| Nursery / Preschool | 211 | 13.7% |
| Kindergarten | 72 | 4.7% |
| Elementary School | 353 | 22.8% |
| Middle School | 332 | 21.5% |
| High School | 168 | 10.9% |
| College / Undergraduate | 203 | 13.1% |
| Graduate / Professional | 207 | 13.4% |
| Total | 1,546 | 100.0% |
School Enrollment by Age by Funding Source in Rigby
Out of a total of 1,546 students who are enrolled in schools in Rigby, 337 (21.8%) attend a private institution, while the remaining 1,209 (78.2%) are enrolled in public schools. The age group of 35 years and over has the highest likelihood of being enrolled in private schools, with 31 (100.0% in the age bracket) enrolled. Conversely, the age group of 5 to 9 year old has the lowest likelihood of being enrolled in a private school, with 405 (100.0% in the age bracket) attending a public institution.
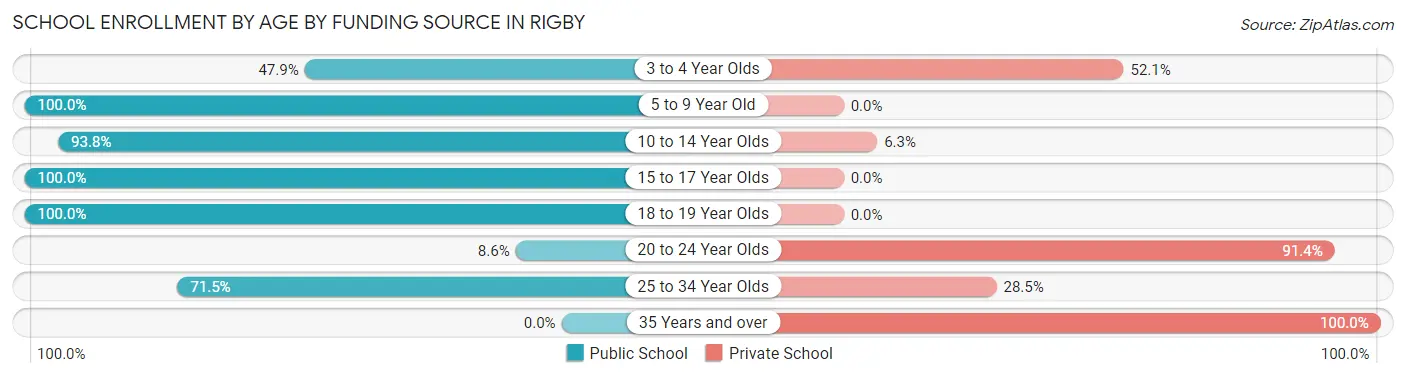
| Age Bracket | Public School | Private School |
| 3 to 4 Year Olds | 101 (47.9%) | 110 (52.1%) |
| 5 to 9 Year Old | 405 (100.0%) | 0 (0.0%) |
| 10 to 14 Year Olds | 330 (93.8%) | 22 (6.2%) |
| 15 to 17 Year Olds | 119 (100.0%) | 0 (0.0%) |
| 18 to 19 Year Olds | 49 (100.0%) | 0 (0.0%) |
| 20 to 24 Year Olds | 9 (8.6%) | 96 (91.4%) |
| 25 to 34 Year Olds | 196 (71.5%) | 78 (28.5%) |
| 35 Years and over | 0 (0.0%) | 31 (100.0%) |
| Total | 1,209 (78.2%) | 337 (21.8%) |
Educational Attainment by Field of Study in Rigby
Education (311 | 24.9%), science & technology (299 | 23.9%), bio, nature & agricultural (178 | 14.2%), business (82 | 6.6%), and arts & humanities (68 | 5.4%) are the most common fields of study among 1,251 individuals in Rigby who have obtained a bachelor's degree or higher.
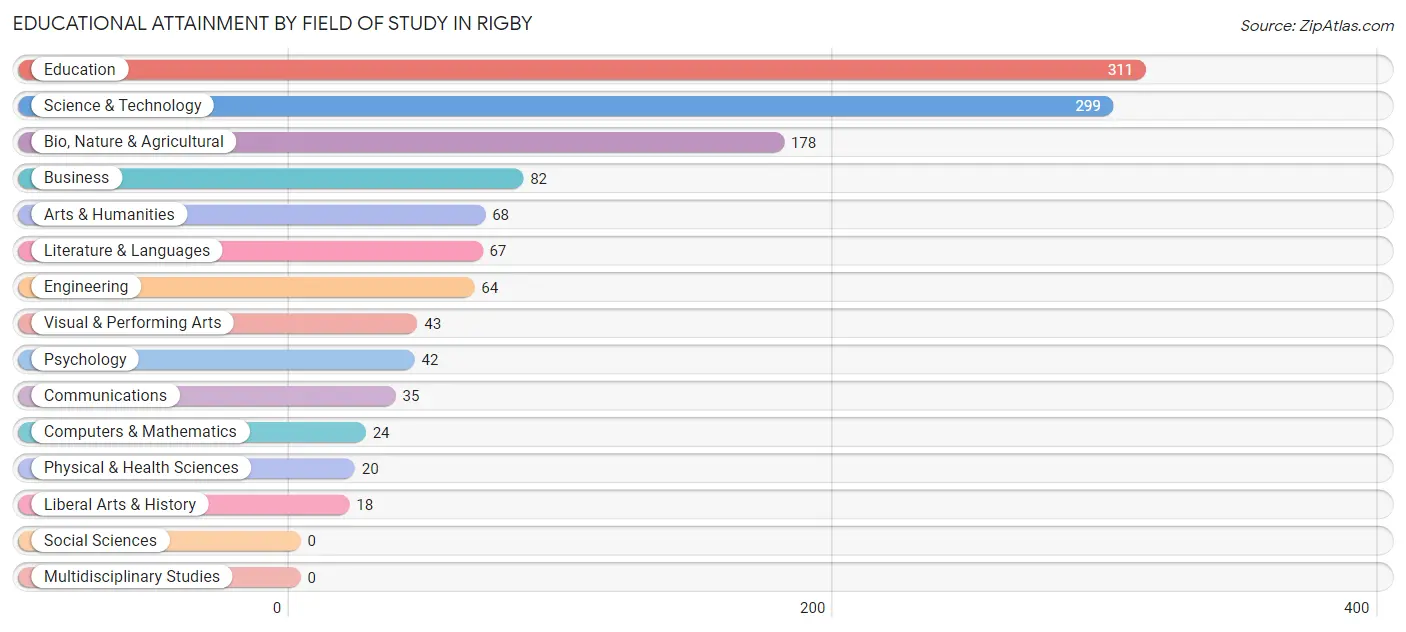
| Field of Study | # Graduates | % Graduates |
| Computers & Mathematics | 24 | 1.9% |
| Bio, Nature & Agricultural | 178 | 14.2% |
| Physical & Health Sciences | 20 | 1.6% |
| Psychology | 42 | 3.4% |
| Social Sciences | 0 | 0.0% |
| Engineering | 64 | 5.1% |
| Multidisciplinary Studies | 0 | 0.0% |
| Science & Technology | 299 | 23.9% |
| Business | 82 | 6.6% |
| Education | 311 | 24.9% |
| Literature & Languages | 67 | 5.4% |
| Liberal Arts & History | 18 | 1.4% |
| Visual & Performing Arts | 43 | 3.4% |
| Communications | 35 | 2.8% |
| Arts & Humanities | 68 | 5.4% |
| Total | 1,251 | 100.0% |
Transportation & Commute in Rigby
Vehicle Availability by Sex in Rigby
The most prevalent vehicle ownership categories in Rigby are males with 2 vehicles (766, accounting for 55.3%) and females with 2 vehicles (381, making up 92.8%).
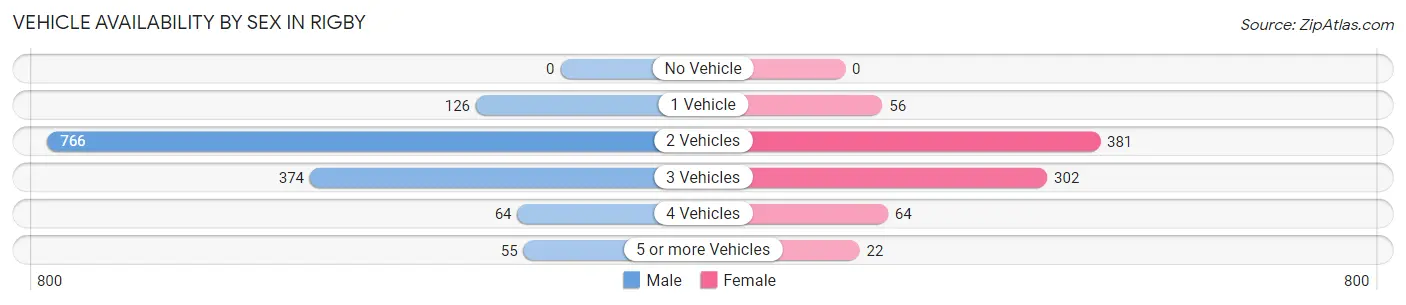
| Vehicles Available | Male | Female |
| No Vehicle | 0 (0.0%) | 0 (0.0%) |
| 1 Vehicle | 126 (9.1%) | 56 (6.8%) |
| 2 Vehicles | 766 (55.3%) | 381 (46.2%) |
| 3 Vehicles | 374 (27.0%) | 302 (36.6%) |
| 4 Vehicles | 64 (4.6%) | 64 (7.8%) |
| 5 or more Vehicles | 55 (4.0%) | 22 (2.7%) |
| Total | 1,385 (100.0%) | 825 (100.0%) |
Commute Time in Rigby
The most frequently occuring commute durations in Rigby are 20 to 24 minutes (637 commuters, 29.7%), 25 to 29 minutes (331 commuters, 15.4%), and less than 5 minutes (290 commuters, 13.5%).
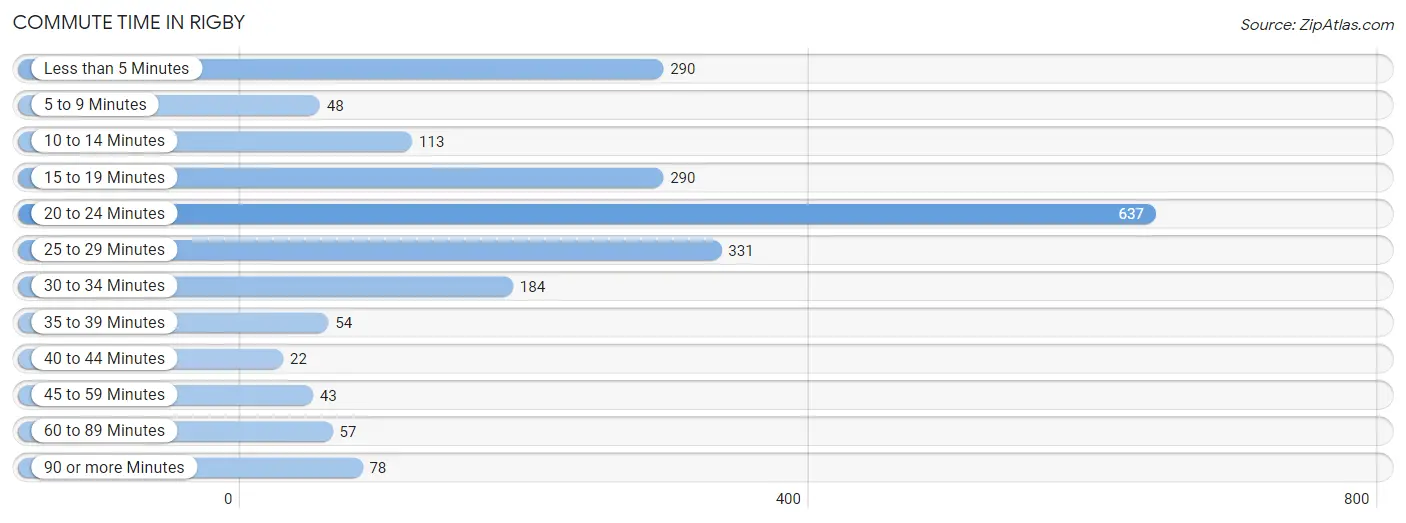
| Commute Time | # Commuters | % Commuters |
| Less than 5 Minutes | 290 | 13.5% |
| 5 to 9 Minutes | 48 | 2.2% |
| 10 to 14 Minutes | 113 | 5.3% |
| 15 to 19 Minutes | 290 | 13.5% |
| 20 to 24 Minutes | 637 | 29.7% |
| 25 to 29 Minutes | 331 | 15.4% |
| 30 to 34 Minutes | 184 | 8.6% |
| 35 to 39 Minutes | 54 | 2.5% |
| 40 to 44 Minutes | 22 | 1.0% |
| 45 to 59 Minutes | 43 | 2.0% |
| 60 to 89 Minutes | 57 | 2.6% |
| 90 or more Minutes | 78 | 3.6% |
Commute Time by Sex in Rigby
The most common commute times in Rigby are 20 to 24 minutes (421 commuters, 30.4%) for males and 20 to 24 minutes (216 commuters, 28.3%) for females.
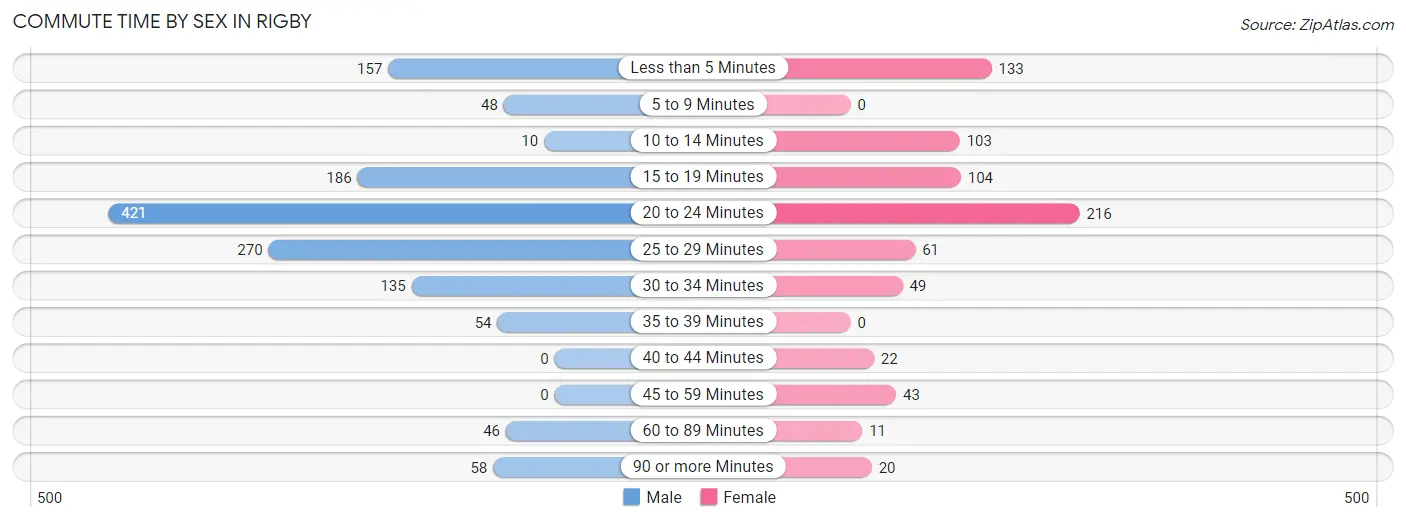
| Commute Time | Male | Female |
| Less than 5 Minutes | 157 (11.3%) | 133 (17.4%) |
| 5 to 9 Minutes | 48 (3.5%) | 0 (0.0%) |
| 10 to 14 Minutes | 10 (0.7%) | 103 (13.5%) |
| 15 to 19 Minutes | 186 (13.4%) | 104 (13.7%) |
| 20 to 24 Minutes | 421 (30.4%) | 216 (28.3%) |
| 25 to 29 Minutes | 270 (19.5%) | 61 (8.0%) |
| 30 to 34 Minutes | 135 (9.8%) | 49 (6.4%) |
| 35 to 39 Minutes | 54 (3.9%) | 0 (0.0%) |
| 40 to 44 Minutes | 0 (0.0%) | 22 (2.9%) |
| 45 to 59 Minutes | 0 (0.0%) | 43 (5.6%) |
| 60 to 89 Minutes | 46 (3.3%) | 11 (1.4%) |
| 90 or more Minutes | 58 (4.2%) | 20 (2.6%) |
Time of Departure to Work by Sex in Rigby
The most frequent times of departure to work in Rigby are 7:00 AM to 7:29 AM (391, 28.2%) for males and 8:30 AM to 8:59 AM (207, 27.2%) for females.
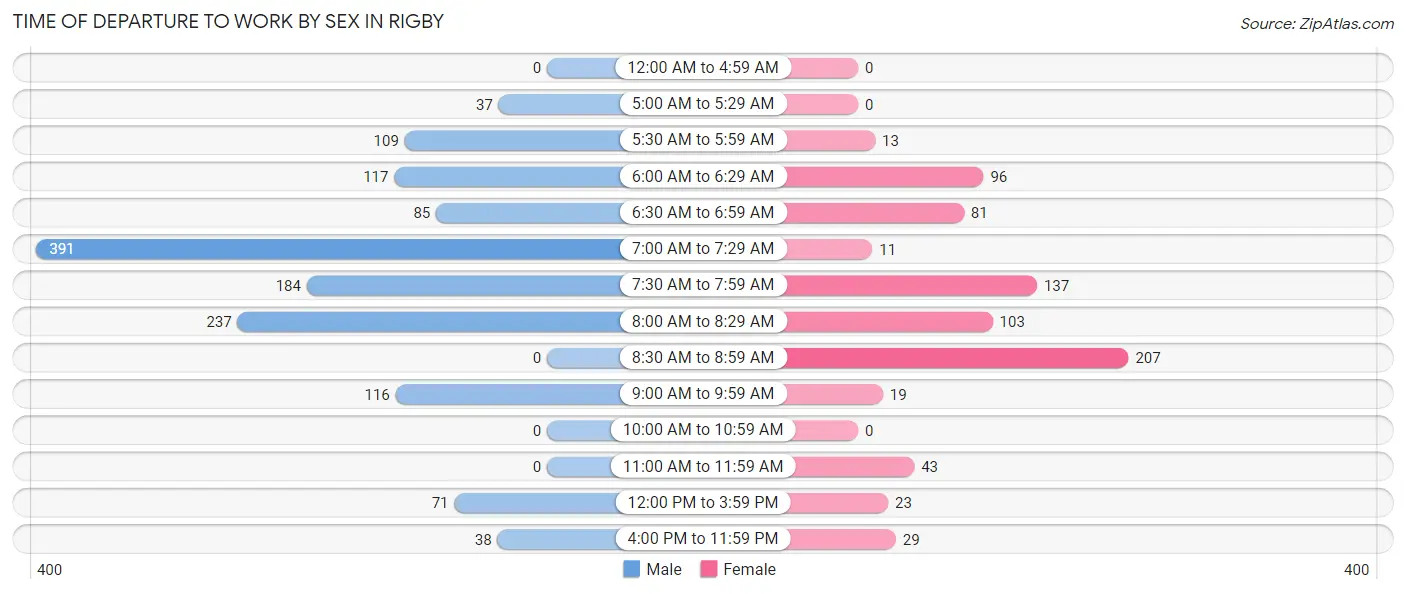
| Time of Departure | Male | Female |
| 12:00 AM to 4:59 AM | 0 (0.0%) | 0 (0.0%) |
| 5:00 AM to 5:29 AM | 37 (2.7%) | 0 (0.0%) |
| 5:30 AM to 5:59 AM | 109 (7.9%) | 13 (1.7%) |
| 6:00 AM to 6:29 AM | 117 (8.5%) | 96 (12.6%) |
| 6:30 AM to 6:59 AM | 85 (6.1%) | 81 (10.6%) |
| 7:00 AM to 7:29 AM | 391 (28.2%) | 11 (1.4%) |
| 7:30 AM to 7:59 AM | 184 (13.3%) | 137 (18.0%) |
| 8:00 AM to 8:29 AM | 237 (17.1%) | 103 (13.5%) |
| 8:30 AM to 8:59 AM | 0 (0.0%) | 207 (27.2%) |
| 9:00 AM to 9:59 AM | 116 (8.4%) | 19 (2.5%) |
| 10:00 AM to 10:59 AM | 0 (0.0%) | 0 (0.0%) |
| 11:00 AM to 11:59 AM | 0 (0.0%) | 43 (5.6%) |
| 12:00 PM to 3:59 PM | 71 (5.1%) | 23 (3.0%) |
| 4:00 PM to 11:59 PM | 38 (2.7%) | 29 (3.8%) |
| Total | 1,385 (100.0%) | 762 (100.0%) |
Housing Occupancy in Rigby
Occupancy by Ownership in Rigby
Of the total 1,845 dwellings in Rigby, owner-occupied units account for 1,323 (71.7%), while renter-occupied units make up 522 (28.3%).
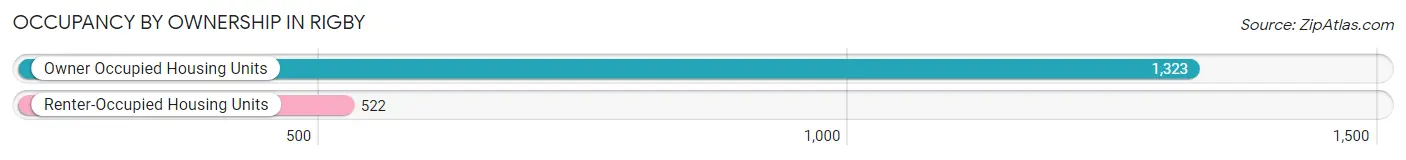
| Occupancy | # Housing Units | % Housing Units |
| Owner Occupied Housing Units | 1,323 | 71.7% |
| Renter-Occupied Housing Units | 522 | 28.3% |
| Total Occupied Housing Units | 1,845 | 100.0% |
Occupancy by Household Size in Rigby
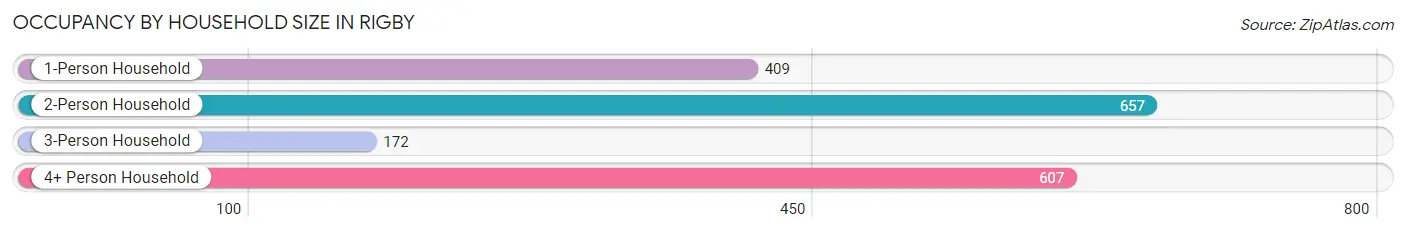
| Household Size | # Housing Units | % Housing Units |
| 1-Person Household | 409 | 22.2% |
| 2-Person Household | 657 | 35.6% |
| 3-Person Household | 172 | 9.3% |
| 4+ Person Household | 607 | 32.9% |
| Total Housing Units | 1,845 | 100.0% |
Occupancy by Ownership by Household Size in Rigby
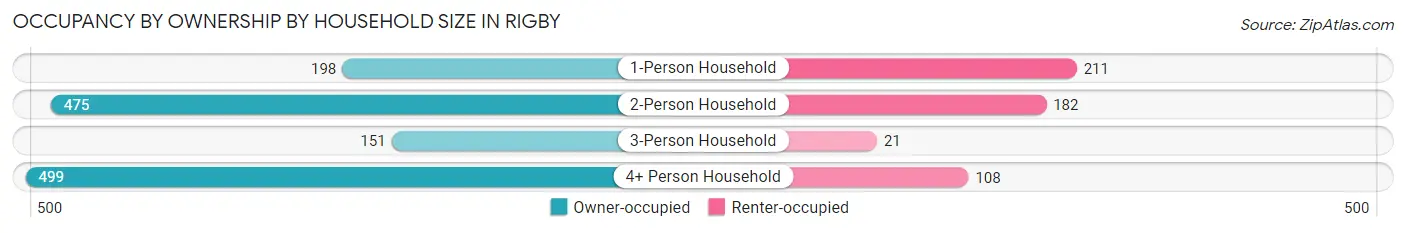
| Household Size | Owner-occupied | Renter-occupied |
| 1-Person Household | 198 (48.4%) | 211 (51.6%) |
| 2-Person Household | 475 (72.3%) | 182 (27.7%) |
| 3-Person Household | 151 (87.8%) | 21 (12.2%) |
| 4+ Person Household | 499 (82.2%) | 108 (17.8%) |
| Total Housing Units | 1,323 (71.7%) | 522 (28.3%) |
Occupancy by Educational Attainment in Rigby
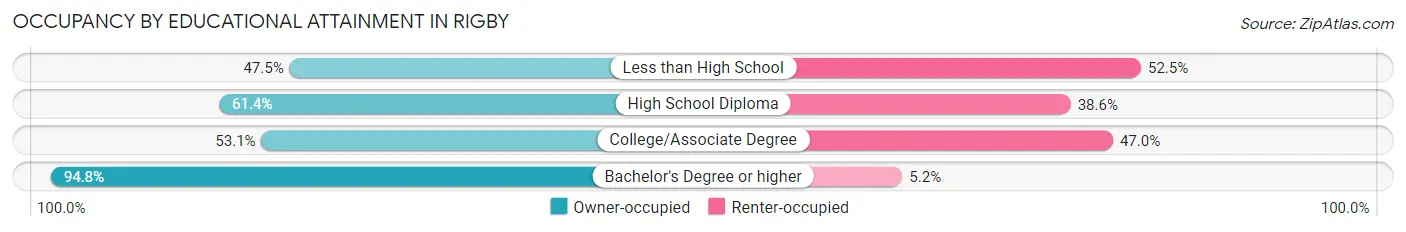
| Household Size | Owner-occupied | Renter-occupied |
| Less than High School | 66 (47.5%) | 73 (52.5%) |
| High School Diploma | 285 (61.4%) | 179 (38.6%) |
| College/Associate Degree | 261 (53.0%) | 231 (46.9%) |
| Bachelor's Degree or higher | 711 (94.8%) | 39 (5.2%) |
Occupancy by Age of Householder in Rigby
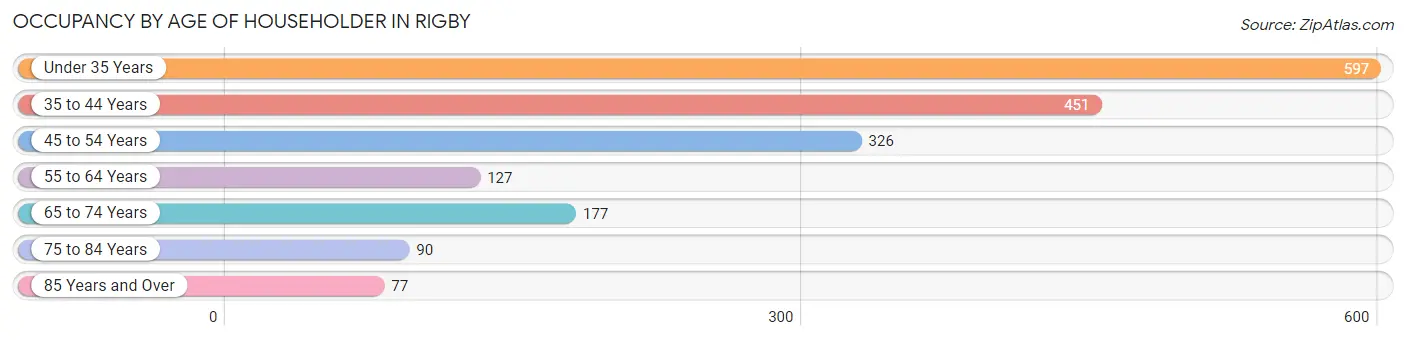
| Age Bracket | # Households | % Households |
| Under 35 Years | 597 | 32.4% |
| 35 to 44 Years | 451 | 24.4% |
| 45 to 54 Years | 326 | 17.7% |
| 55 to 64 Years | 127 | 6.9% |
| 65 to 74 Years | 177 | 9.6% |
| 75 to 84 Years | 90 | 4.9% |
| 85 Years and Over | 77 | 4.2% |
| Total | 1,845 | 100.0% |
Housing Finances in Rigby
Median Income by Occupancy in Rigby
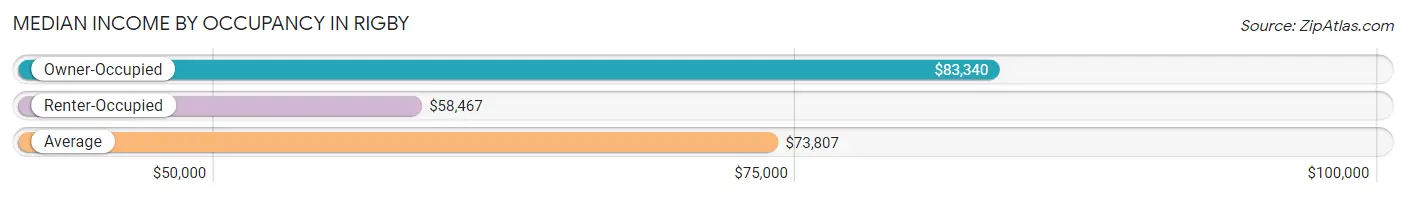
| Occupancy Type | # Households | Median Income |
| Owner-Occupied | 1,323 (71.7%) | $83,340 |
| Renter-Occupied | 522 (28.3%) | $58,467 |
| Average | 1,845 (100.0%) | $73,807 |
Occupancy by Householder Income Bracket in Rigby
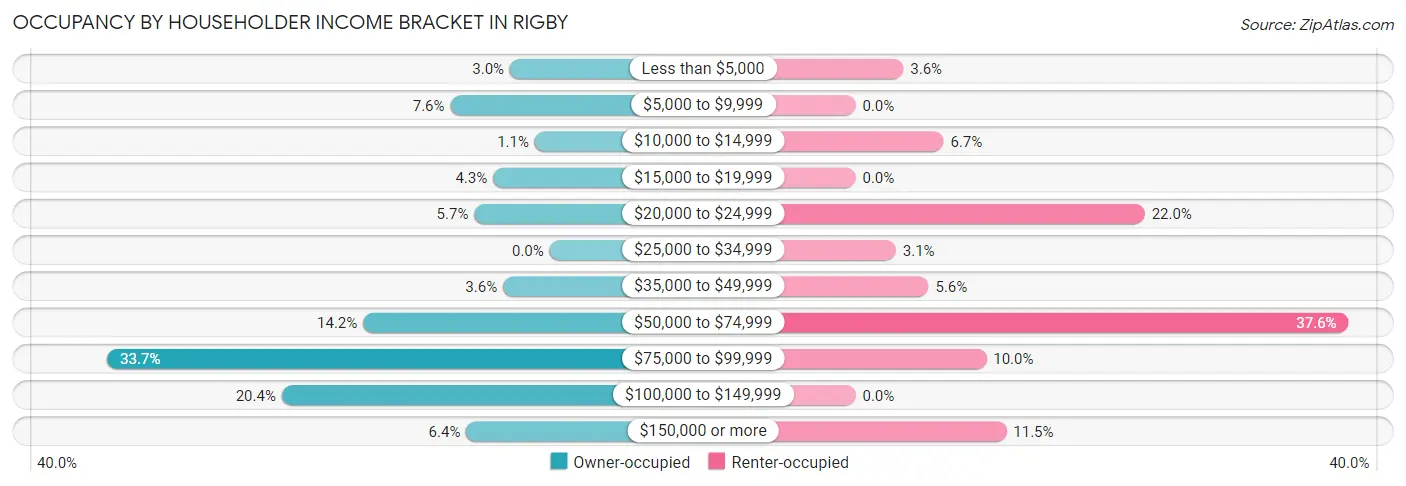
| Income Bracket | Owner-occupied | Renter-occupied |
| Less than $5,000 | 40 (3.0%) | 19 (3.6%) |
| $5,000 to $9,999 | 100 (7.6%) | 0 (0.0%) |
| $10,000 to $14,999 | 15 (1.1%) | 35 (6.7%) |
| $15,000 to $19,999 | 57 (4.3%) | 0 (0.0%) |
| $20,000 to $24,999 | 76 (5.7%) | 115 (22.0%) |
| $25,000 to $34,999 | 0 (0.0%) | 16 (3.1%) |
| $35,000 to $49,999 | 47 (3.5%) | 29 (5.6%) |
| $50,000 to $74,999 | 188 (14.2%) | 196 (37.6%) |
| $75,000 to $99,999 | 446 (33.7%) | 52 (10.0%) |
| $100,000 to $149,999 | 270 (20.4%) | 0 (0.0%) |
| $150,000 or more | 84 (6.4%) | 60 (11.5%) |
| Total | 1,323 (100.0%) | 522 (100.0%) |
Monthly Housing Cost Tiers in Rigby
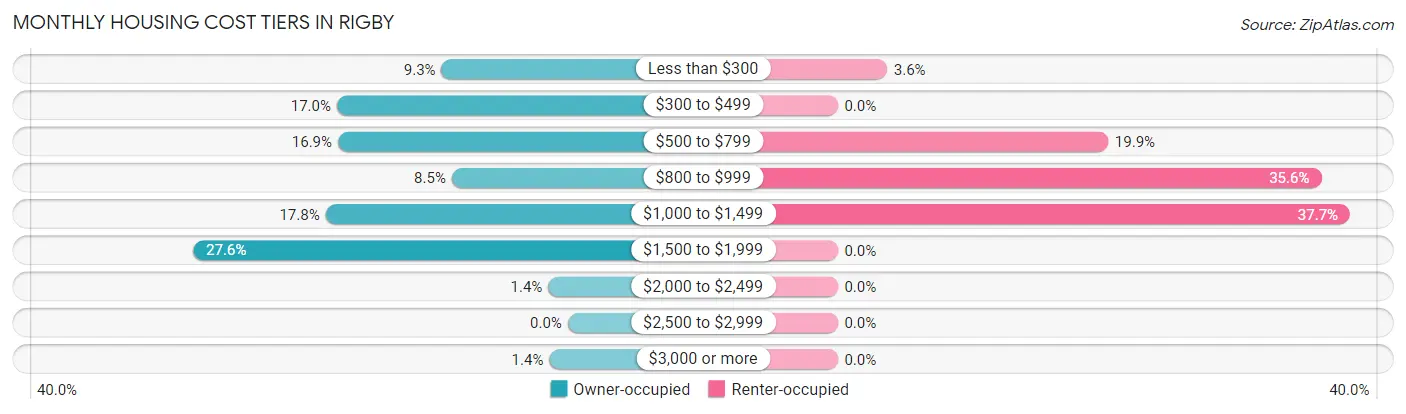
| Monthly Cost | Owner-occupied | Renter-occupied |
| Less than $300 | 123 (9.3%) | 19 (3.6%) |
| $300 to $499 | 225 (17.0%) | 0 (0.0%) |
| $500 to $799 | 224 (16.9%) | 104 (19.9%) |
| $800 to $999 | 113 (8.5%) | 186 (35.6%) |
| $1,000 to $1,499 | 236 (17.8%) | 197 (37.7%) |
| $1,500 to $1,999 | 365 (27.6%) | 0 (0.0%) |
| $2,000 to $2,499 | 19 (1.4%) | 0 (0.0%) |
| $2,500 to $2,999 | 0 (0.0%) | 0 (0.0%) |
| $3,000 or more | 18 (1.4%) | 0 (0.0%) |
| Total | 1,323 (100.0%) | 522 (100.0%) |
Physical Housing Characteristics in Rigby
Housing Structures in Rigby
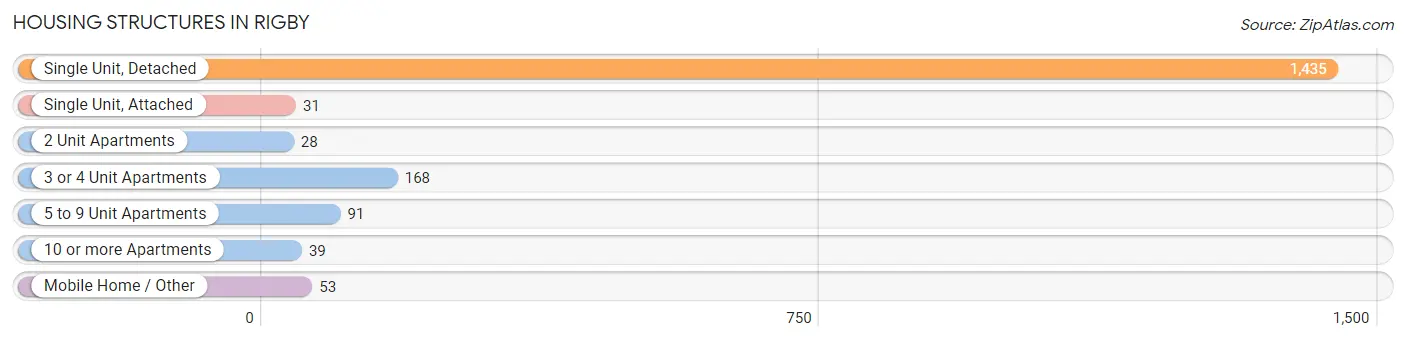
| Structure Type | # Housing Units | % Housing Units |
| Single Unit, Detached | 1,435 | 77.8% |
| Single Unit, Attached | 31 | 1.7% |
| 2 Unit Apartments | 28 | 1.5% |
| 3 or 4 Unit Apartments | 168 | 9.1% |
| 5 to 9 Unit Apartments | 91 | 4.9% |
| 10 or more Apartments | 39 | 2.1% |
| Mobile Home / Other | 53 | 2.9% |
| Total | 1,845 | 100.0% |
Housing Structures by Occupancy in Rigby
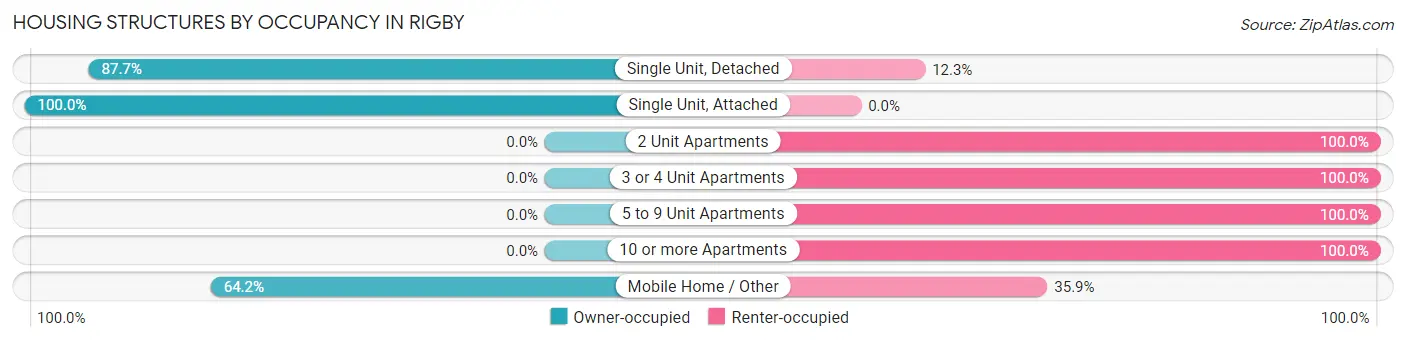
| Structure Type | Owner-occupied | Renter-occupied |
| Single Unit, Detached | 1,258 (87.7%) | 177 (12.3%) |
| Single Unit, Attached | 31 (100.0%) | 0 (0.0%) |
| 2 Unit Apartments | 0 (0.0%) | 28 (100.0%) |
| 3 or 4 Unit Apartments | 0 (0.0%) | 168 (100.0%) |
| 5 to 9 Unit Apartments | 0 (0.0%) | 91 (100.0%) |
| 10 or more Apartments | 0 (0.0%) | 39 (100.0%) |
| Mobile Home / Other | 34 (64.1%) | 19 (35.8%) |
| Total | 1,323 (71.7%) | 522 (28.3%) |
Housing Structures by Number of Rooms in Rigby
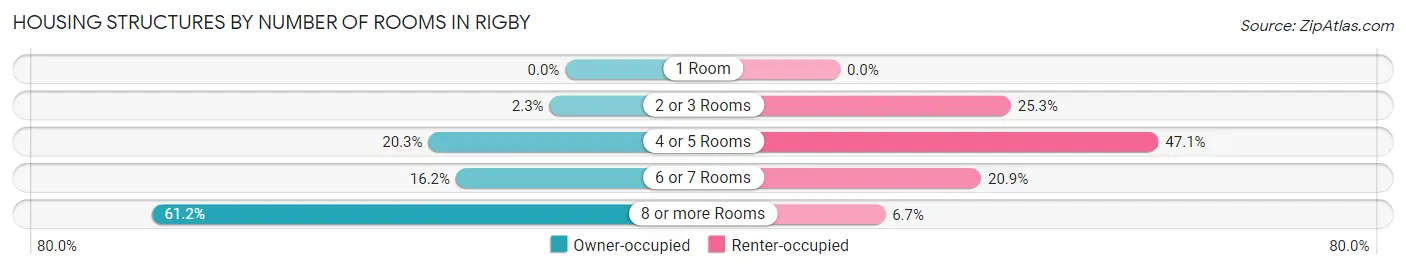
| Number of Rooms | Owner-occupied | Renter-occupied |
| 1 Room | 0 (0.0%) | 0 (0.0%) |
| 2 or 3 Rooms | 31 (2.3%) | 132 (25.3%) |
| 4 or 5 Rooms | 268 (20.3%) | 246 (47.1%) |
| 6 or 7 Rooms | 214 (16.2%) | 109 (20.9%) |
| 8 or more Rooms | 810 (61.2%) | 35 (6.7%) |
| Total | 1,323 (100.0%) | 522 (100.0%) |
Housing Structure by Heating Type in Rigby
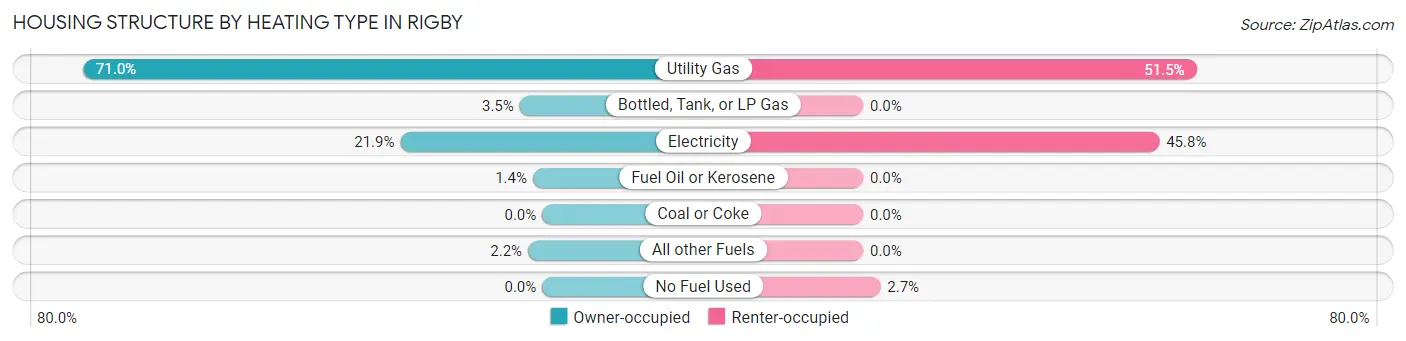
| Heating Type | Owner-occupied | Renter-occupied |
| Utility Gas | 939 (71.0%) | 269 (51.5%) |
| Bottled, Tank, or LP Gas | 46 (3.5%) | 0 (0.0%) |
| Electricity | 290 (21.9%) | 239 (45.8%) |
| Fuel Oil or Kerosene | 19 (1.4%) | 0 (0.0%) |
| Coal or Coke | 0 (0.0%) | 0 (0.0%) |
| All other Fuels | 29 (2.2%) | 0 (0.0%) |
| No Fuel Used | 0 (0.0%) | 14 (2.7%) |
| Total | 1,323 (100.0%) | 522 (100.0%) |
Household Vehicle Usage in Rigby
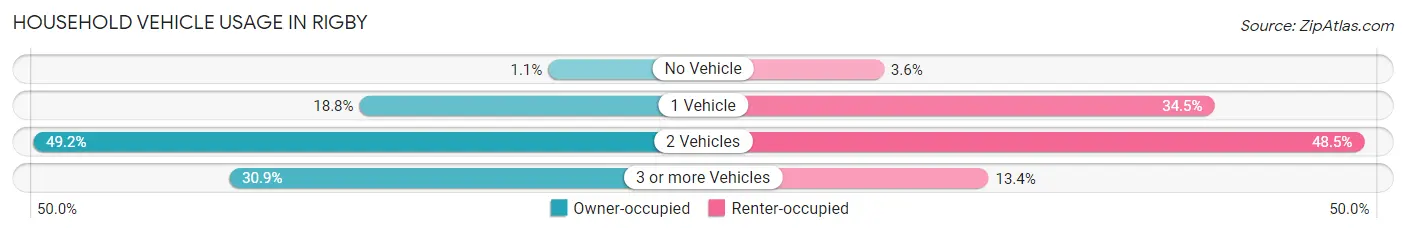
| Vehicles per Household | Owner-occupied | Renter-occupied |
| No Vehicle | 15 (1.1%) | 19 (3.6%) |
| 1 Vehicle | 248 (18.8%) | 180 (34.5%) |
| 2 Vehicles | 651 (49.2%) | 253 (48.5%) |
| 3 or more Vehicles | 409 (30.9%) | 70 (13.4%) |
| Total | 1,323 (100.0%) | 522 (100.0%) |
Real Estate & Mortgages in Rigby
Real Estate and Mortgage Overview in Rigby
| Characteristic | Without Mortgage | With Mortgage |
| Housing Units | 463 | 860 |
| Median Property Value | $172,000 | $262,000 |
| Median Household Income | $76,193 | $66 |
| Monthly Housing Costs | $425 | $18 |
| Real Estate Taxes | $1,423 | $48 |
Property Value by Mortgage Status in Rigby
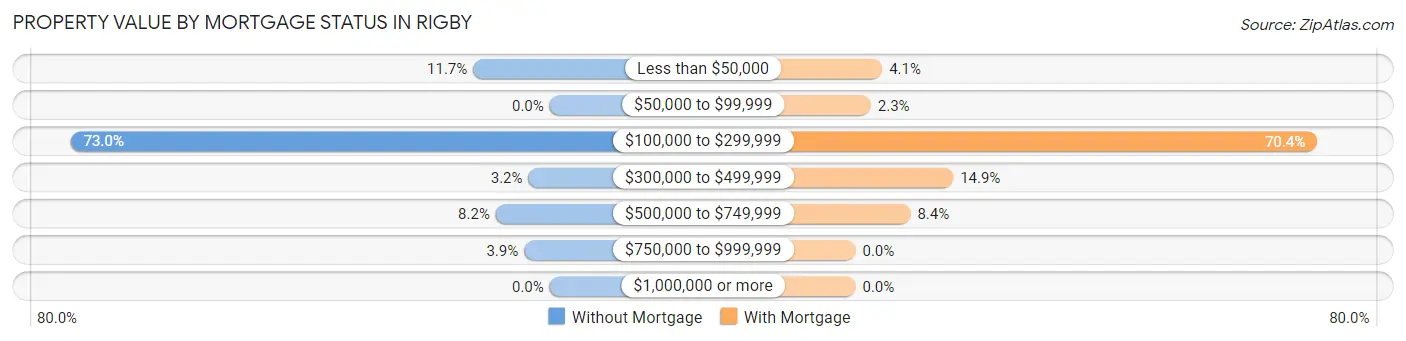
| Property Value | Without Mortgage | With Mortgage |
| Less than $50,000 | 54 (11.7%) | 35 (4.1%) |
| $50,000 to $99,999 | 0 (0.0%) | 20 (2.3%) |
| $100,000 to $299,999 | 338 (73.0%) | 605 (70.4%) |
| $300,000 to $499,999 | 15 (3.2%) | 128 (14.9%) |
| $500,000 to $749,999 | 38 (8.2%) | 72 (8.4%) |
| $750,000 to $999,999 | 18 (3.9%) | 0 (0.0%) |
| $1,000,000 or more | 0 (0.0%) | 0 (0.0%) |
| Total | 463 (100.0%) | 860 (100.0%) |
Household Income by Mortgage Status in Rigby
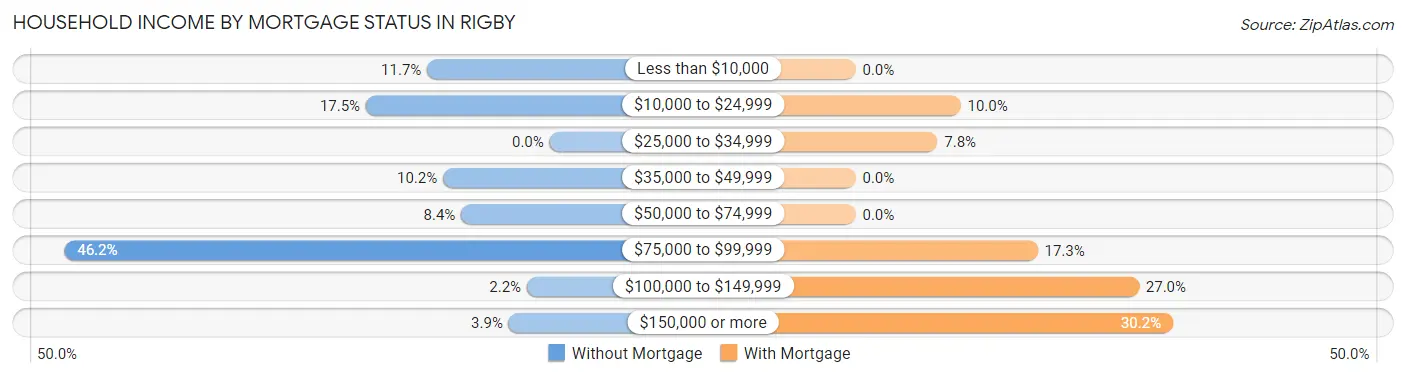
| Household Income | Without Mortgage | With Mortgage |
| Less than $10,000 | 54 (11.7%) | 0 (0.0%) |
| $10,000 to $24,999 | 81 (17.5%) | 86 (10.0%) |
| $25,000 to $34,999 | 0 (0.0%) | 67 (7.8%) |
| $35,000 to $49,999 | 47 (10.2%) | 0 (0.0%) |
| $50,000 to $74,999 | 39 (8.4%) | 0 (0.0%) |
| $75,000 to $99,999 | 214 (46.2%) | 149 (17.3%) |
| $100,000 to $149,999 | 10 (2.2%) | 232 (27.0%) |
| $150,000 or more | 18 (3.9%) | 260 (30.2%) |
| Total | 463 (100.0%) | 860 (100.0%) |
Property Value to Household Income Ratio in Rigby
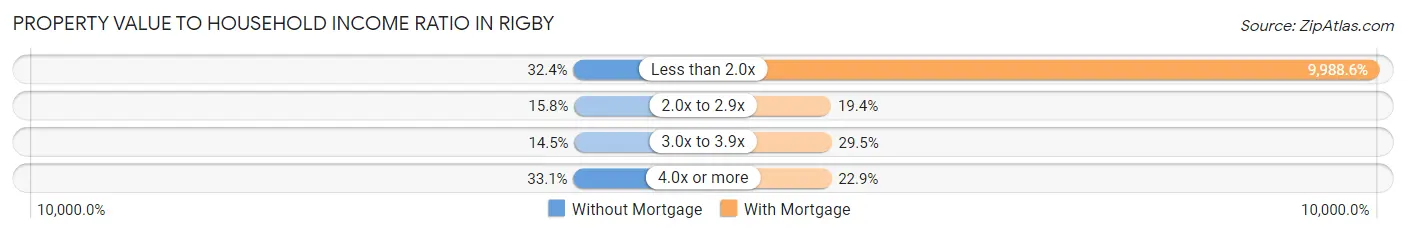
| Value-to-Income Ratio | Without Mortgage | With Mortgage |
| Less than 2.0x | 150 (32.4%) | 85,902 (9,988.6%) |
| 2.0x to 2.9x | 73 (15.8%) | 167 (19.4%) |
| 3.0x to 3.9x | 67 (14.5%) | 254 (29.5%) |
| 4.0x or more | 153 (33.1%) | 197 (22.9%) |
| Total | 463 (100.0%) | 860 (100.0%) |
Real Estate Taxes by Mortgage Status in Rigby
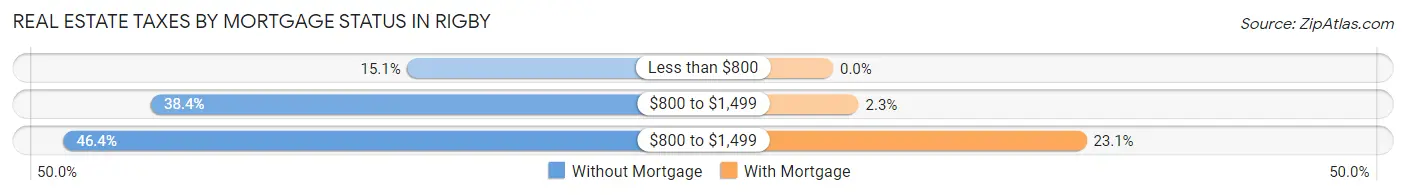
| Property Taxes | Without Mortgage | With Mortgage |
| Less than $800 | 70 (15.1%) | 0 (0.0%) |
| $800 to $1,499 | 178 (38.4%) | 20 (2.3%) |
| $800 to $1,499 | 215 (46.4%) | 199 (23.1%) |
| Total | 463 (100.0%) | 860 (100.0%) |
Health & Disability in Rigby
Health Insurance Coverage by Age in Rigby
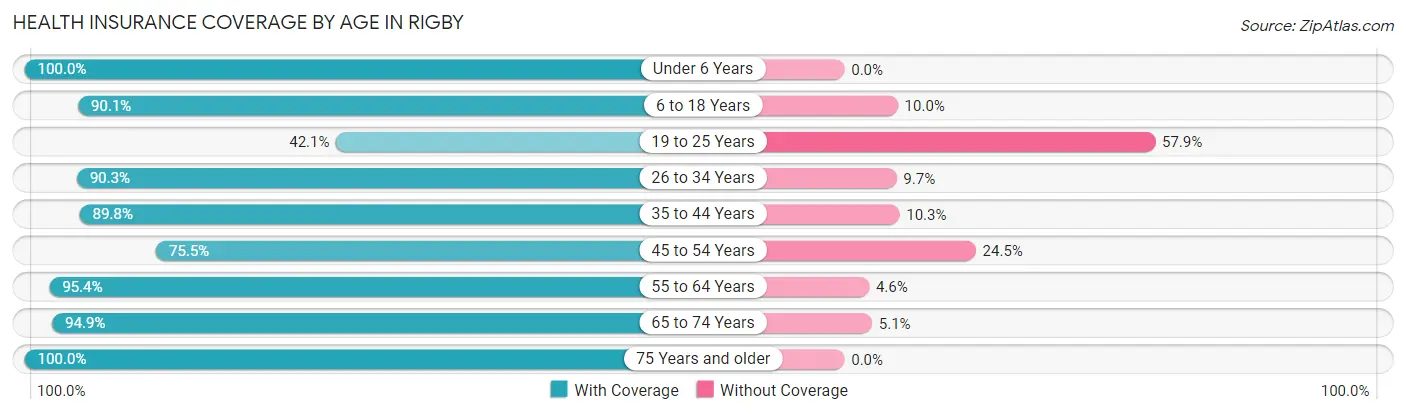
| Age Bracket | With Coverage | Without Coverage |
| Under 6 Years | 829 (100.0%) | 0 (0.0%) |
| 6 to 18 Years | 833 (90.0%) | 92 (10.0%) |
| 19 to 25 Years | 204 (42.1%) | 281 (57.9%) |
| 26 to 34 Years | 762 (90.3%) | 82 (9.7%) |
| 35 to 44 Years | 578 (89.7%) | 66 (10.2%) |
| 45 to 54 Years | 379 (75.5%) | 123 (24.5%) |
| 55 to 64 Years | 249 (95.4%) | 12 (4.6%) |
| 65 to 74 Years | 332 (94.9%) | 18 (5.1%) |
| 75 Years and older | 191 (100.0%) | 0 (0.0%) |
| Total | 4,357 (86.6%) | 674 (13.4%) |
Health Insurance Coverage by Citizenship Status in Rigby
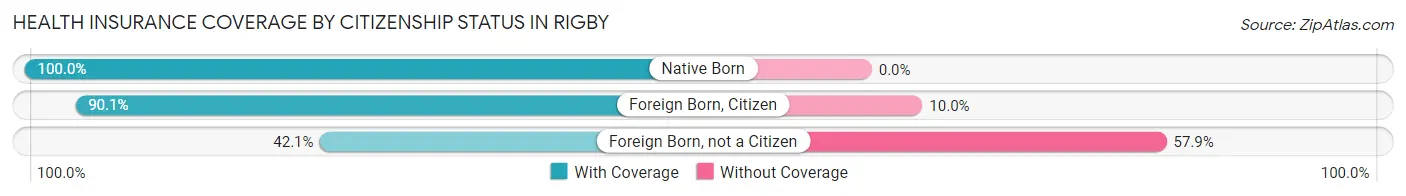
| Citizenship Status | With Coverage | Without Coverage |
| Native Born | 829 (100.0%) | 0 (0.0%) |
| Foreign Born, Citizen | 833 (90.0%) | 92 (10.0%) |
| Foreign Born, not a Citizen | 204 (42.1%) | 281 (57.9%) |
Health Insurance Coverage by Household Income in Rigby
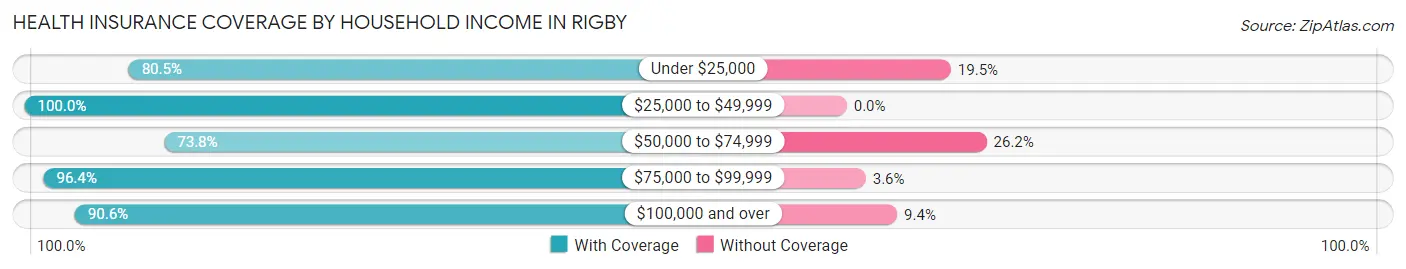
| Household Income | With Coverage | Without Coverage |
| Under $25,000 | 792 (80.5%) | 192 (19.5%) |
| $25,000 to $49,999 | 135 (100.0%) | 0 (0.0%) |
| $50,000 to $74,999 | 854 (73.8%) | 303 (26.2%) |
| $75,000 to $99,999 | 1,328 (96.4%) | 49 (3.6%) |
| $100,000 and over | 1,248 (90.6%) | 130 (9.4%) |
Public vs Private Health Insurance Coverage by Age in Rigby
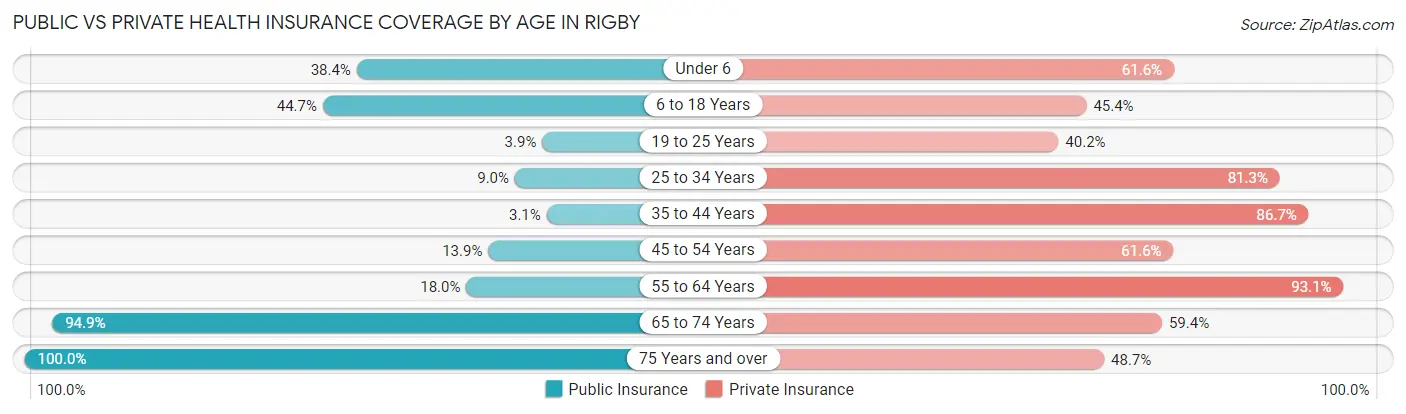
| Age Bracket | Public Insurance | Private Insurance |
| Under 6 | 318 (38.4%) | 511 (61.6%) |
| 6 to 18 Years | 413 (44.7%) | 420 (45.4%) |
| 19 to 25 Years | 19 (3.9%) | 195 (40.2%) |
| 25 to 34 Years | 76 (9.0%) | 686 (81.3%) |
| 35 to 44 Years | 20 (3.1%) | 558 (86.7%) |
| 45 to 54 Years | 70 (13.9%) | 309 (61.6%) |
| 55 to 64 Years | 47 (18.0%) | 243 (93.1%) |
| 65 to 74 Years | 332 (94.9%) | 208 (59.4%) |
| 75 Years and over | 191 (100.0%) | 93 (48.7%) |
| Total | 1,486 (29.5%) | 3,223 (64.1%) |
Disability Status by Sex by Age in Rigby
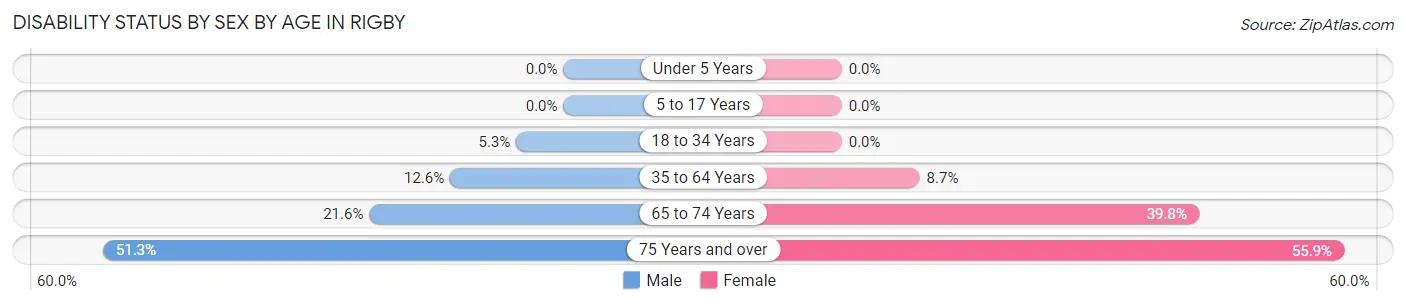
| Age Bracket | Male | Female |
| Under 5 Years | 0 (0.0%) | 0 (0.0%) |
| 5 to 17 Years | 0 (0.0%) | 0 (0.0%) |
| 18 to 34 Years | 39 (5.3%) | 0 (0.0%) |
| 35 to 64 Years | 96 (12.6%) | 56 (8.7%) |
| 65 to 74 Years | 24 (21.6%) | 95 (39.8%) |
| 75 Years and over | 20 (51.3%) | 85 (55.9%) |
Disability Class by Sex by Age in Rigby
Disability Class: Hearing Difficulty
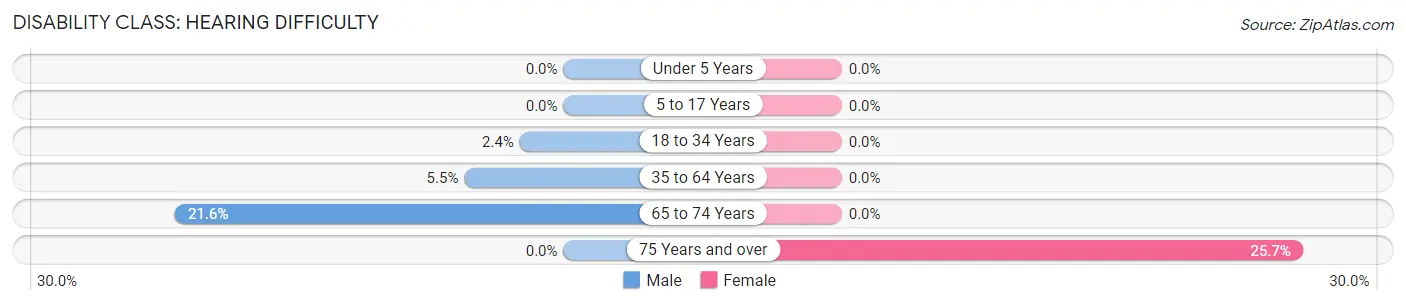
| Age Bracket | Male | Female |
| Under 5 Years | 0 (0.0%) | 0 (0.0%) |
| 5 to 17 Years | 0 (0.0%) | 0 (0.0%) |
| 18 to 34 Years | 18 (2.4%) | 0 (0.0%) |
| 35 to 64 Years | 42 (5.5%) | 0 (0.0%) |
| 65 to 74 Years | 24 (21.6%) | 0 (0.0%) |
| 75 Years and over | 0 (0.0%) | 39 (25.7%) |
Disability Class: Vision Difficulty
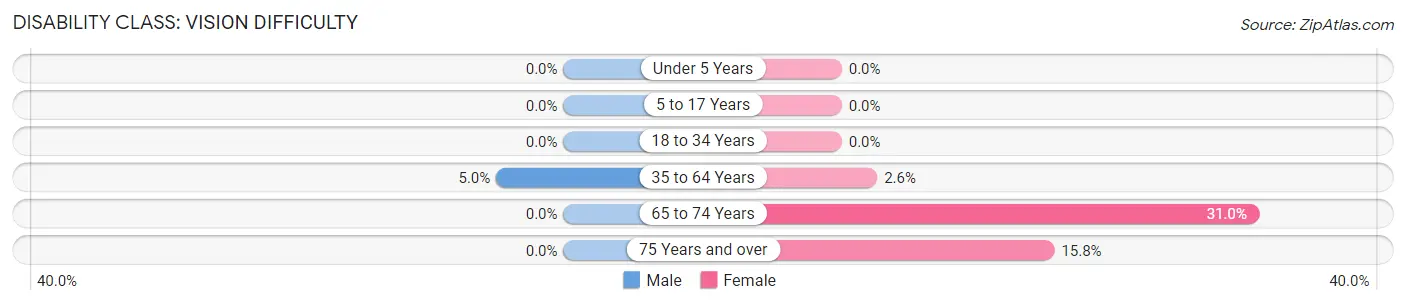
| Age Bracket | Male | Female |
| Under 5 Years | 0 (0.0%) | 0 (0.0%) |
| 5 to 17 Years | 0 (0.0%) | 0 (0.0%) |
| 18 to 34 Years | 0 (0.0%) | 0 (0.0%) |
| 35 to 64 Years | 38 (5.0%) | 17 (2.6%) |
| 65 to 74 Years | 0 (0.0%) | 74 (31.0%) |
| 75 Years and over | 0 (0.0%) | 24 (15.8%) |
Disability Class: Cognitive Difficulty
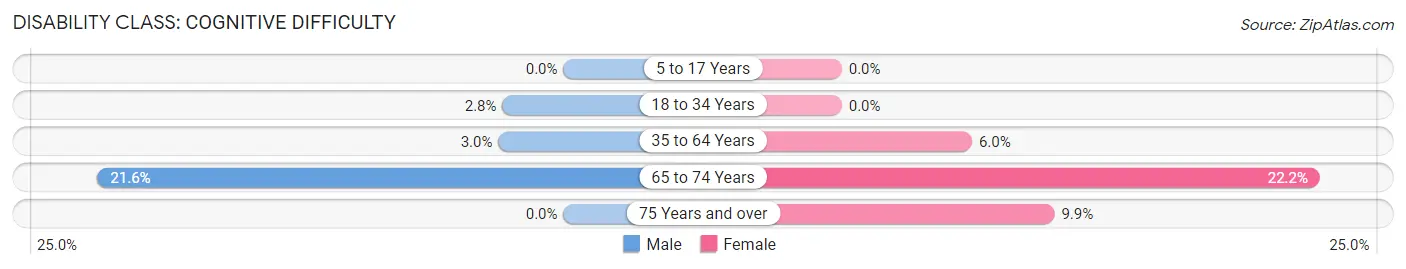
| Age Bracket | Male | Female |
| 5 to 17 Years | 0 (0.0%) | 0 (0.0%) |
| 18 to 34 Years | 21 (2.8%) | 0 (0.0%) |
| 35 to 64 Years | 23 (3.0%) | 39 (6.0%) |
| 65 to 74 Years | 24 (21.6%) | 53 (22.2%) |
| 75 Years and over | 0 (0.0%) | 15 (9.9%) |
Disability Class: Ambulatory Difficulty
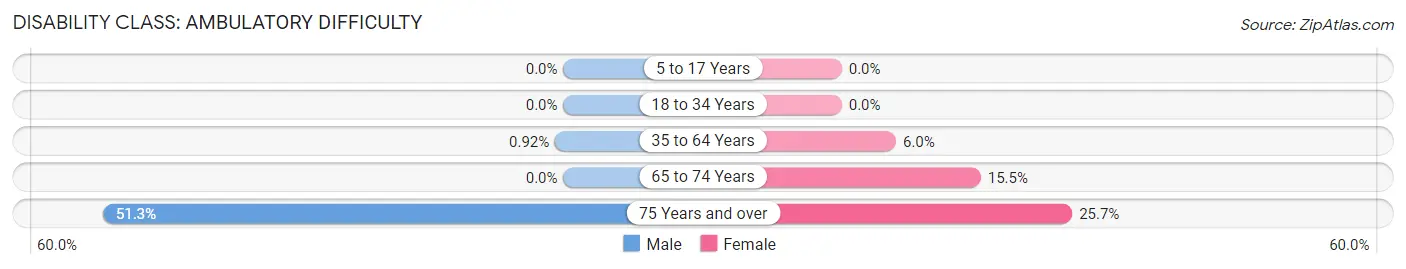
| Age Bracket | Male | Female |
| 5 to 17 Years | 0 (0.0%) | 0 (0.0%) |
| 18 to 34 Years | 0 (0.0%) | 0 (0.0%) |
| 35 to 64 Years | 7 (0.9%) | 39 (6.0%) |
| 65 to 74 Years | 0 (0.0%) | 37 (15.5%) |
| 75 Years and over | 20 (51.3%) | 39 (25.7%) |
Disability Class: Self-Care Difficulty
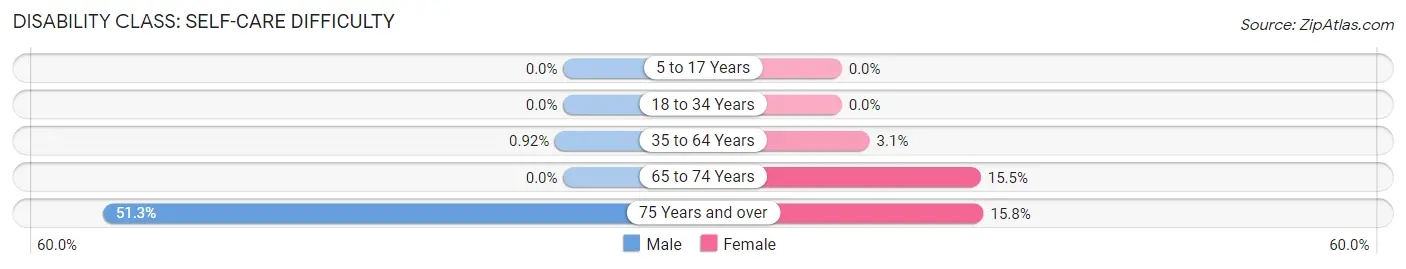
| Age Bracket | Male | Female |
| 5 to 17 Years | 0 (0.0%) | 0 (0.0%) |
| 18 to 34 Years | 0 (0.0%) | 0 (0.0%) |
| 35 to 64 Years | 7 (0.9%) | 20 (3.1%) |
| 65 to 74 Years | 0 (0.0%) | 37 (15.5%) |
| 75 Years and over | 20 (51.3%) | 24 (15.8%) |
Technology Access in Rigby
Computing Device Access in Rigby
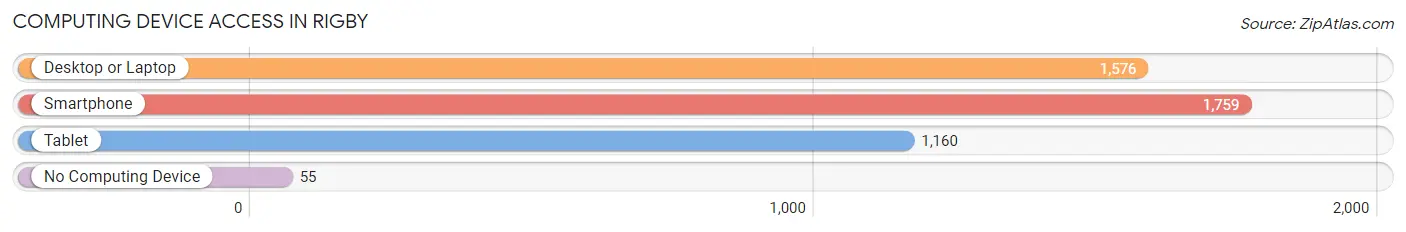
| Device Type | # Households | % Households |
| Desktop or Laptop | 1,576 | 85.4% |
| Smartphone | 1,759 | 95.3% |
| Tablet | 1,160 | 62.9% |
| No Computing Device | 55 | 3.0% |
| Total | 1,845 | 100.0% |
Internet Access in Rigby
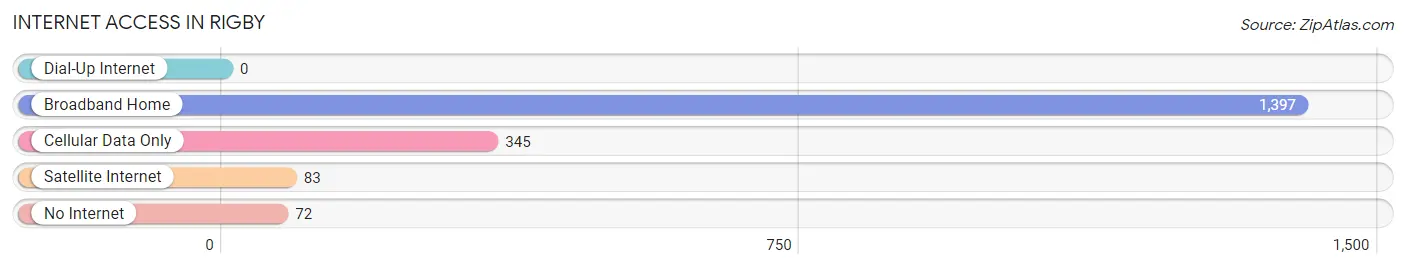
| Internet Type | # Households | % Households |
| Dial-Up Internet | 0 | 0.0% |
| Broadband Home | 1,397 | 75.7% |
| Cellular Data Only | 345 | 18.7% |
| Satellite Internet | 83 | 4.5% |
| No Internet | 72 | 3.9% |
| Total | 1,845 | 100.0% |
Rigby Summary
Rigby, Idaho is a small city located in Jefferson County, Idaho. It is situated in the southeastern part of the state, about 20 miles east of Idaho Falls. The city was founded in 1883 and named after William F. Rigby, a prominent local businessman. As of the 2010 census, the population of Rigby was 3,945.
Geography
Rigby is located at an elevation of 4,890 feet above sea level. It is situated in the Snake River Plain, a large area of flat land that stretches across southern Idaho. The city is surrounded by rolling hills and farmland. The Snake River is located about 10 miles to the west of Rigby.
Climate
Rigby has a semi-arid climate, with hot summers and cold winters. The average high temperature in July is 90°F, and the average low temperature in January is 17°F. The city receives an average of 13 inches of precipitation per year, most of which falls in the form of snow.
Demographics
As of the 2010 census, the population of Rigby was 3,945. The racial makeup of the city was 95.3% White, 0.3% African American, 0.7% Native American, 0.4% Asian, 0.1% Pacific Islander, 1.2% from other races, and 2.0% from two or more races. Hispanic or Latino of any race were 3.2% of the population.
Economy
Rigby’s economy is largely based on agriculture and manufacturing. The city is home to several large farms, as well as several food processing plants. The city is also home to several small businesses, including restaurants, retail stores, and service providers.
Education
Rigby is served by the Jefferson School District. The district operates two elementary schools, one middle school, and one high school. The city is also home to a branch of Idaho State University, which offers a variety of undergraduate and graduate degree programs.
Transportation
Rigby is served by the Idaho Falls Regional Airport, which is located about 20 miles to the west of the city. The city is also served by several major highways, including Interstate 15, US Highway 20, and US Highway 26.
Conclusion
Rigby, Idaho is a small city located in Jefferson County, Idaho. It is situated in the southeastern part of the state, about 20 miles east of Idaho Falls. The city was founded in 1883 and named after William F. Rigby, a prominent local businessman. As of the 2010 census, the population of Rigby was 3,945. The city has a semi-arid climate, with hot summers and cold winters. The economy of Rigby is largely based on agriculture and manufacturing, and the city is served by the Jefferson School District. Rigby is also served by the Idaho Falls Regional Airport and several major highways.
Common Questions
What is Per Capita Income in Rigby?
Per Capita income in Rigby is $26,951.
What is the Median Family Income in Rigby?
Median Family Income in Rigby is $80,469.
What is the Median Household income in Rigby?
Median Household Income in Rigby is $73,807.
What is Income or Wage Gap in Rigby?
Income or Wage Gap in Rigby is 40.9%.
Women in Rigby earn 59.1 cents for every dollar earned by a man.
What is Inequality or Gini Index in Rigby?
Inequality or Gini Index in Rigby is 0.36.
What is the Total Population of Rigby?
Total Population of Rigby is 5,097.
What is the Total Male Population of Rigby?
Total Male Population of Rigby is 2,498.
What is the Total Female Population of Rigby?
Total Female Population of Rigby is 2,599.
What is the Ratio of Males per 100 Females in Rigby?
There are 96.11 Males per 100 Females in Rigby.
What is the Ratio of Females per 100 Males in Rigby?
There are 104.04 Females per 100 Males in Rigby.
What is the Median Population Age in Rigby?
Median Population Age in Rigby is 28.9 Years.
What is the Average Family Size in Rigby
Average Family Size in Rigby is 3.3 People.
What is the Average Household Size in Rigby
Average Household Size in Rigby is 2.7 People.
How Large is the Labor Force in Rigby?
There are 2,272 People in the Labor Forcein in Rigby.
What is the Percentage of People in the Labor Force in Rigby?
65.6% of People are in the Labor Force in Rigby.
What is the Unemployment Rate in Rigby?
Unemployment Rate in Rigby is 2.2%.