Mccall, ID Map & Demographics
Mccall Map
Mccall Overview
$45,117
PER CAPITA INCOME
$124,286
AVG FAMILY INCOME
$57,788
AVG HOUSEHOLD INCOME
46.2%
WAGE / INCOME GAP [ % ]
53.8¢/ $1
WAGE / INCOME GAP [ $ ]
0.54
INEQUALITY / GINI INDEX
3,731
TOTAL POPULATION
2,180
MALE POPULATION
1,551
FEMALE POPULATION
140.55
MALES / 100 FEMALES
71.15
FEMALES / 100 MALES
38.7
MEDIAN AGE
2.9
AVG FAMILY SIZE
2.8
AVG HOUSEHOLD SIZE
2,035
LABOR FORCE [ PEOPLE ]
62.7%
PERCENT IN LABOR FORCE
1.6%
UNEMPLOYMENT RATE
Mccall Zip Codes
Mccall Area Codes
Income in Mccall
Income Overview in Mccall
Per Capita Income in Mccall is $45,117, while median incomes of families and households are $124,286 and $57,788 respectively.
| Characteristic | Number | Measure |
| Per Capita Income | 3,731 | $45,117 |
| Median Family Income | 680 | $124,286 |
| Mean Family Income | 680 | $140,783 |
| Median Household Income | 1,302 | $57,788 |
| Mean Household Income | 1,302 | $101,720 |
| Income Deficit | 680 | $0 |
| Wage / Income Gap (%) | 3,731 | 46.23% |
| Wage / Income Gap ($) | 3,731 | 53.77¢ per $1 |
| Gini / Inequality Index | 3,731 | 0.54 |
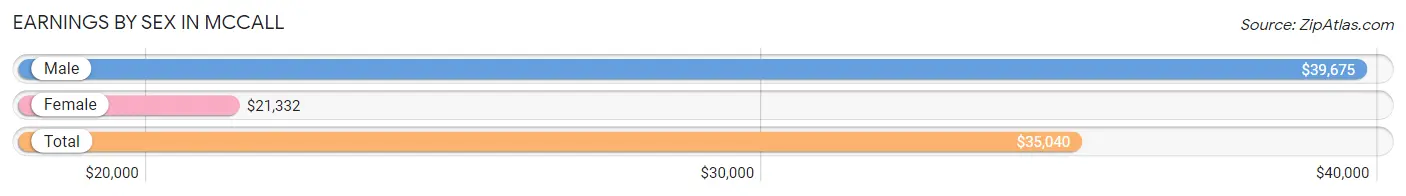
Earnings by Sex in Mccall
Average Earnings in Mccall are $35,040, $39,675 for men and $21,332 for women, a difference of 46.2%.
| Sex | Number | Average Earnings |
| Male | 1,361 (61.8%) | $39,675 |
| Female | 840 (38.2%) | $21,332 |
| Total | 2,201 (100.0%) | $35,040 |
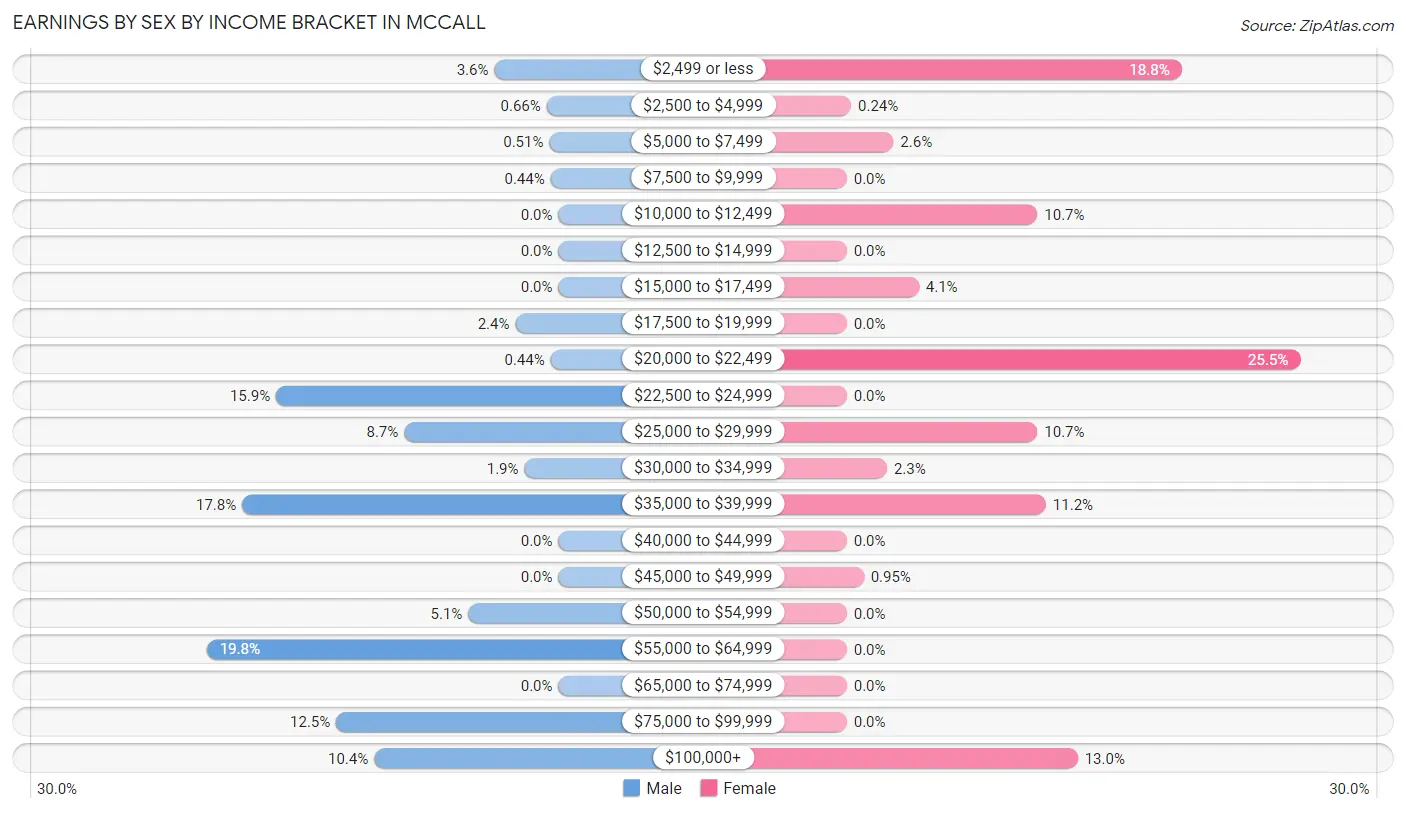
Earnings by Sex by Income Bracket in Mccall
The most common earnings brackets in Mccall are $55,000 to $64,999 for men (269 | 19.8%) and $20,000 to $22,499 for women (214 | 25.5%).
| Income | Male | Female |
| $2,499 or less | 49 (3.6%) | 158 (18.8%) |
| $2,500 to $4,999 | 9 (0.7%) | 2 (0.2%) |
| $5,000 to $7,499 | 7 (0.5%) | 22 (2.6%) |
| $7,500 to $9,999 | 6 (0.4%) | 0 (0.0%) |
| $10,000 to $12,499 | 0 (0.0%) | 90 (10.7%) |
| $12,500 to $14,999 | 0 (0.0%) | 0 (0.0%) |
| $15,000 to $17,499 | 0 (0.0%) | 34 (4.1%) |
| $17,500 to $19,999 | 33 (2.4%) | 0 (0.0%) |
| $20,000 to $22,499 | 6 (0.4%) | 214 (25.5%) |
| $22,500 to $24,999 | 216 (15.9%) | 0 (0.0%) |
| $25,000 to $29,999 | 118 (8.7%) | 90 (10.7%) |
| $30,000 to $34,999 | 26 (1.9%) | 19 (2.3%) |
| $35,000 to $39,999 | 242 (17.8%) | 94 (11.2%) |
| $40,000 to $44,999 | 0 (0.0%) | 0 (0.0%) |
| $45,000 to $49,999 | 0 (0.0%) | 8 (0.9%) |
| $50,000 to $54,999 | 69 (5.1%) | 0 (0.0%) |
| $55,000 to $64,999 | 269 (19.8%) | 0 (0.0%) |
| $65,000 to $74,999 | 0 (0.0%) | 0 (0.0%) |
| $75,000 to $99,999 | 170 (12.5%) | 0 (0.0%) |
| $100,000+ | 141 (10.4%) | 109 (13.0%) |
| Total | 1,361 (100.0%) | 840 (100.0%) |
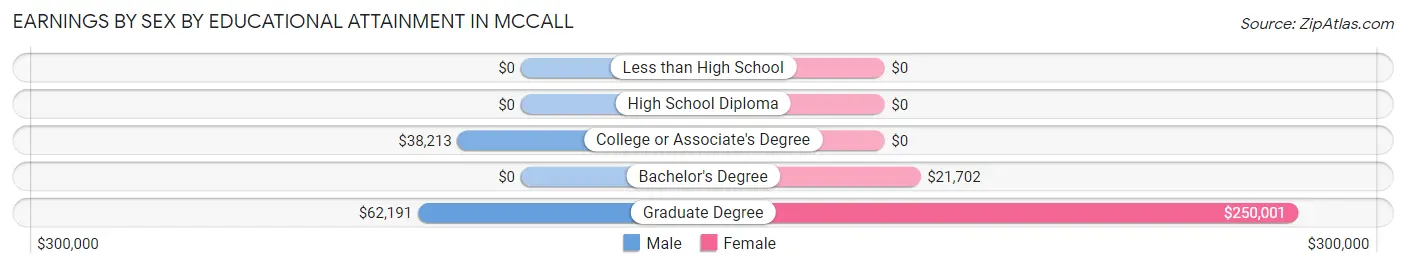
Earnings by Sex by Educational Attainment in Mccall
Average earnings in Mccall are $57,759 for men and $21,227 for women, a difference of 63.2%. Men with an educational attainment of graduate degree enjoy the highest average annual earnings of $62,191, while those with college or associate's degree education earn the least with $38,213. Women with an educational attainment of graduate degree earn the most with the average annual earnings of $250,001, while those with bachelor's degree education have the smallest earnings of $21,702.
| Educational Attainment | Male Income | Female Income |
| Less than High School | - | - |
| High School Diploma | - | - |
| College or Associate's Degree | $38,213 | $0 |
| Bachelor's Degree | - | - |
| Graduate Degree | $62,191 | $250,001 |
| Total | $57,759 | $21,227 |
Family Income in Mccall
Family Income Brackets in Mccall
According to the Mccall family income data, there are 222 families falling into the $200,000+ income range, which is the most common income bracket and makes up 32.7% of all families.
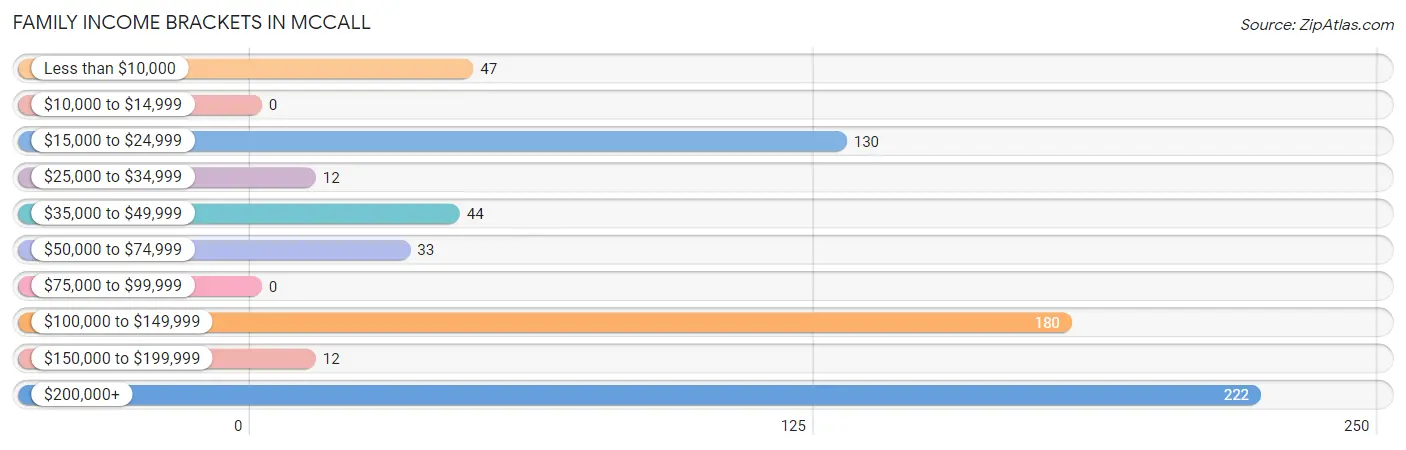
| Income Bracket | # Families | % Families |
| Less than $10,000 | 47 | 6.9% |
| $10,000 to $14,999 | 0 | 0.0% |
| $15,000 to $24,999 | 130 | 19.1% |
| $25,000 to $34,999 | 12 | 1.8% |
| $35,000 to $49,999 | 44 | 6.5% |
| $50,000 to $74,999 | 33 | 4.9% |
| $75,000 to $99,999 | 0 | 0.0% |
| $100,000 to $149,999 | 180 | 26.5% |
| $150,000 to $199,999 | 12 | 1.8% |
| $200,000+ | 222 | 32.6% |
Family Income by Famaliy Size in Mccall
3-person families (110 | 16.2%) account for the highest median family income in Mccall with $250,001 per family, while 3-person families (110 | 16.2%) have the highest median income of $83,334 per family member.
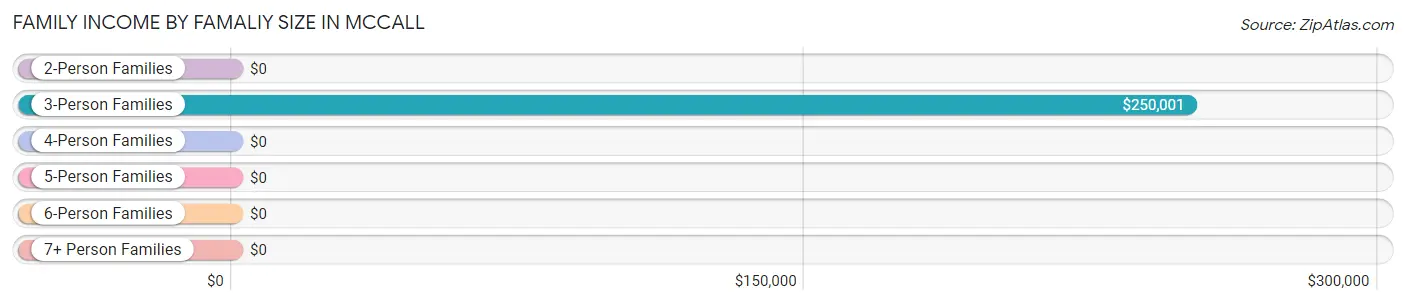
| Income Bracket | # Families | Median Income |
| 2-Person Families | 501 (73.7%) | $0 |
| 3-Person Families | 110 (16.2%) | $250,001 |
| 4-Person Families | 69 (10.2%) | $0 |
| 5-Person Families | 0 (0.0%) | $0 |
| 6-Person Families | 0 (0.0%) | $0 |
| 7+ Person Families | 0 (0.0%) | $0 |
| Total | 680 (100.0%) | $124,286 |
Family Income by Number of Earners in Mccall
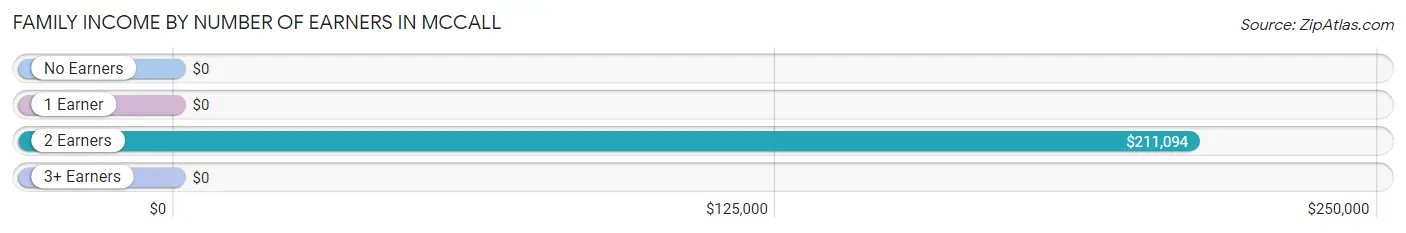
| Number of Earners | # Families | Median Income |
| No Earners | 238 (35.0%) | $0 |
| 1 Earner | 242 (35.6%) | $0 |
| 2 Earners | 157 (23.1%) | $211,094 |
| 3+ Earners | 43 (6.3%) | $0 |
| Total | 680 (100.0%) | $124,286 |
Household Income in Mccall
Household Income Brackets in Mccall
With 259 households falling in the category, the $100,000 to $149,999 income range is the most frequent in Mccall, accounting for 19.9% of all households. In contrast, only 12 households (0.9%) fall into the $150,000 to $199,999 income bracket, making it the least populous group.
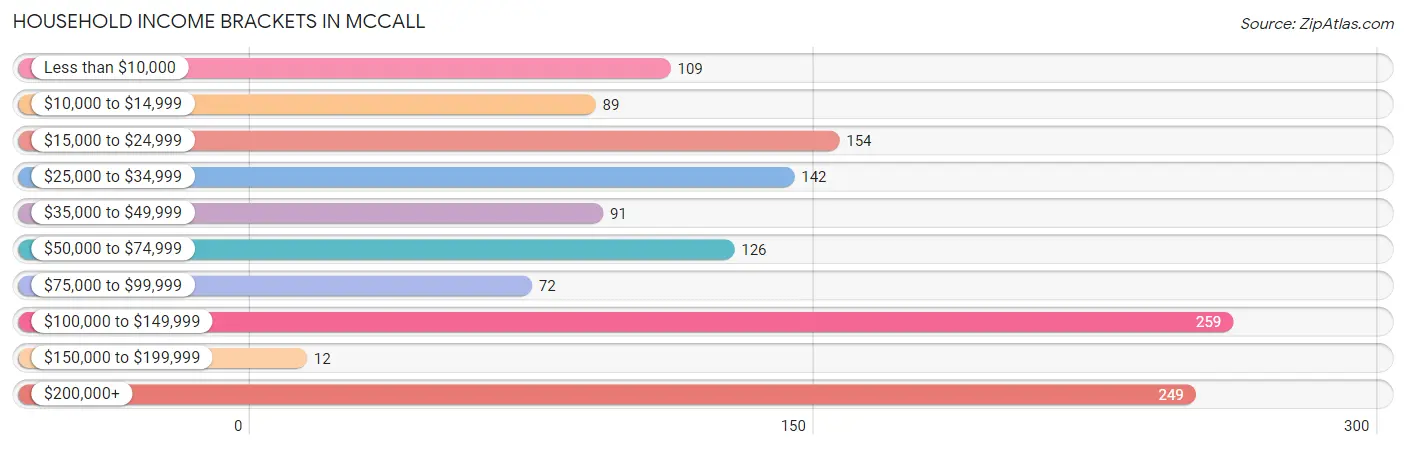
| Income Bracket | # Households | % Households |
| Less than $10,000 | 109 | 8.4% |
| $10,000 to $14,999 | 89 | 6.8% |
| $15,000 to $24,999 | 154 | 11.8% |
| $25,000 to $34,999 | 142 | 10.9% |
| $35,000 to $49,999 | 91 | 7.0% |
| $50,000 to $74,999 | 126 | 9.7% |
| $75,000 to $99,999 | 72 | 5.5% |
| $100,000 to $149,999 | 259 | 19.9% |
| $150,000 to $199,999 | 12 | 0.9% |
| $200,000+ | 249 | 19.1% |
Household Income by Householder Age in Mccall
The median household income in Mccall is $57,788, with the highest median household income of $85,259 found in the 45 to 64 years age bracket for the primary householder. A total of 315 households (24.2%) fall into this category. Meanwhile, the 15 to 24 years age bracket for the primary householder has the lowest median household income of $0, with 24 households (1.8%) in this group.
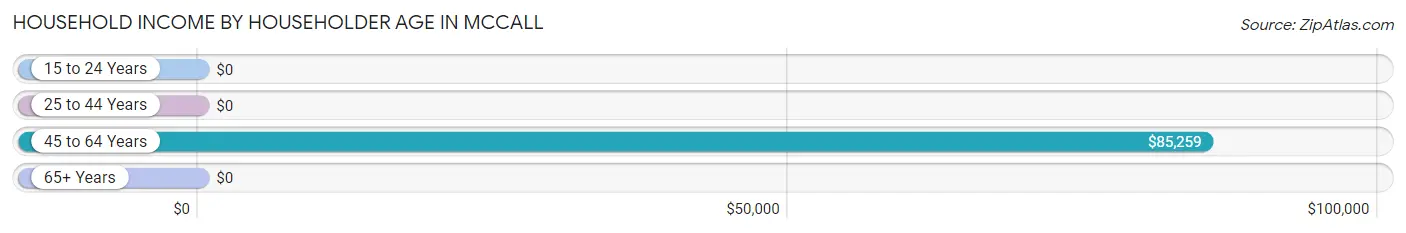
| Income Bracket | # Households | Median Income |
| 15 to 24 Years | 24 (1.8%) | $0 |
| 25 to 44 Years | 292 (22.4%) | $0 |
| 45 to 64 Years | 315 (24.2%) | $85,259 |
| 65+ Years | 671 (51.5%) | $0 |
| Total | 1,302 (100.0%) | $57,788 |
Poverty in Mccall
Income Below Poverty by Sex and Age in Mccall
With 8.1% poverty level for males and 24.3% for females among the residents of Mccall, 12 to 14 year old males and 15 year old females are the most vulnerable to poverty, with 16 males (44.4%) and 28 females (100.0%) in their respective age groups living below the poverty level.
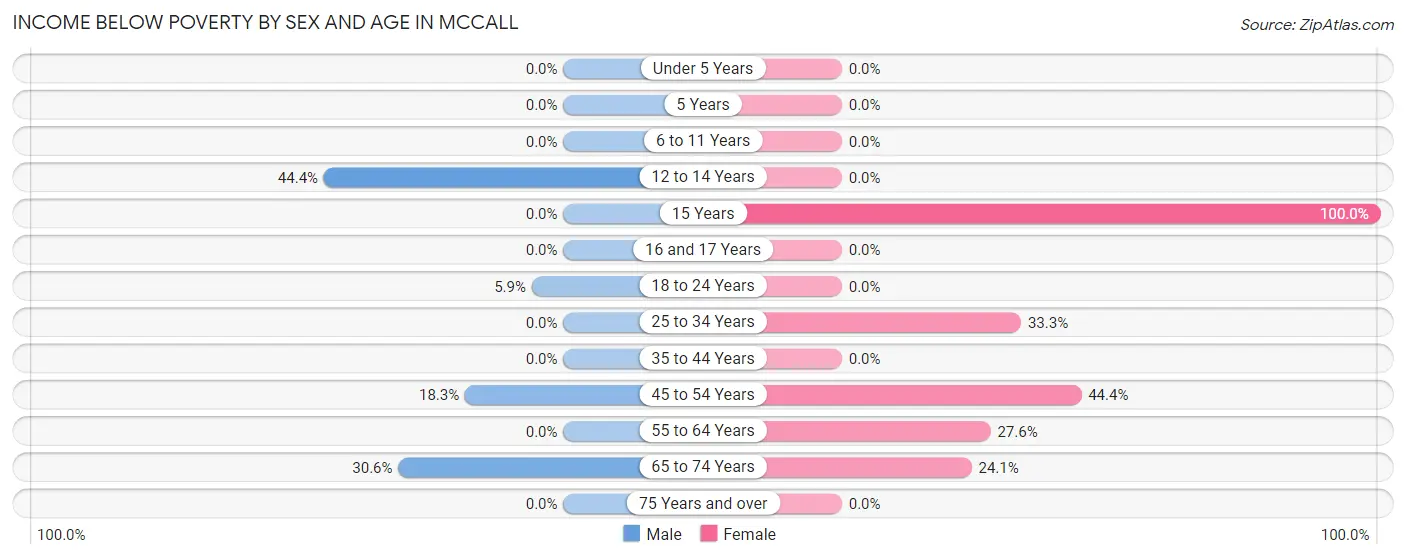
| Age Bracket | Male | Female |
| Under 5 Years | 0 (0.0%) | 0 (0.0%) |
| 5 Years | 0 (0.0%) | 0 (0.0%) |
| 6 to 11 Years | 0 (0.0%) | 0 (0.0%) |
| 12 to 14 Years | 16 (44.4%) | 0 (0.0%) |
| 15 Years | 0 (0.0%) | 28 (100.0%) |
| 16 and 17 Years | 0 (0.0%) | 0 (0.0%) |
| 18 to 24 Years | 13 (5.9%) | 0 (0.0%) |
| 25 to 34 Years | 0 (0.0%) | 145 (33.3%) |
| 35 to 44 Years | 0 (0.0%) | 0 (0.0%) |
| 45 to 54 Years | 25 (18.2%) | 52 (44.4%) |
| 55 to 64 Years | 0 (0.0%) | 53 (27.6%) |
| 65 to 74 Years | 121 (30.6%) | 85 (24.1%) |
| 75 Years and over | 0 (0.0%) | 0 (0.0%) |
| Total | 175 (8.1%) | 363 (24.3%) |
Income Above Poverty by Sex and Age in Mccall
According to the poverty statistics in Mccall, males aged under 5 years and females aged under 5 years are the age groups that are most secure financially, with 100.0% of males and 100.0% of females in these age groups living above the poverty line.
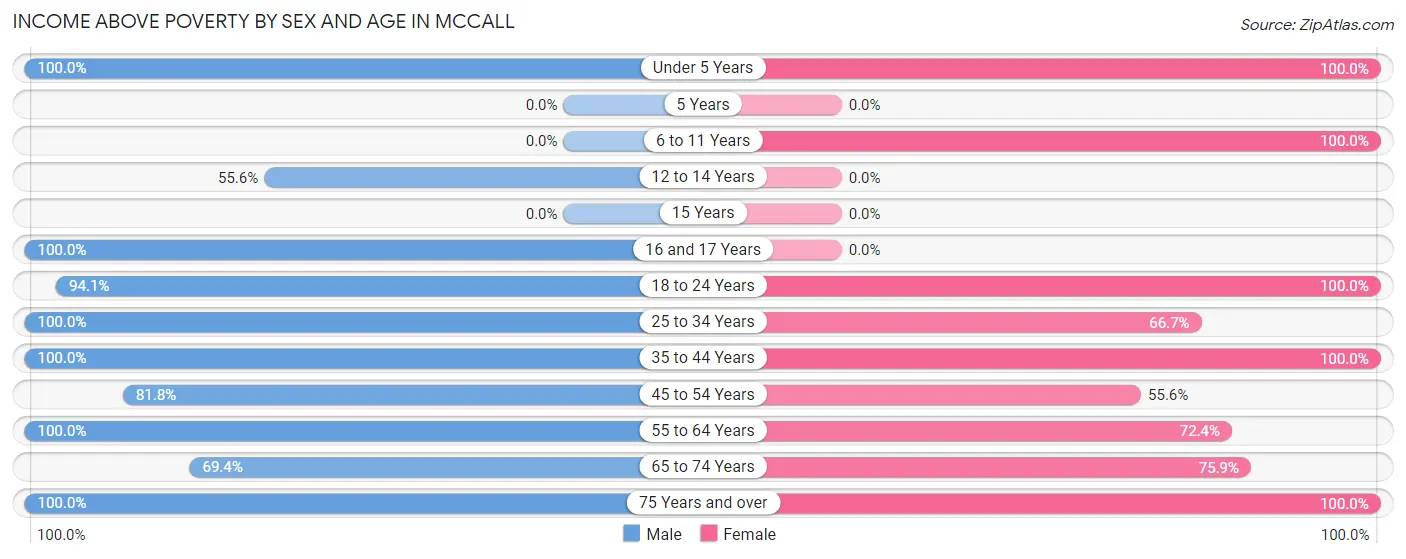
| Age Bracket | Male | Female |
| Under 5 Years | 174 (100.0%) | 167 (100.0%) |
| 5 Years | 0 (0.0%) | 0 (0.0%) |
| 6 to 11 Years | 0 (0.0%) | 81 (100.0%) |
| 12 to 14 Years | 20 (55.6%) | 0 (0.0%) |
| 15 Years | 0 (0.0%) | 0 (0.0%) |
| 16 and 17 Years | 89 (100.0%) | 0 (0.0%) |
| 18 to 24 Years | 209 (94.1%) | 18 (100.0%) |
| 25 to 34 Years | 198 (100.0%) | 291 (66.7%) |
| 35 to 44 Years | 596 (100.0%) | 59 (100.0%) |
| 45 to 54 Years | 112 (81.8%) | 65 (55.6%) |
| 55 to 64 Years | 117 (100.0%) | 139 (72.4%) |
| 65 to 74 Years | 274 (69.4%) | 268 (75.9%) |
| 75 Years and over | 194 (100.0%) | 44 (100.0%) |
| Total | 1,983 (91.9%) | 1,132 (75.7%) |
Income Below Poverty Among Married-Couple Families in Mccall
The poverty statistics for married-couple families in Mccall show that 9.3% or 59 of the total 635 families live below the poverty line. Families with no children have the highest poverty rate of 9.4%, comprising of 47 families. On the other hand, families with 1 or 2 children have the lowest poverty rate of 8.8%, which includes 12 families.
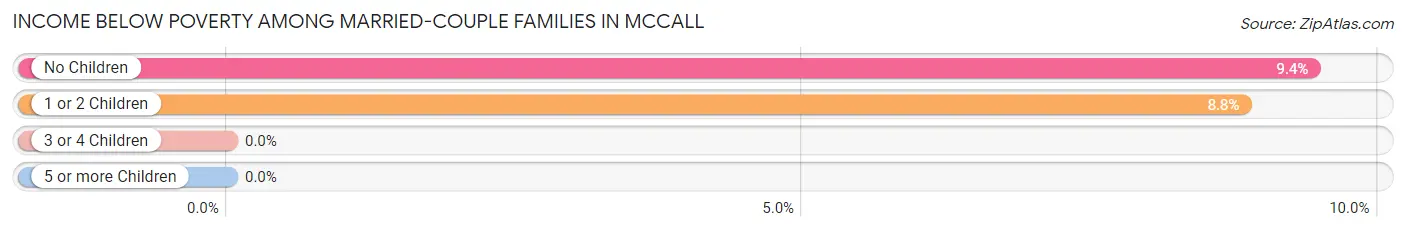
| Children | Above Poverty | Below Poverty |
| No Children | 452 (90.6%) | 47 (9.4%) |
| 1 or 2 Children | 124 (91.2%) | 12 (8.8%) |
| 3 or 4 Children | 0 (0.0%) | 0 (0.0%) |
| 5 or more Children | 0 (0.0%) | 0 (0.0%) |
| Total | 576 (90.7%) | 59 (9.3%) |
Income Below Poverty Among Single-Parent Households in Mccall
| Children | Single Father | Single Mother |
| No Children | 0 (0.0%) | 0 (0.0%) |
| 1 or 2 Children | 0 (0.0%) | 0 (0.0%) |
| 3 or 4 Children | 0 (0.0%) | 0 (0.0%) |
| 5 or more Children | 0 (0.0%) | 0 (0.0%) |
| Total | 0 (0.0%) | 0 (0.0%) |
Income Below Poverty Among Married-Couple vs Single-Parent Households in Mccall
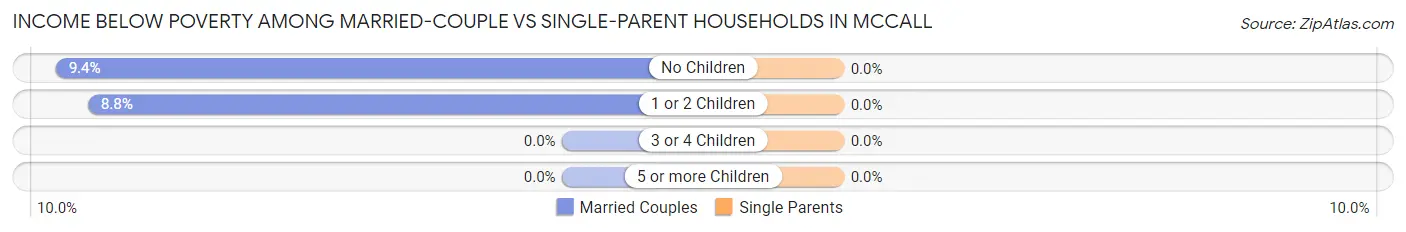
| Children | Married-Couple Families | Single-Parent Households |
| No Children | 47 (9.4%) | 0 (0.0%) |
| 1 or 2 Children | 12 (8.8%) | 0 (0.0%) |
| 3 or 4 Children | 0 (0.0%) | 0 (0.0%) |
| 5 or more Children | 0 (0.0%) | 0 (0.0%) |
| Total | 59 (9.3%) | 0 (0.0%) |
Race in Mccall
The most populous races in Mccall are White / Caucasian (3,702 | 99.2%), Hispanic or Latino (47 | 1.3%), and Some other Race (25 | 0.7%).
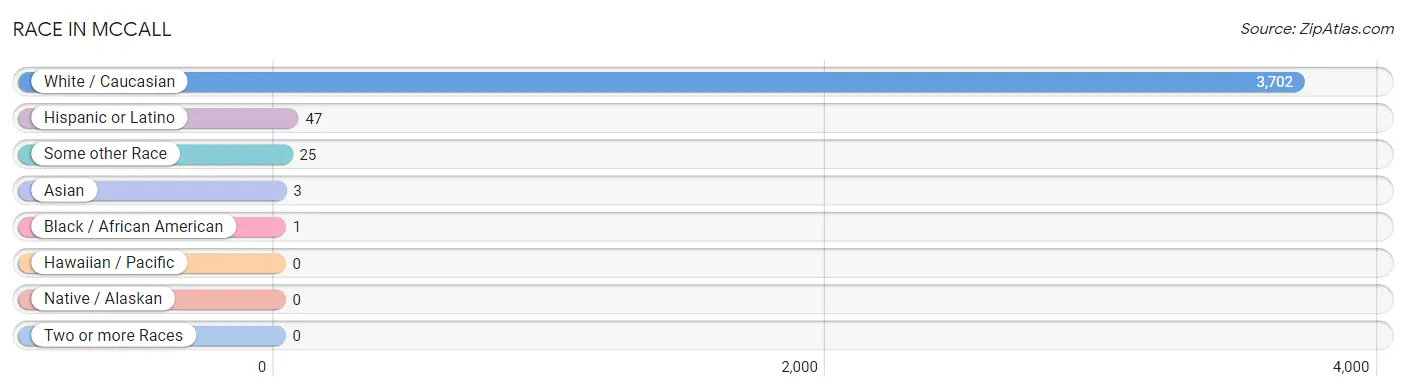
| Race | # Population | % Population |
| Asian | 3 | 0.1% |
| Black / African American | 1 | 0.0% |
| Hawaiian / Pacific | 0 | 0.0% |
| Hispanic or Latino | 47 | 1.3% |
| Native / Alaskan | 0 | 0.0% |
| White / Caucasian | 3,702 | 99.2% |
| Two or more Races | 0 | 0.0% |
| Some other Race | 25 | 0.7% |
| Total | 3,731 | 100.0% |
Ancestry in Mccall
The most populous ancestries reported in Mccall are German (726 | 19.5%), Irish (657 | 17.6%), English (526 | 14.1%), American (301 | 8.1%), and Welsh (214 | 5.7%), together accounting for 65.0% of all Mccall residents.
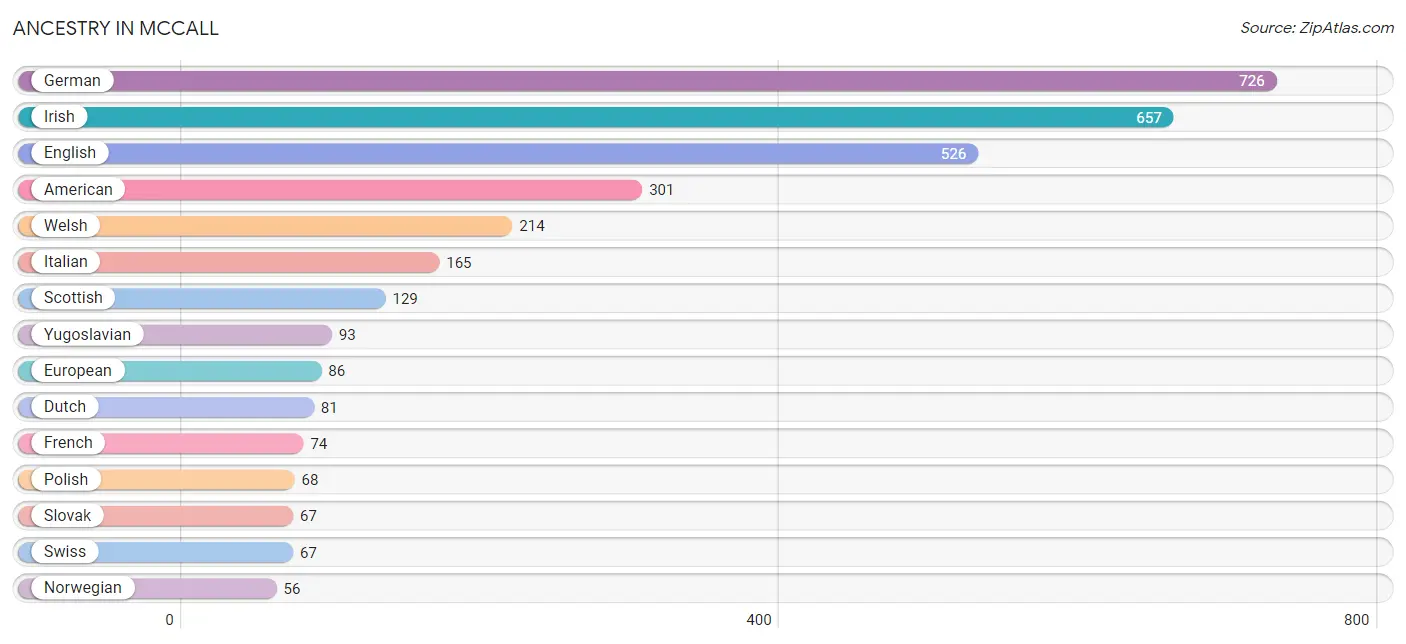
| Ancestry | # Population | % Population |
| American | 301 | 8.1% |
| Belgian | 47 | 1.3% |
| Danish | 8 | 0.2% |
| Dutch | 81 | 2.2% |
| English | 526 | 14.1% |
| European | 86 | 2.3% |
| French | 74 | 2.0% |
| German | 726 | 19.5% |
| Irish | 657 | 17.6% |
| Italian | 165 | 4.4% |
| Mexican | 46 | 1.2% |
| Norwegian | 56 | 1.5% |
| Polish | 68 | 1.8% |
| Portuguese | 34 | 0.9% |
| Puerto Rican | 1 | 0.0% |
| Scandinavian | 8 | 0.2% |
| Scotch-Irish | 34 | 0.9% |
| Scottish | 129 | 3.5% |
| Slovak | 67 | 1.8% |
| Slovene | 8 | 0.2% |
| Swiss | 67 | 1.8% |
| Thai | 3 | 0.1% |
| Ukrainian | 33 | 0.9% |
| Welsh | 214 | 5.7% |
| Yugoslavian | 93 | 2.5% | View All 25 Rows |
Immigrants in Mccall
The most numerous immigrant groups reported in Mccall came from Central America (18 | 0.5%), Latin America (18 | 0.5%), Mexico (18 | 0.5%), Asia (3 | 0.1%), and Indonesia (3 | 0.1%), together accounting for 1.6% of all Mccall residents.
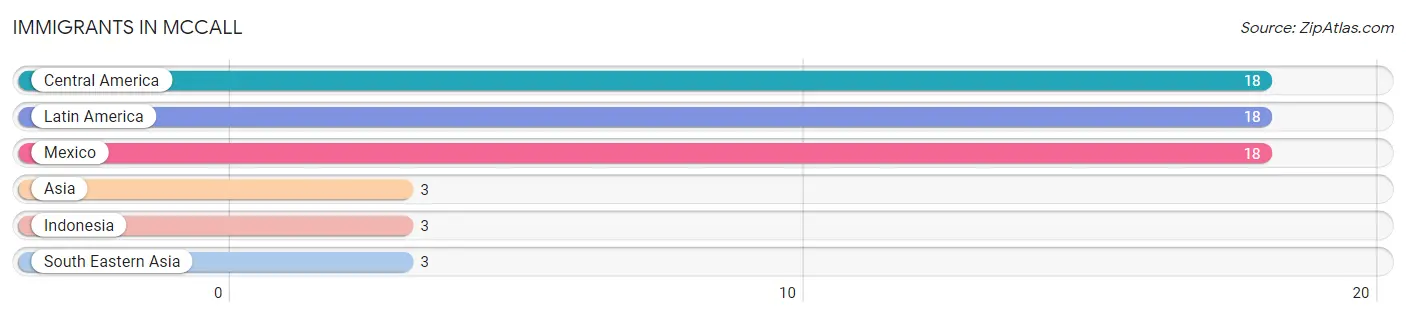
| Immigration Origin | # Population | % Population |
| Asia | 3 | 0.1% |
| Central America | 18 | 0.5% |
| Indonesia | 3 | 0.1% |
| Latin America | 18 | 0.5% |
| Mexico | 18 | 0.5% |
| South Eastern Asia | 3 | 0.1% | View All 6 Rows |
Sex and Age in Mccall
Sex and Age in Mccall
The most populous age groups in Mccall are 35 to 39 Years (390 | 17.9%) for men and 65 to 69 Years (241 | 15.5%) for women.
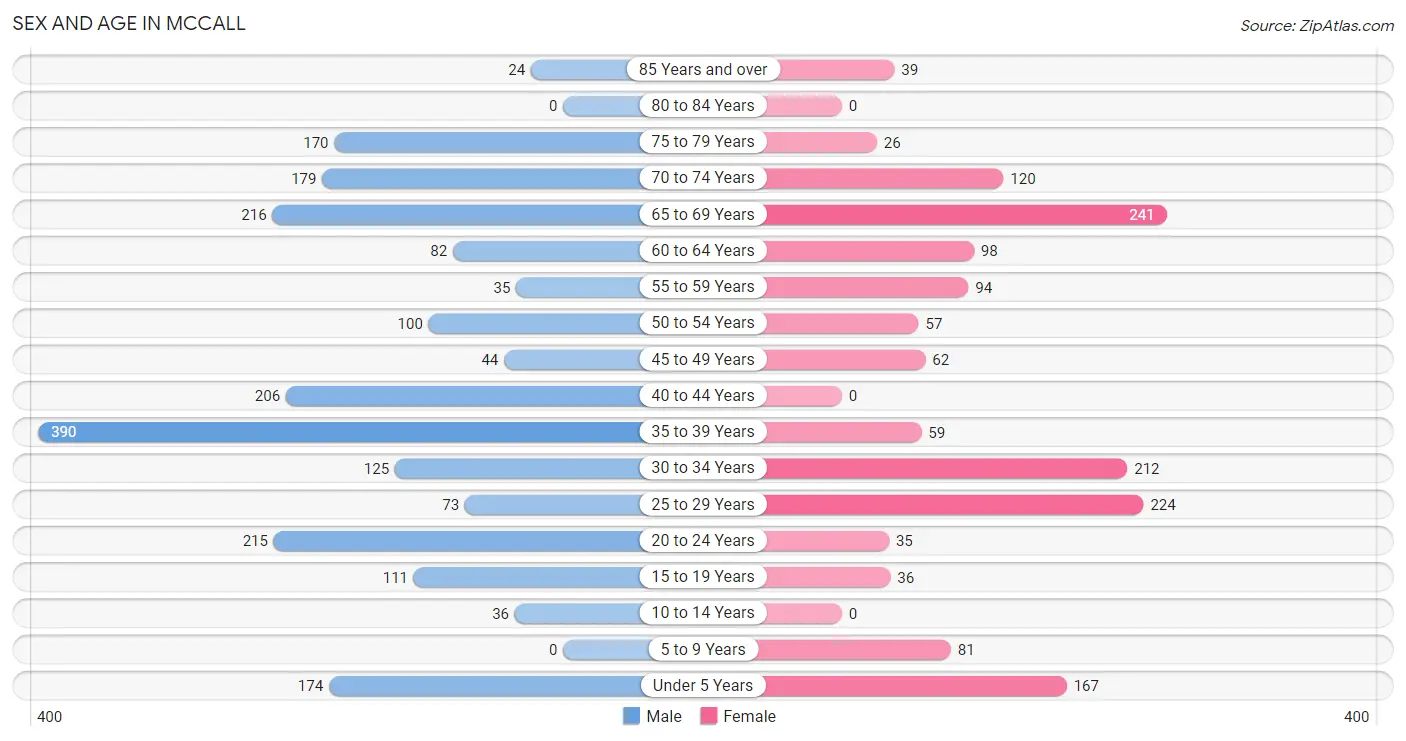
| Age Bracket | Male | Female |
| Under 5 Years | 174 (8.0%) | 167 (10.8%) |
| 5 to 9 Years | 0 (0.0%) | 81 (5.2%) |
| 10 to 14 Years | 36 (1.7%) | 0 (0.0%) |
| 15 to 19 Years | 111 (5.1%) | 36 (2.3%) |
| 20 to 24 Years | 215 (9.9%) | 35 (2.3%) |
| 25 to 29 Years | 73 (3.4%) | 224 (14.4%) |
| 30 to 34 Years | 125 (5.7%) | 212 (13.7%) |
| 35 to 39 Years | 390 (17.9%) | 59 (3.8%) |
| 40 to 44 Years | 206 (9.5%) | 0 (0.0%) |
| 45 to 49 Years | 44 (2.0%) | 62 (4.0%) |
| 50 to 54 Years | 100 (4.6%) | 57 (3.7%) |
| 55 to 59 Years | 35 (1.6%) | 94 (6.1%) |
| 60 to 64 Years | 82 (3.8%) | 98 (6.3%) |
| 65 to 69 Years | 216 (9.9%) | 241 (15.5%) |
| 70 to 74 Years | 179 (8.2%) | 120 (7.7%) |
| 75 to 79 Years | 170 (7.8%) | 26 (1.7%) |
| 80 to 84 Years | 0 (0.0%) | 0 (0.0%) |
| 85 Years and over | 24 (1.1%) | 39 (2.5%) |
| Total | 2,180 (100.0%) | 1,551 (100.0%) |
Families and Households in Mccall
Median Family Size in Mccall
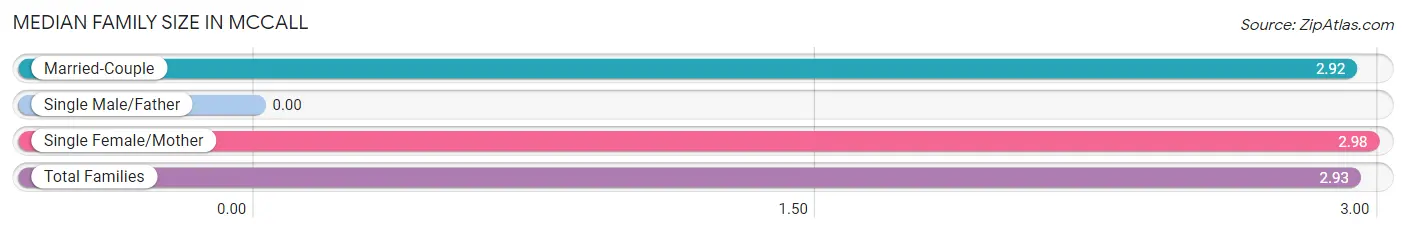
| Family Type | # Families | Family Size |
| Married-Couple | 635 (93.4%) | 2.92 |
| Single Male/Father | 0 (0.0%) | - |
| Single Female/Mother | 45 (6.6%) | 2.98 |
| Total Families | 680 (100.0%) | 2.93 |
Median Household Size in Mccall
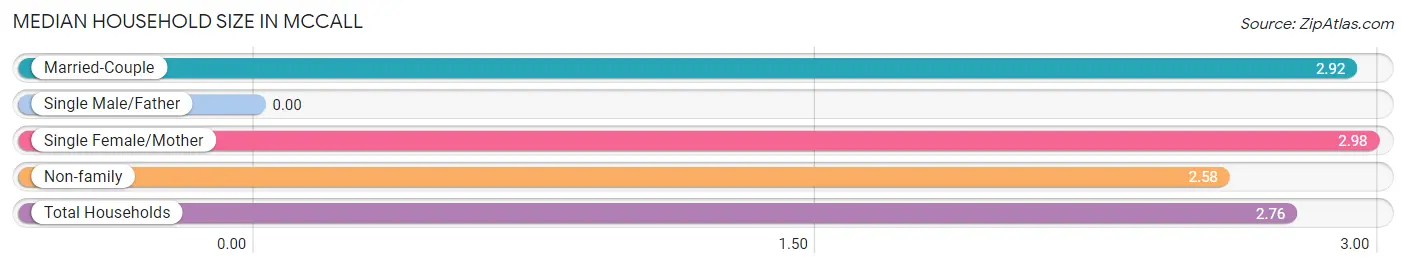
| Household Type | # Households | Household Size |
| Married-Couple | 635 (48.8%) | 2.92 |
| Single Male/Father | 0 (0.0%) | - |
| Single Female/Mother | 45 (3.5%) | 2.98 |
| Non-family | 622 (47.8%) | 2.58 |
| Total Households | 1,302 (100.0%) | 2.76 |
Household Size by Marriage Status in Mccall
Out of a total of 1,302 households in Mccall, 680 (52.2%) are family households, while 622 (47.8%) are nonfamily households. The most numerous type of family households are 2-person households, comprising 501, and the most common type of nonfamily households are 1-person households, comprising 388.
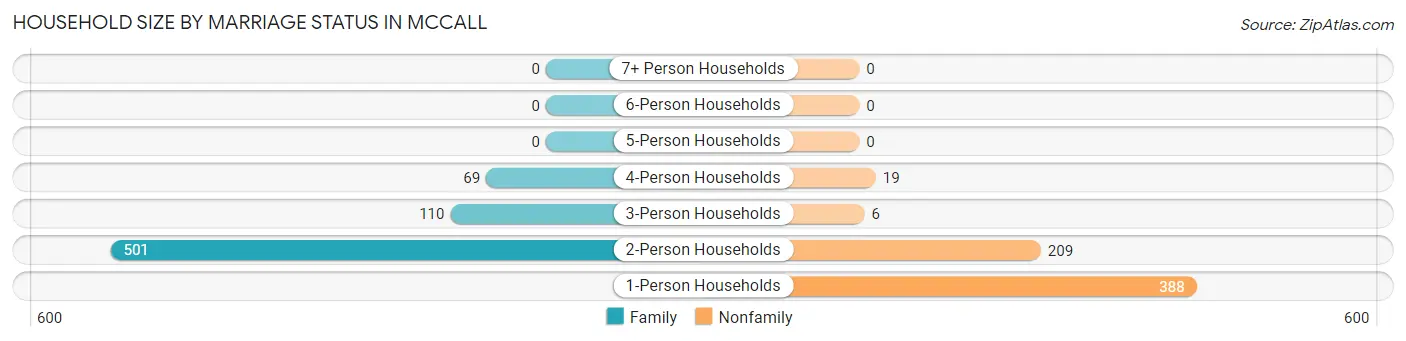
| Household Size | Family Households | Nonfamily Households |
| 1-Person Households | - | 388 (29.8%) |
| 2-Person Households | 501 (38.5%) | 209 (16.1%) |
| 3-Person Households | 110 (8.5%) | 6 (0.5%) |
| 4-Person Households | 69 (5.3%) | 19 (1.5%) |
| 5-Person Households | 0 (0.0%) | 0 (0.0%) |
| 6-Person Households | 0 (0.0%) | 0 (0.0%) |
| 7+ Person Households | 0 (0.0%) | 0 (0.0%) |
| Total | 680 (52.2%) | 622 (47.8%) |
Female Fertility in Mccall
Fertility by Age in Mccall
| Age Bracket | Women with Births | Births / 1,000 Women |
| 15 to 19 years | 0 (0.0%) | 0.0 |
| 20 to 34 years | 0 (0.0%) | 0.0 |
| 35 to 50 years | 0 (0.0%) | 0.0 |
| Total | 0 (0.0%) | 0.0 |
Fertility by Age by Marriage Status in Mccall
| Age Bracket | Married | Unmarried |
| 15 to 19 years | 0 (0.0%) | 0 (0.0%) |
| 20 to 34 years | 0 (0.0%) | 0 (0.0%) |
| 35 to 50 years | 0 (0.0%) | 0 (0.0%) |
| Total | 0 (0.0%) | 0 (0.0%) |
Fertility by Education in Mccall
| Educational Attainment | Women with Births | Births / 1,000 Women |
| Less than High School | 0 (0.0%) | 0.0 |
| High School Diploma | 0 (0.0%) | 0.0 |
| College or Associate's Degree | 0 (0.0%) | 0.0 |
| Bachelor's Degree | 0 (0.0%) | 0.0 |
| Graduate Degree | 0 (0.0%) | 0.0 |
| Total | 0 (0.0%) | 0.0 |
Fertility by Education by Marriage Status in Mccall
| Educational Attainment | Married | Unmarried |
| Less than High School | 0 (0.0%) | 0 (0.0%) |
| High School Diploma | 0 (0.0%) | 0 (0.0%) |
| College or Associate's Degree | 0 (0.0%) | 0 (0.0%) |
| Bachelor's Degree | 0 (0.0%) | 0 (0.0%) |
| Graduate Degree | 0 (0.0%) | 0 (0.0%) |
| Total | 0 (0.0%) | 0 (0.0%) |
Employment Characteristics in Mccall
Employment by Class of Employer in Mccall
Among the 1,926 employed individuals in Mccall, private company employees (1,017 | 52.8%), state government employees (330 | 17.1%), and self-employed (incorporated) (239 | 12.4%) make up the most common classes of employment.
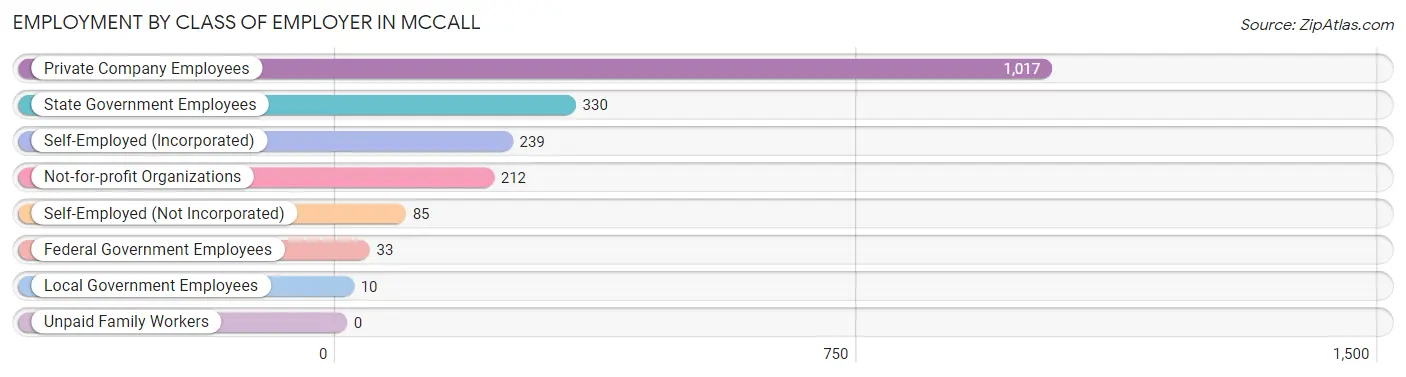
| Employer Class | # Employees | % Employees |
| Private Company Employees | 1,017 | 52.8% |
| Self-Employed (Incorporated) | 239 | 12.4% |
| Self-Employed (Not Incorporated) | 85 | 4.4% |
| Not-for-profit Organizations | 212 | 11.0% |
| Local Government Employees | 10 | 0.5% |
| State Government Employees | 330 | 17.1% |
| Federal Government Employees | 33 | 1.7% |
| Unpaid Family Workers | 0 | 0.0% |
| Total | 1,926 | 100.0% |
Employment Status by Age in Mccall
According to the labor force statistics for Mccall, out of the total population over 16 years of age (3,245), 62.7% or 2,035 individuals are in the labor force, with 1.6% or 33 of them unemployed. The age group with the highest labor force participation rate is 30 to 34 years, with 100.0% or 337 individuals in the labor force. Within the labor force, the 30 to 34 years age range has the highest percentage of unemployed individuals, with 9.8% or 33 of them being unemployed.
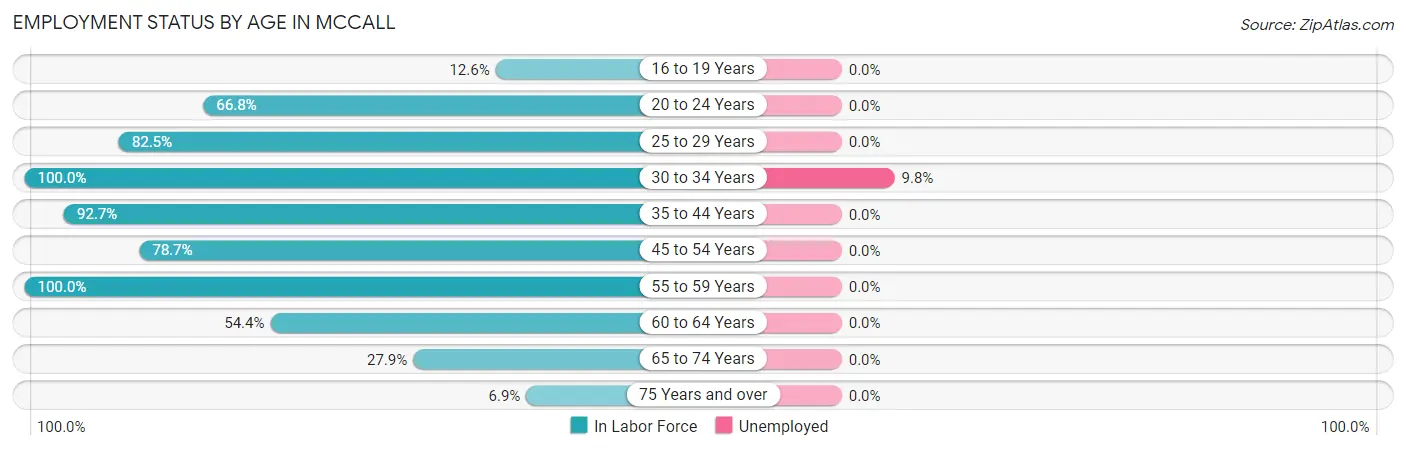
| Age Bracket | In Labor Force | Unemployed |
| 16 to 19 Years | 15 (12.6%) | 0 (0.0%) |
| 20 to 24 Years | 167 (66.8%) | 0 (0.0%) |
| 25 to 29 Years | 245 (82.5%) | 0 (0.0%) |
| 30 to 34 Years | 337 (100.0%) | 33 (9.8%) |
| 35 to 44 Years | 607 (92.7%) | 0 (0.0%) |
| 45 to 54 Years | 207 (78.7%) | 0 (0.0%) |
| 55 to 59 Years | 129 (100.0%) | 0 (0.0%) |
| 60 to 64 Years | 98 (54.4%) | 0 (0.0%) |
| 65 to 74 Years | 211 (27.9%) | 0 (0.0%) |
| 75 Years and over | 18 (6.9%) | 0 (0.0%) |
| Total | 2,035 (62.7%) | 33 (1.6%) |
Employment Status by Educational Attainment in Mccall
According to labor force statistics for Mccall, 87.2% of individuals (1,623) out of the total population between 25 and 64 years of age (1,861) are in the labor force, with 2.0% or 32 of them being unemployed. The group with the highest labor force participation rate are those with the educational attainment of high school diploma, with 100.0% or 180 individuals in the labor force. Within the labor force, individuals with bachelor's degree or higher education have the highest percentage of unemployment, with 4.4% or 33 of them being unemployed.
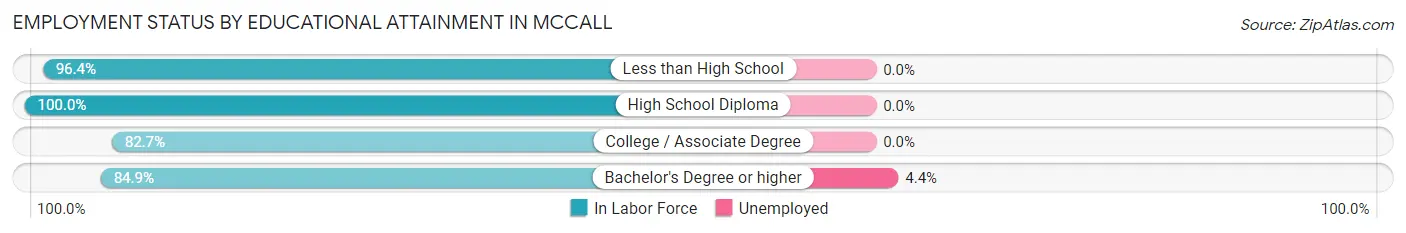
| Educational Attainment | In Labor Force | Unemployed |
| Less than High School | 238 (96.4%) | 0 (0.0%) |
| High School Diploma | 180 (100.0%) | 0 (0.0%) |
| College / Associate Degree | 460 (82.7%) | 0 (0.0%) |
| Bachelor's Degree or higher | 745 (84.9%) | 39 (4.4%) |
| Total | 1,623 (87.2%) | 37 (2.0%) |
Employment Occupations by Sex in Mccall
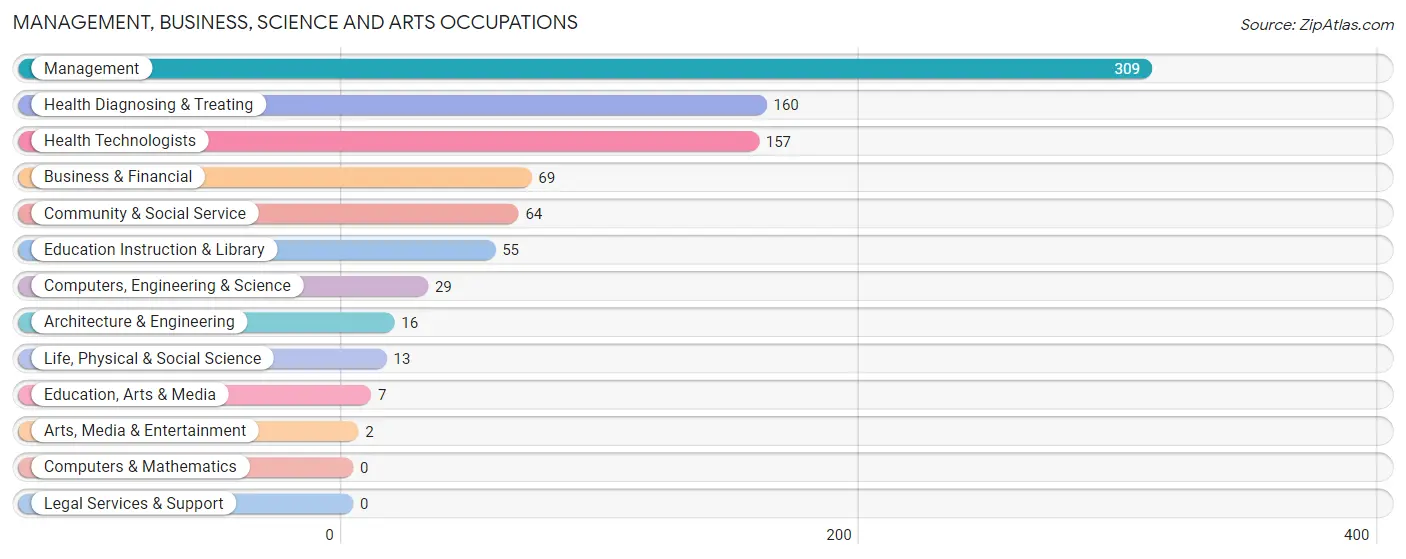
Management, Business, Science and Arts Occupations
The most common Management, Business, Science and Arts occupations in Mccall are Management (309 | 15.4%), Health Diagnosing & Treating (160 | 8.0%), Health Technologists (157 | 7.9%), Business & Financial (69 | 3.5%), and Community & Social Service (64 | 3.2%).
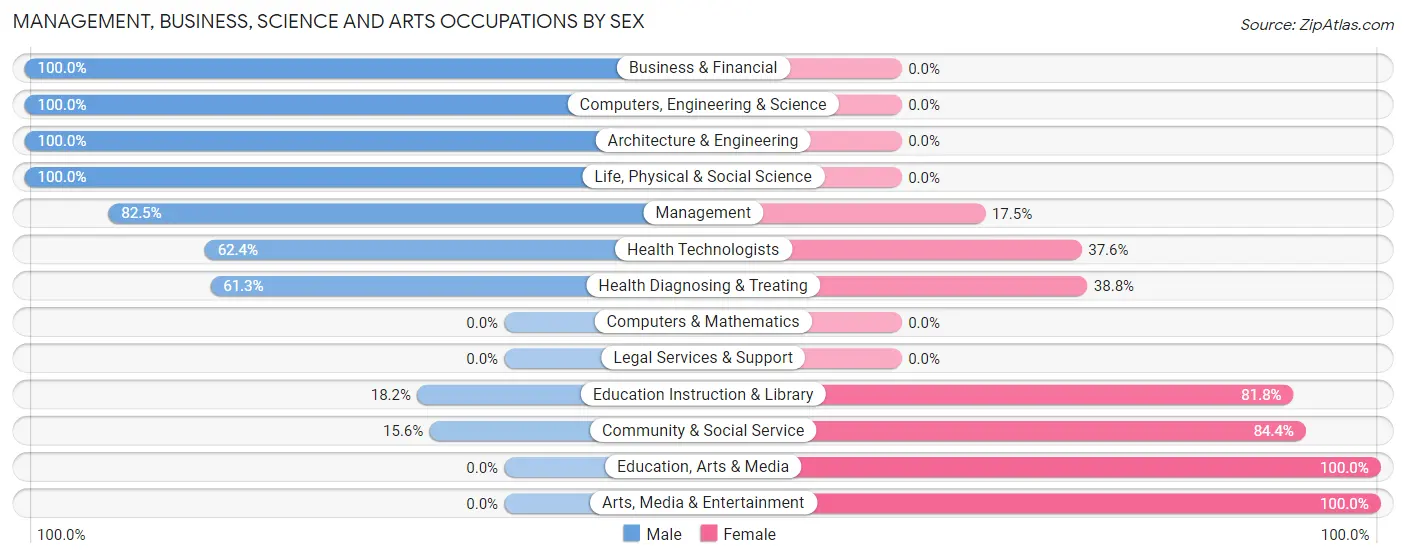
Management, Business, Science and Arts Occupations by Sex
Within the Management, Business, Science and Arts occupations in Mccall, the most male-oriented occupations are Business & Financial (100.0%), Computers, Engineering & Science (100.0%), and Architecture & Engineering (100.0%), while the most female-oriented occupations are Education, Arts & Media (100.0%), Arts, Media & Entertainment (100.0%), and Community & Social Service (84.4%).
| Occupation | Male | Female |
| Management | 255 (82.5%) | 54 (17.5%) |
| Business & Financial | 69 (100.0%) | 0 (0.0%) |
| Computers, Engineering & Science | 29 (100.0%) | 0 (0.0%) |
| Computers & Mathematics | 0 (0.0%) | 0 (0.0%) |
| Architecture & Engineering | 16 (100.0%) | 0 (0.0%) |
| Life, Physical & Social Science | 13 (100.0%) | 0 (0.0%) |
| Community & Social Service | 10 (15.6%) | 54 (84.4%) |
| Education, Arts & Media | 0 (0.0%) | 7 (100.0%) |
| Legal Services & Support | 0 (0.0%) | 0 (0.0%) |
| Education Instruction & Library | 10 (18.2%) | 45 (81.8%) |
| Arts, Media & Entertainment | 0 (0.0%) | 2 (100.0%) |
| Health Diagnosing & Treating | 98 (61.3%) | 62 (38.8%) |
| Health Technologists | 98 (62.4%) | 59 (37.6%) |
| Total (Category) | 461 (73.1%) | 170 (26.9%) |
| Total (Overall) | 1,180 (59.0%) | 821 (41.0%) |
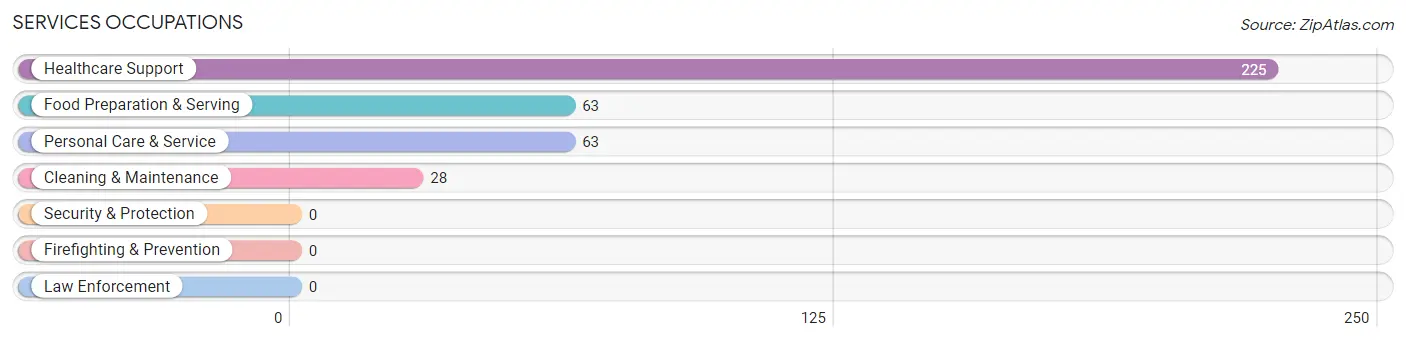
Services Occupations
The most common Services occupations in Mccall are Healthcare Support (225 | 11.2%), Food Preparation & Serving (63 | 3.2%), Personal Care & Service (63 | 3.2%), and Cleaning & Maintenance (28 | 1.4%).
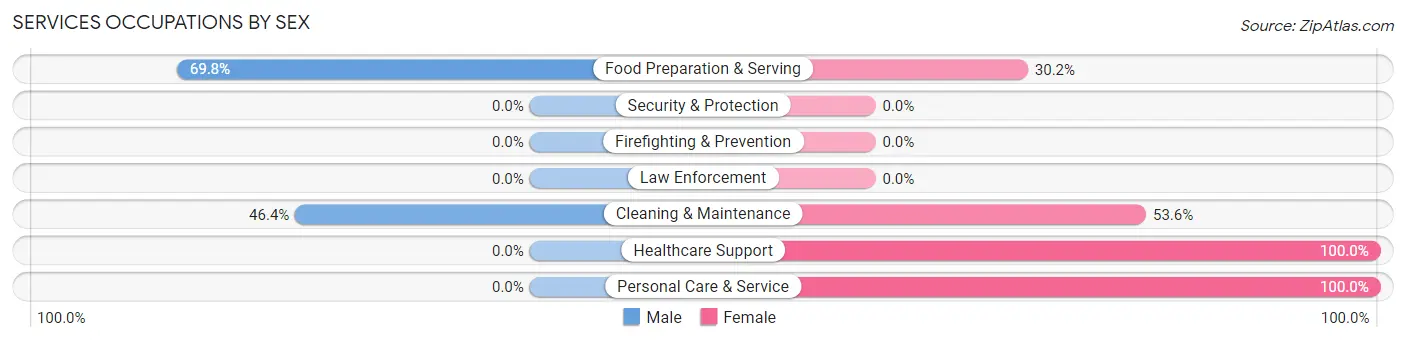
Services Occupations by Sex
Within the Services occupations in Mccall, the most male-oriented occupations are Food Preparation & Serving (69.8%), and Cleaning & Maintenance (46.4%), while the most female-oriented occupations are Healthcare Support (100.0%), Personal Care & Service (100.0%), and Cleaning & Maintenance (53.6%).
| Occupation | Male | Female |
| Healthcare Support | 0 (0.0%) | 225 (100.0%) |
| Security & Protection | 0 (0.0%) | 0 (0.0%) |
| Firefighting & Prevention | 0 (0.0%) | 0 (0.0%) |
| Law Enforcement | 0 (0.0%) | 0 (0.0%) |
| Food Preparation & Serving | 44 (69.8%) | 19 (30.2%) |
| Cleaning & Maintenance | 13 (46.4%) | 15 (53.6%) |
| Personal Care & Service | 0 (0.0%) | 63 (100.0%) |
| Total (Category) | 57 (15.0%) | 322 (85.0%) |
| Total (Overall) | 1,180 (59.0%) | 821 (41.0%) |
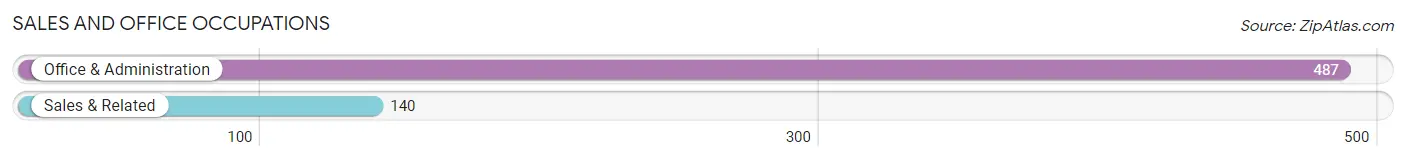
Sales and Office Occupations
The most common Sales and Office occupations in Mccall are Office & Administration (487 | 24.3%), and Sales & Related (140 | 7.0%).
Sales and Office Occupations by Sex
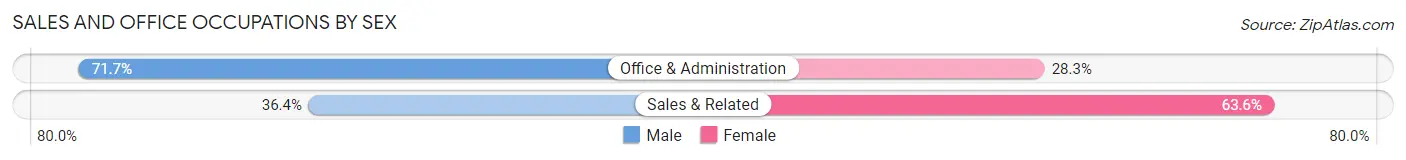
| Occupation | Male | Female |
| Sales & Related | 51 (36.4%) | 89 (63.6%) |
| Office & Administration | 349 (71.7%) | 138 (28.3%) |
| Total (Category) | 400 (63.8%) | 227 (36.2%) |
| Total (Overall) | 1,180 (59.0%) | 821 (41.0%) |
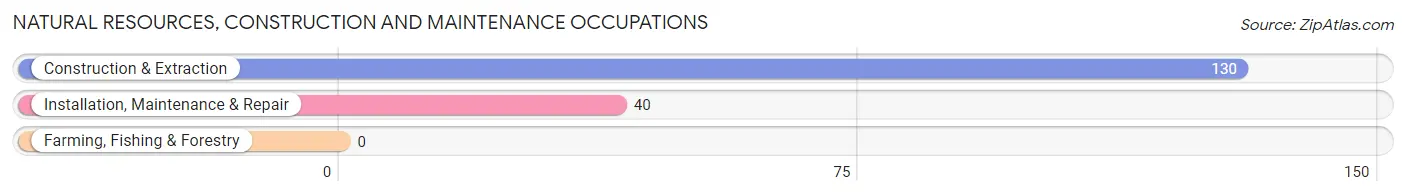
Natural Resources, Construction and Maintenance Occupations
The most common Natural Resources, Construction and Maintenance occupations in Mccall are Construction & Extraction (130 | 6.5%), and Installation, Maintenance & Repair (40 | 2.0%).
Natural Resources, Construction and Maintenance Occupations by Sex
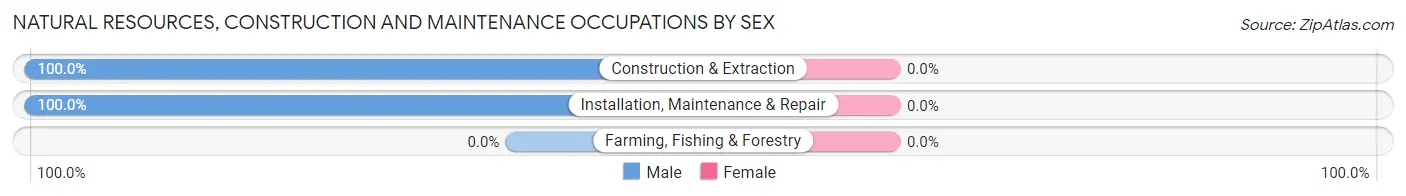
| Occupation | Male | Female |
| Farming, Fishing & Forestry | 0 (0.0%) | 0 (0.0%) |
| Construction & Extraction | 130 (100.0%) | 0 (0.0%) |
| Installation, Maintenance & Repair | 40 (100.0%) | 0 (0.0%) |
| Total (Category) | 170 (100.0%) | 0 (0.0%) |
| Total (Overall) | 1,180 (59.0%) | 821 (41.0%) |
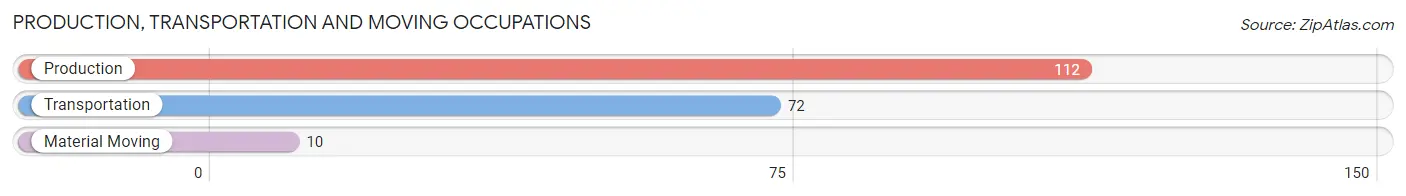
Production, Transportation and Moving Occupations
The most common Production, Transportation and Moving occupations in Mccall are Production (112 | 5.6%), Transportation (72 | 3.6%), and Material Moving (10 | 0.5%).
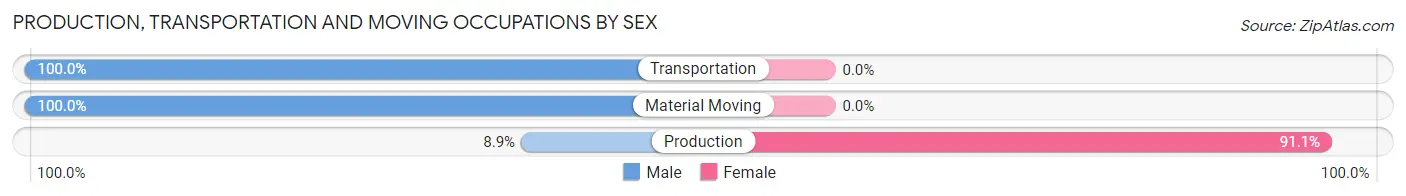
Production, Transportation and Moving Occupations by Sex
| Occupation | Male | Female |
| Production | 10 (8.9%) | 102 (91.1%) |
| Transportation | 72 (100.0%) | 0 (0.0%) |
| Material Moving | 10 (100.0%) | 0 (0.0%) |
| Total (Category) | 92 (47.4%) | 102 (52.6%) |
| Total (Overall) | 1,180 (59.0%) | 821 (41.0%) |
Employment Industries by Sex in Mccall
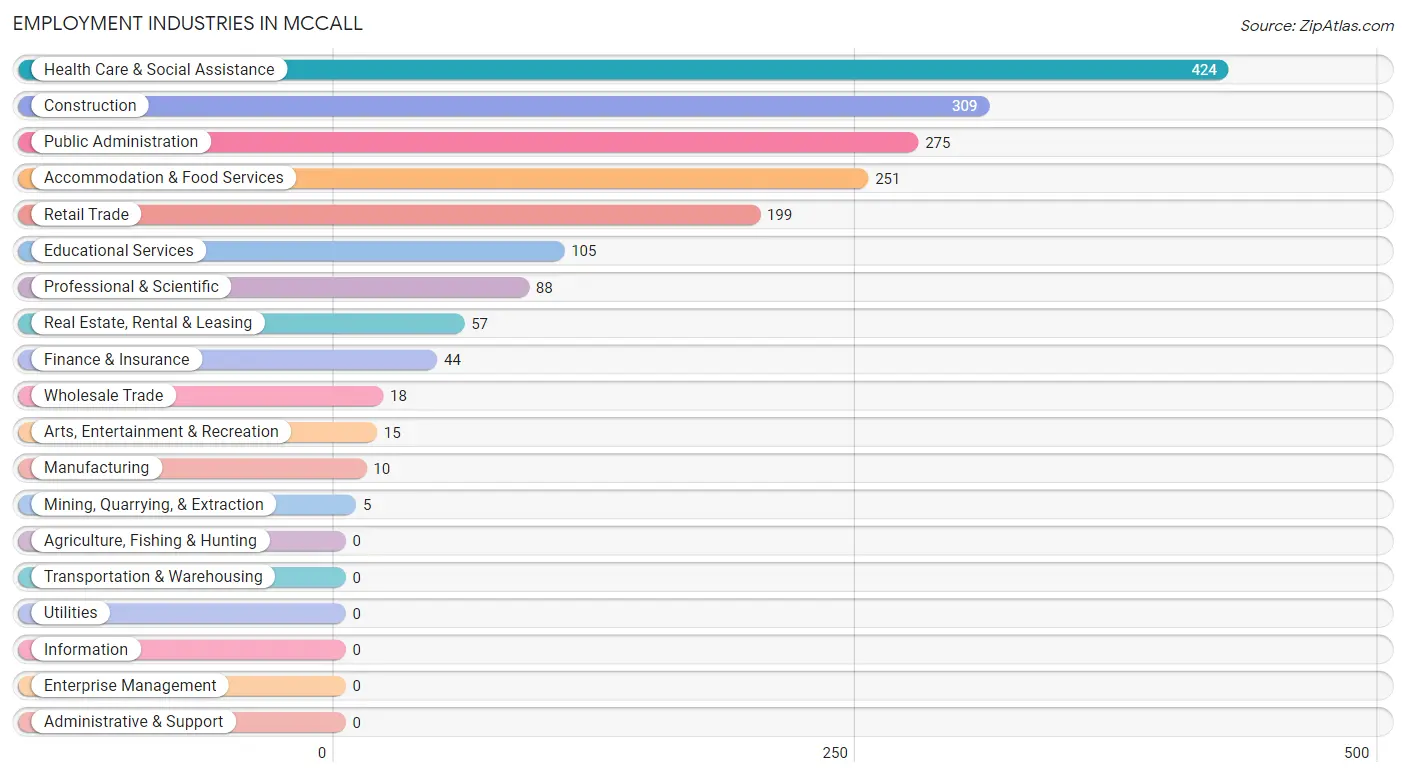
Employment Industries in Mccall
The major employment industries in Mccall include Health Care & Social Assistance (424 | 21.2%), Construction (309 | 15.4%), Public Administration (275 | 13.7%), Accommodation & Food Services (251 | 12.5%), and Retail Trade (199 | 10.0%).
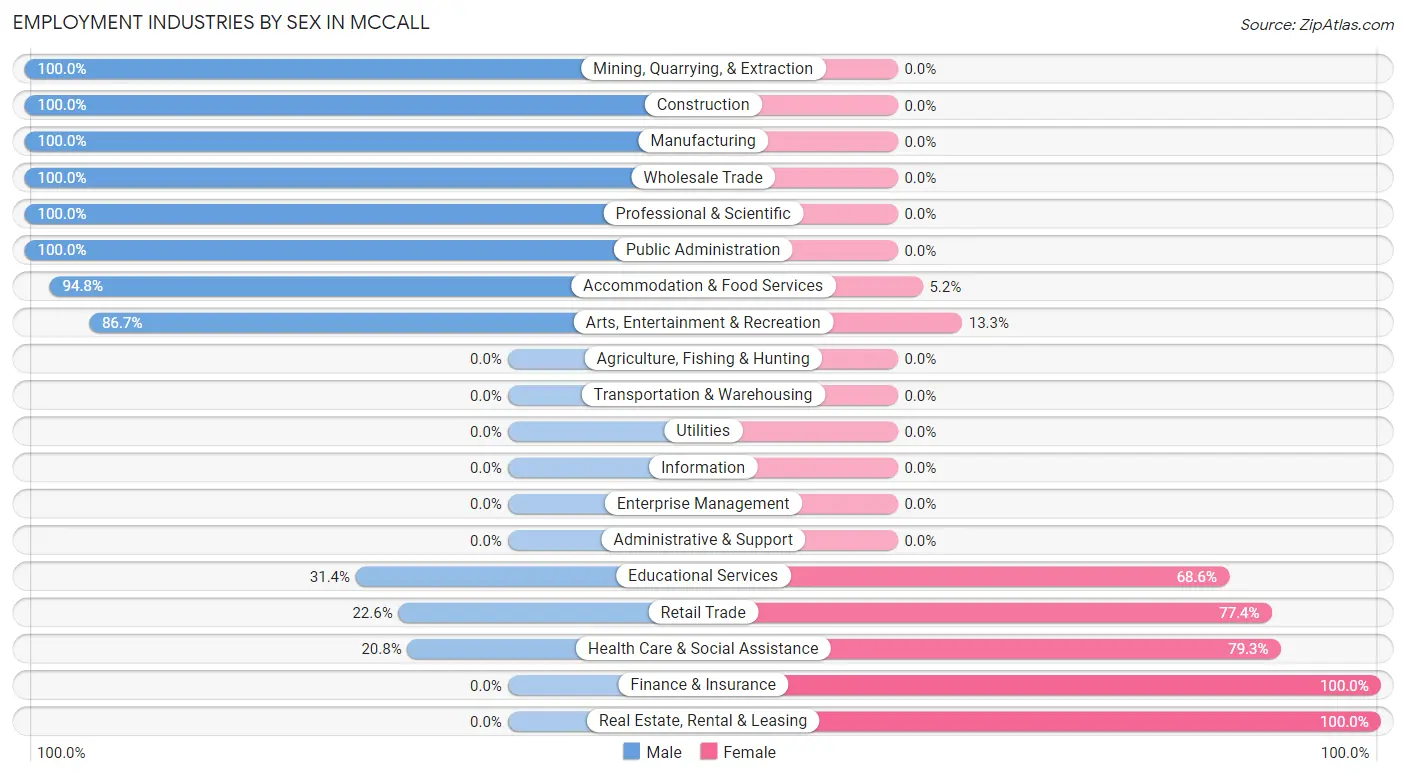
Employment Industries by Sex in Mccall
The Mccall industries that see more men than women are Mining, Quarrying, & Extraction (100.0%), Construction (100.0%), and Manufacturing (100.0%), whereas the industries that tend to have a higher number of women are Finance & Insurance (100.0%), Real Estate, Rental & Leasing (100.0%), and Health Care & Social Assistance (79.2%).
| Industry | Male | Female |
| Agriculture, Fishing & Hunting | 0 (0.0%) | 0 (0.0%) |
| Mining, Quarrying, & Extraction | 5 (100.0%) | 0 (0.0%) |
| Construction | 309 (100.0%) | 0 (0.0%) |
| Manufacturing | 10 (100.0%) | 0 (0.0%) |
| Wholesale Trade | 18 (100.0%) | 0 (0.0%) |
| Retail Trade | 45 (22.6%) | 154 (77.4%) |
| Transportation & Warehousing | 0 (0.0%) | 0 (0.0%) |
| Utilities | 0 (0.0%) | 0 (0.0%) |
| Information | 0 (0.0%) | 0 (0.0%) |
| Finance & Insurance | 0 (0.0%) | 44 (100.0%) |
| Real Estate, Rental & Leasing | 0 (0.0%) | 57 (100.0%) |
| Professional & Scientific | 88 (100.0%) | 0 (0.0%) |
| Enterprise Management | 0 (0.0%) | 0 (0.0%) |
| Administrative & Support | 0 (0.0%) | 0 (0.0%) |
| Educational Services | 33 (31.4%) | 72 (68.6%) |
| Health Care & Social Assistance | 88 (20.7%) | 336 (79.2%) |
| Arts, Entertainment & Recreation | 13 (86.7%) | 2 (13.3%) |
| Accommodation & Food Services | 238 (94.8%) | 13 (5.2%) |
| Public Administration | 275 (100.0%) | 0 (0.0%) |
| Total | 1,180 (59.0%) | 821 (41.0%) |
Education in Mccall
School Enrollment in Mccall
The most common levels of schooling among the 535 students in Mccall are college / undergraduate (147 | 27.5%), high school (121 | 22.6%), and nursery / preschool (115 | 21.5%).
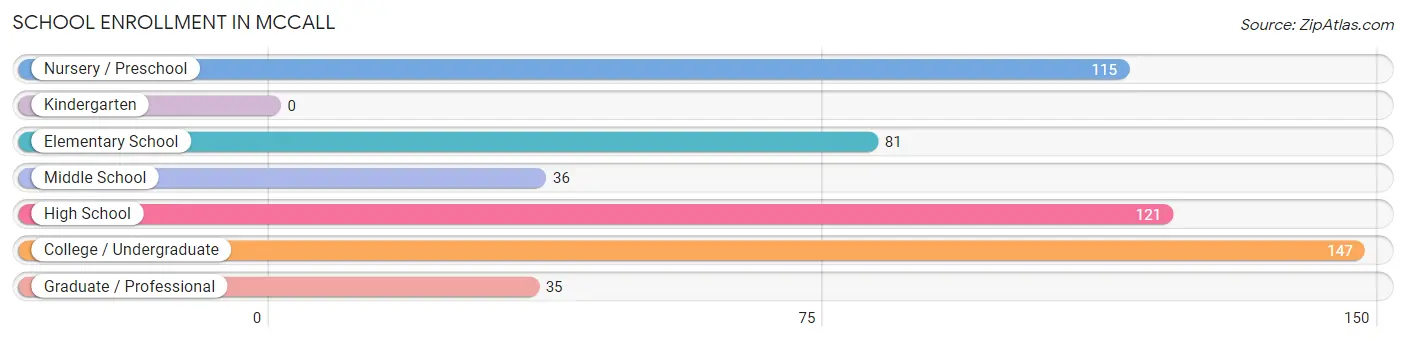
| School Level | # Students | % Students |
| Nursery / Preschool | 115 | 21.5% |
| Kindergarten | 0 | 0.0% |
| Elementary School | 81 | 15.1% |
| Middle School | 36 | 6.7% |
| High School | 121 | 22.6% |
| College / Undergraduate | 147 | 27.5% |
| Graduate / Professional | 35 | 6.5% |
| Total | 535 | 100.0% |
School Enrollment by Age by Funding Source in Mccall
Out of a total of 535 students who are enrolled in schools in Mccall, 224 (41.9%) attend a private institution, while the remaining 311 (58.1%) are enrolled in public schools. The age group of 3 to 4 year olds has the highest likelihood of being enrolled in private schools, with 115 (100.0% in the age bracket) enrolled. Conversely, the age group of 10 to 14 year olds has the lowest likelihood of being enrolled in a private school, with 36 (100.0% in the age bracket) attending a public institution.
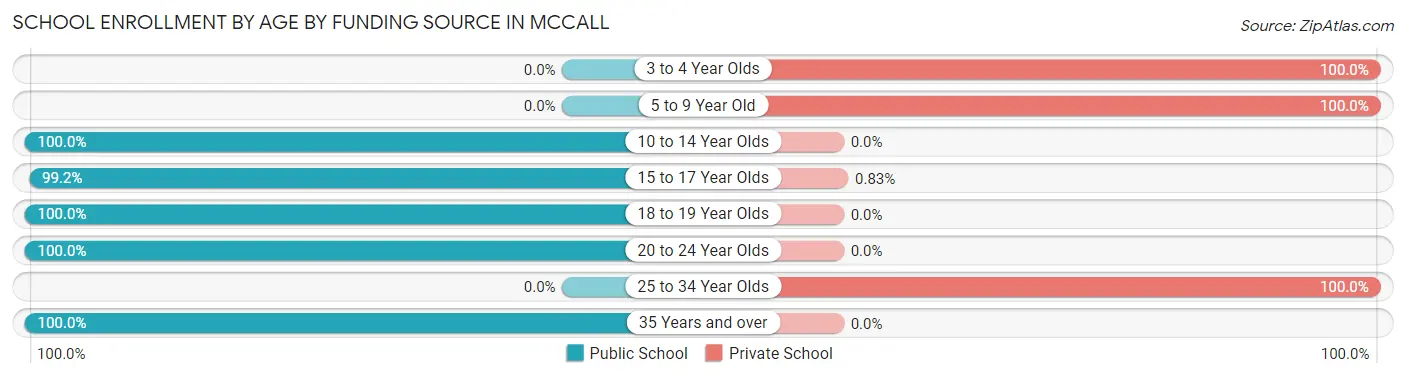
| Age Bracket | Public School | Private School |
| 3 to 4 Year Olds | 0 (0.0%) | 115 (100.0%) |
| 5 to 9 Year Old | 0 (0.0%) | 81 (100.0%) |
| 10 to 14 Year Olds | 36 (100.0%) | 0 (0.0%) |
| 15 to 17 Year Olds | 120 (99.2%) | 1 (0.8%) |
| 18 to 19 Year Olds | 13 (100.0%) | 0 (0.0%) |
| 20 to 24 Year Olds | 110 (100.0%) | 0 (0.0%) |
| 25 to 34 Year Olds | 0 (0.0%) | 27 (100.0%) |
| 35 Years and over | 32 (100.0%) | 0 (0.0%) |
| Total | 311 (58.1%) | 224 (41.9%) |
Educational Attainment by Field of Study in Mccall
Engineering (198 | 14.8%), arts & humanities (158 | 11.8%), education (154 | 11.5%), business (146 | 10.9%), and communications (145 | 10.8%) are the most common fields of study among 1,341 individuals in Mccall who have obtained a bachelor's degree or higher.
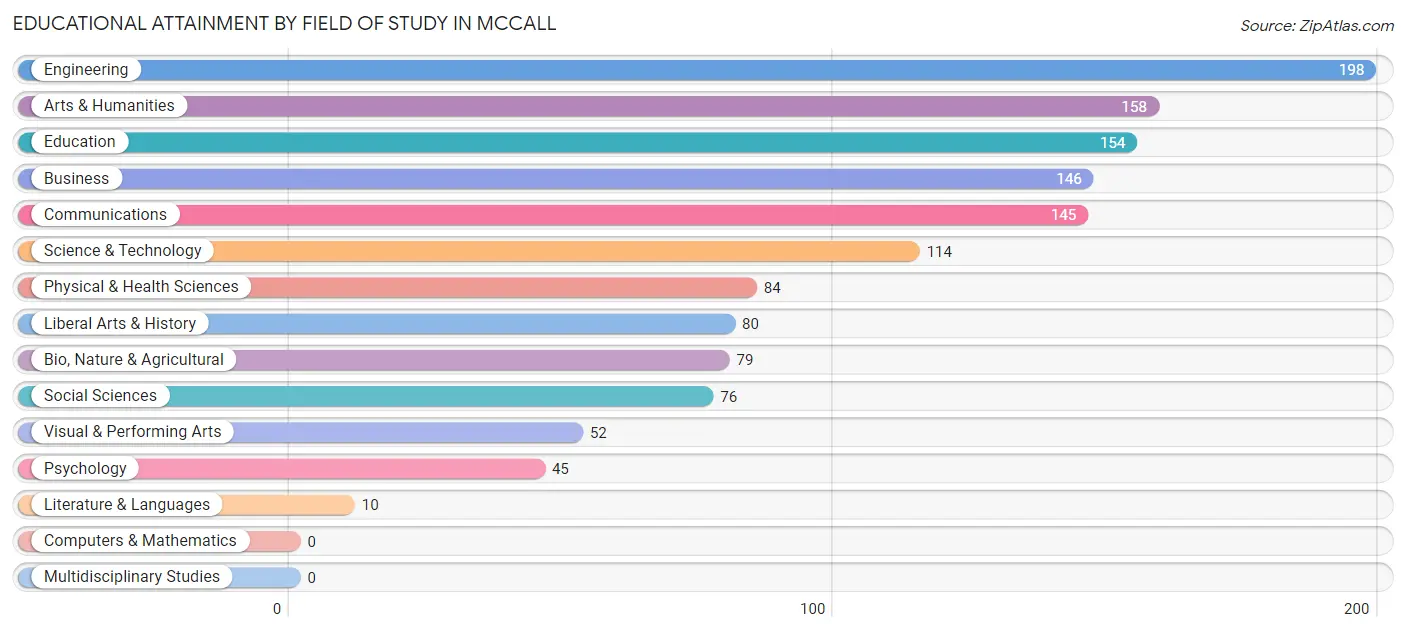
| Field of Study | # Graduates | % Graduates |
| Computers & Mathematics | 0 | 0.0% |
| Bio, Nature & Agricultural | 79 | 5.9% |
| Physical & Health Sciences | 84 | 6.3% |
| Psychology | 45 | 3.4% |
| Social Sciences | 76 | 5.7% |
| Engineering | 198 | 14.8% |
| Multidisciplinary Studies | 0 | 0.0% |
| Science & Technology | 114 | 8.5% |
| Business | 146 | 10.9% |
| Education | 154 | 11.5% |
| Literature & Languages | 10 | 0.7% |
| Liberal Arts & History | 80 | 6.0% |
| Visual & Performing Arts | 52 | 3.9% |
| Communications | 145 | 10.8% |
| Arts & Humanities | 158 | 11.8% |
| Total | 1,341 | 100.0% |
Transportation & Commute in Mccall
Vehicle Availability by Sex in Mccall
The most prevalent vehicle ownership categories in Mccall are males with 2 vehicles (821, accounting for 78.3%) and females with 2 vehicles (407, making up 102.0%).
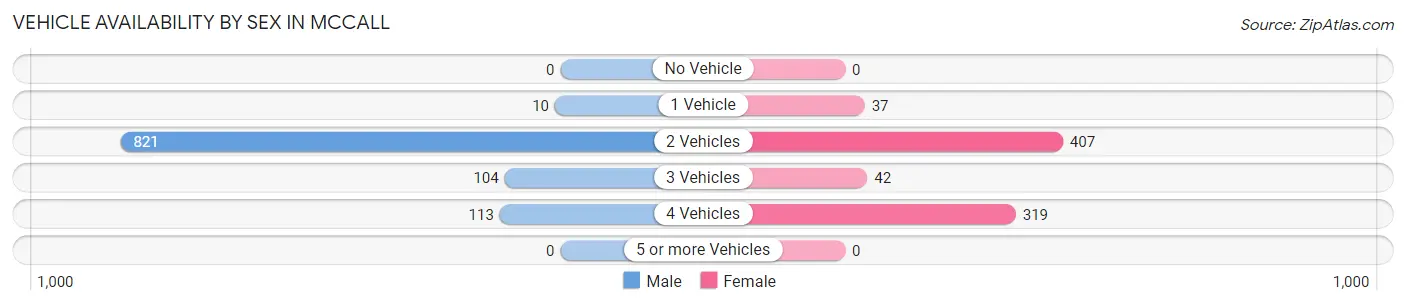
| Vehicles Available | Male | Female |
| No Vehicle | 0 (0.0%) | 0 (0.0%) |
| 1 Vehicle | 10 (0.9%) | 37 (4.6%) |
| 2 Vehicles | 821 (78.3%) | 407 (50.6%) |
| 3 Vehicles | 104 (9.9%) | 42 (5.2%) |
| 4 Vehicles | 113 (10.8%) | 319 (39.6%) |
| 5 or more Vehicles | 0 (0.0%) | 0 (0.0%) |
| Total | 1,048 (100.0%) | 805 (100.0%) |
Commute Time in Mccall
The most frequently occuring commute durations in Mccall are less than 5 minutes (676 commuters, 44.7%), 5 to 9 minutes (458 commuters, 30.3%), and 10 to 14 minutes (206 commuters, 13.6%).
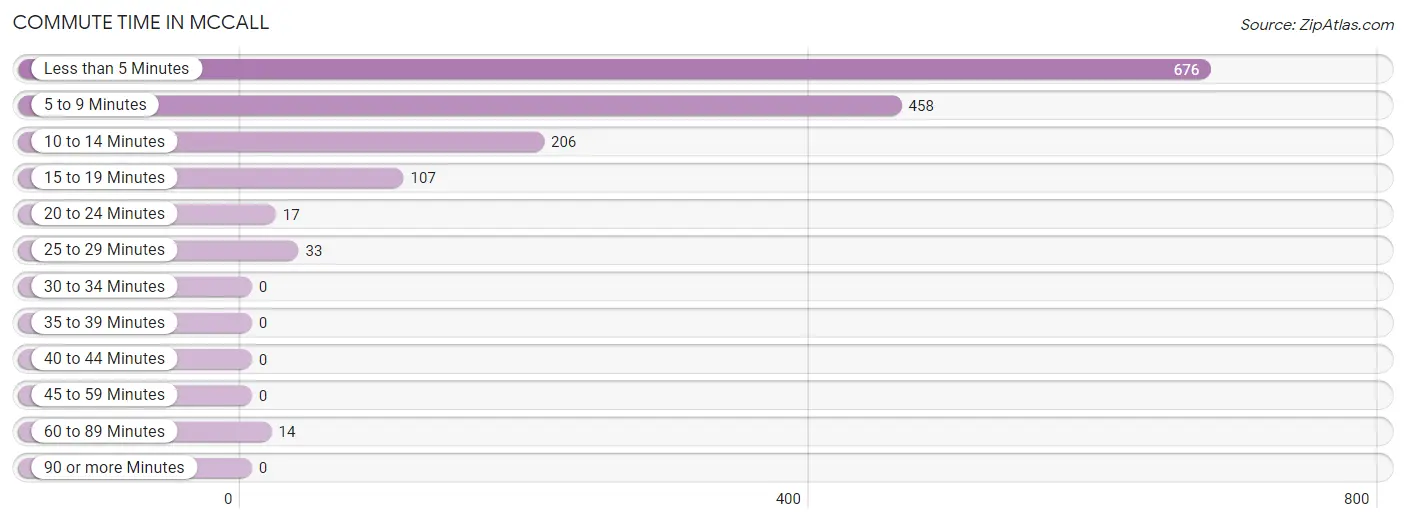
| Commute Time | # Commuters | % Commuters |
| Less than 5 Minutes | 676 | 44.7% |
| 5 to 9 Minutes | 458 | 30.3% |
| 10 to 14 Minutes | 206 | 13.6% |
| 15 to 19 Minutes | 107 | 7.1% |
| 20 to 24 Minutes | 17 | 1.1% |
| 25 to 29 Minutes | 33 | 2.2% |
| 30 to 34 Minutes | 0 | 0.0% |
| 35 to 39 Minutes | 0 | 0.0% |
| 40 to 44 Minutes | 0 | 0.0% |
| 45 to 59 Minutes | 0 | 0.0% |
| 60 to 89 Minutes | 14 | 0.9% |
| 90 or more Minutes | 0 | 0.0% |
Commute Time by Sex in Mccall
The most common commute times in Mccall are 5 to 9 minutes (298 commuters, 41.0%) for males and less than 5 minutes (425 commuters, 54.2%) for females.
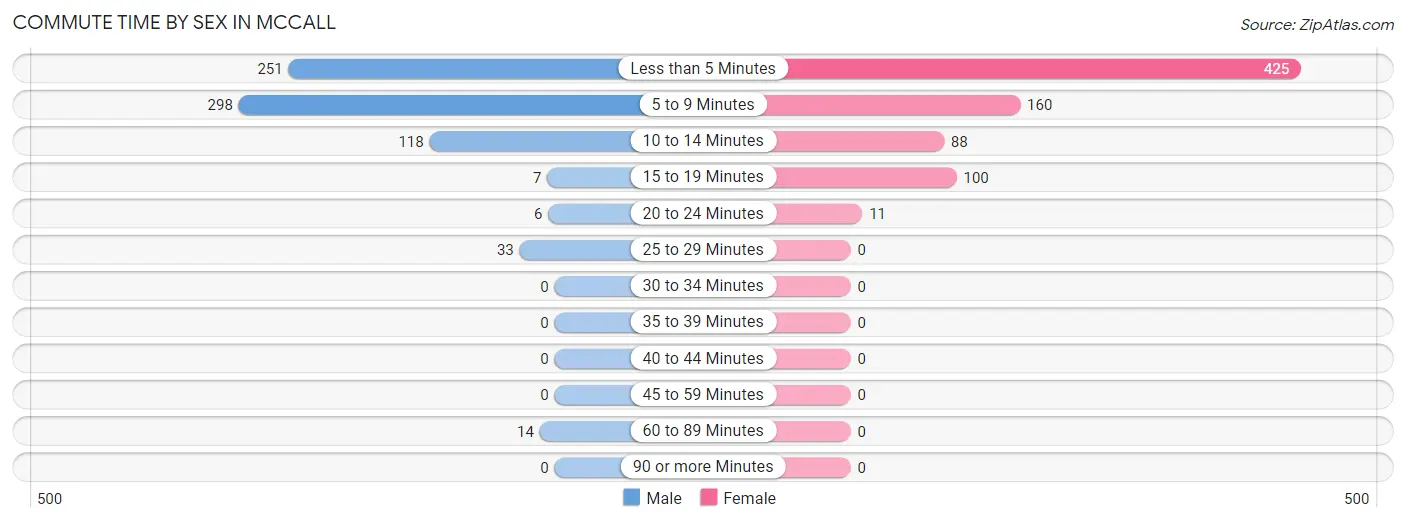
| Commute Time | Male | Female |
| Less than 5 Minutes | 251 (34.5%) | 425 (54.2%) |
| 5 to 9 Minutes | 298 (41.0%) | 160 (20.4%) |
| 10 to 14 Minutes | 118 (16.2%) | 88 (11.2%) |
| 15 to 19 Minutes | 7 (1.0%) | 100 (12.8%) |
| 20 to 24 Minutes | 6 (0.8%) | 11 (1.4%) |
| 25 to 29 Minutes | 33 (4.5%) | 0 (0.0%) |
| 30 to 34 Minutes | 0 (0.0%) | 0 (0.0%) |
| 35 to 39 Minutes | 0 (0.0%) | 0 (0.0%) |
| 40 to 44 Minutes | 0 (0.0%) | 0 (0.0%) |
| 45 to 59 Minutes | 0 (0.0%) | 0 (0.0%) |
| 60 to 89 Minutes | 14 (1.9%) | 0 (0.0%) |
| 90 or more Minutes | 0 (0.0%) | 0 (0.0%) |
Time of Departure to Work by Sex in Mccall
The most frequent times of departure to work in Mccall are 9:00 AM to 9:59 AM (222, 30.5%) for males and 7:30 AM to 7:59 AM (287, 36.6%) for females.
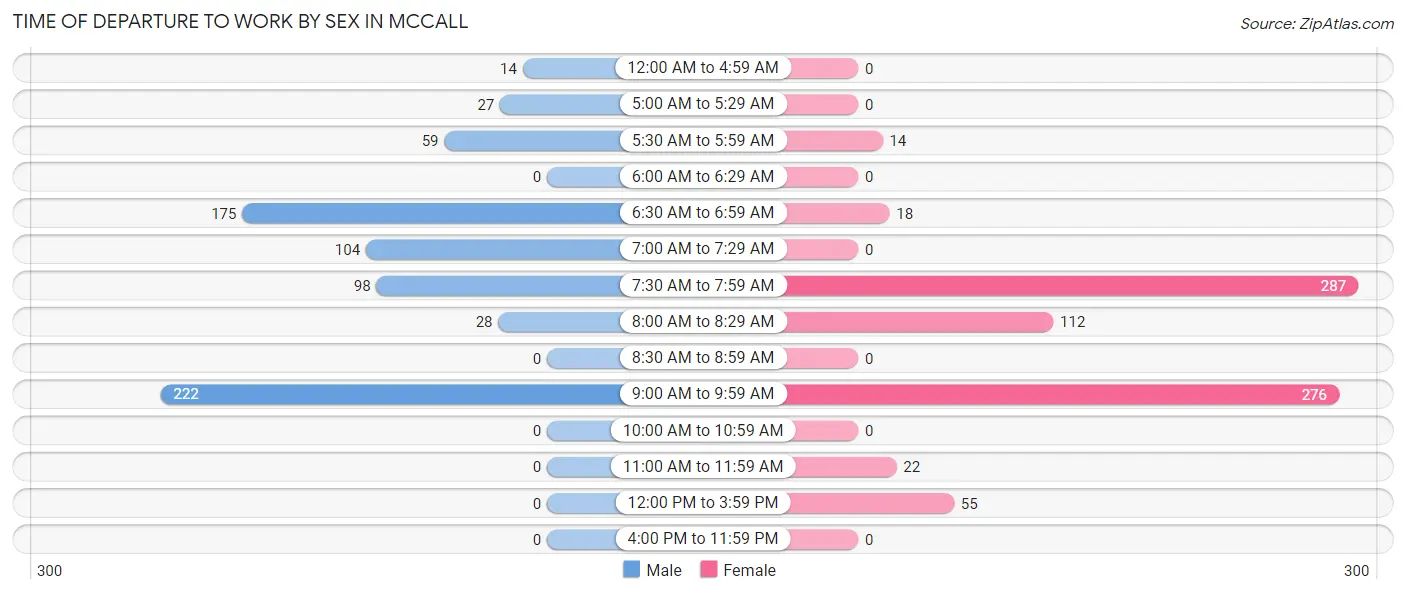
| Time of Departure | Male | Female |
| 12:00 AM to 4:59 AM | 14 (1.9%) | 0 (0.0%) |
| 5:00 AM to 5:29 AM | 27 (3.7%) | 0 (0.0%) |
| 5:30 AM to 5:59 AM | 59 (8.1%) | 14 (1.8%) |
| 6:00 AM to 6:29 AM | 0 (0.0%) | 0 (0.0%) |
| 6:30 AM to 6:59 AM | 175 (24.1%) | 18 (2.3%) |
| 7:00 AM to 7:29 AM | 104 (14.3%) | 0 (0.0%) |
| 7:30 AM to 7:59 AM | 98 (13.5%) | 287 (36.6%) |
| 8:00 AM to 8:29 AM | 28 (3.8%) | 112 (14.3%) |
| 8:30 AM to 8:59 AM | 0 (0.0%) | 0 (0.0%) |
| 9:00 AM to 9:59 AM | 222 (30.5%) | 276 (35.2%) |
| 10:00 AM to 10:59 AM | 0 (0.0%) | 0 (0.0%) |
| 11:00 AM to 11:59 AM | 0 (0.0%) | 22 (2.8%) |
| 12:00 PM to 3:59 PM | 0 (0.0%) | 55 (7.0%) |
| 4:00 PM to 11:59 PM | 0 (0.0%) | 0 (0.0%) |
| Total | 727 (100.0%) | 784 (100.0%) |
Housing Occupancy in Mccall
Occupancy by Ownership in Mccall
Of the total 1,302 dwellings in Mccall, owner-occupied units account for 994 (76.3%), while renter-occupied units make up 308 (23.7%).
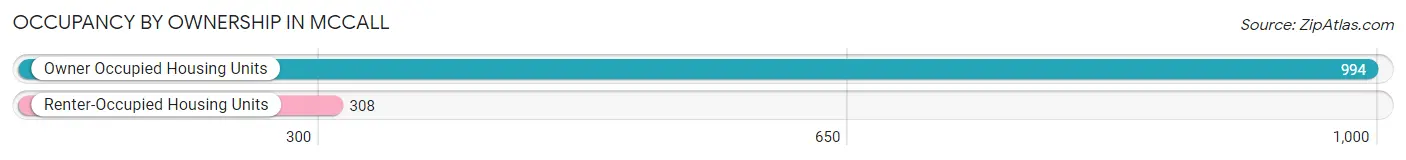
| Occupancy | # Housing Units | % Housing Units |
| Owner Occupied Housing Units | 994 | 76.3% |
| Renter-Occupied Housing Units | 308 | 23.7% |
| Total Occupied Housing Units | 1,302 | 100.0% |
Occupancy by Household Size in Mccall
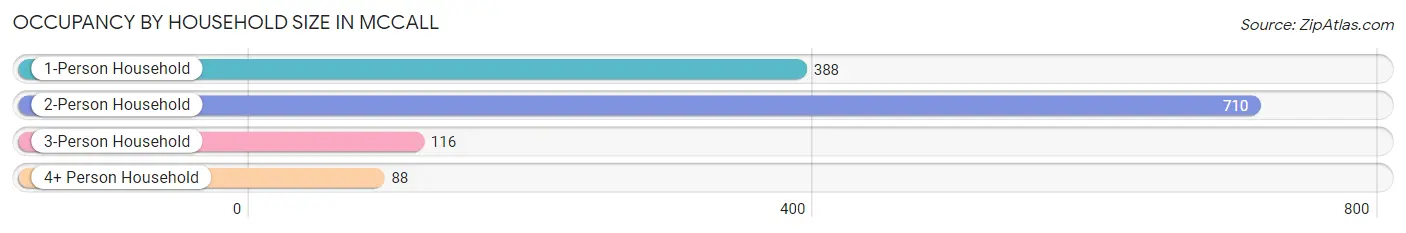
| Household Size | # Housing Units | % Housing Units |
| 1-Person Household | 388 | 29.8% |
| 2-Person Household | 710 | 54.5% |
| 3-Person Household | 116 | 8.9% |
| 4+ Person Household | 88 | 6.8% |
| Total Housing Units | 1,302 | 100.0% |
Occupancy by Ownership by Household Size in Mccall
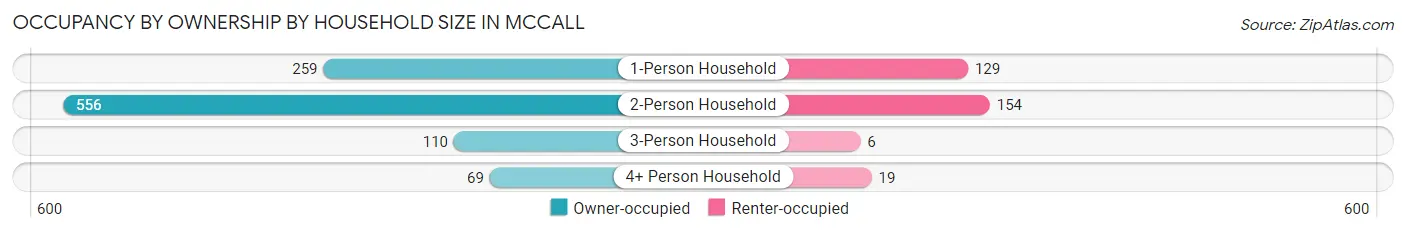
| Household Size | Owner-occupied | Renter-occupied |
| 1-Person Household | 259 (66.7%) | 129 (33.3%) |
| 2-Person Household | 556 (78.3%) | 154 (21.7%) |
| 3-Person Household | 110 (94.8%) | 6 (5.2%) |
| 4+ Person Household | 69 (78.4%) | 19 (21.6%) |
| Total Housing Units | 994 (76.3%) | 308 (23.7%) |
Occupancy by Educational Attainment in Mccall
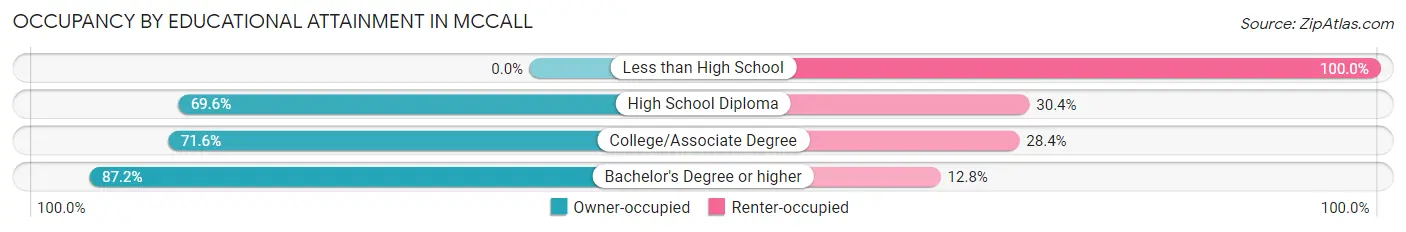
| Household Size | Owner-occupied | Renter-occupied |
| Less than High School | 0 (0.0%) | 53 (100.0%) |
| High School Diploma | 227 (69.6%) | 99 (30.4%) |
| College/Associate Degree | 174 (71.6%) | 69 (28.4%) |
| Bachelor's Degree or higher | 593 (87.2%) | 87 (12.8%) |
Occupancy by Age of Householder in Mccall
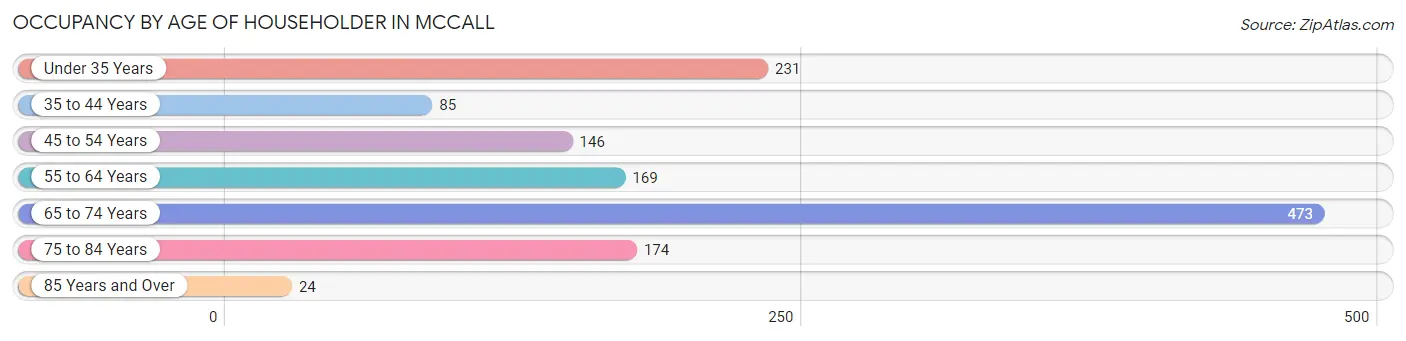
| Age Bracket | # Households | % Households |
| Under 35 Years | 231 | 17.7% |
| 35 to 44 Years | 85 | 6.5% |
| 45 to 54 Years | 146 | 11.2% |
| 55 to 64 Years | 169 | 13.0% |
| 65 to 74 Years | 473 | 36.3% |
| 75 to 84 Years | 174 | 13.4% |
| 85 Years and Over | 24 | 1.8% |
| Total | 1,302 | 100.0% |
Housing Finances in Mccall
Median Income by Occupancy in Mccall
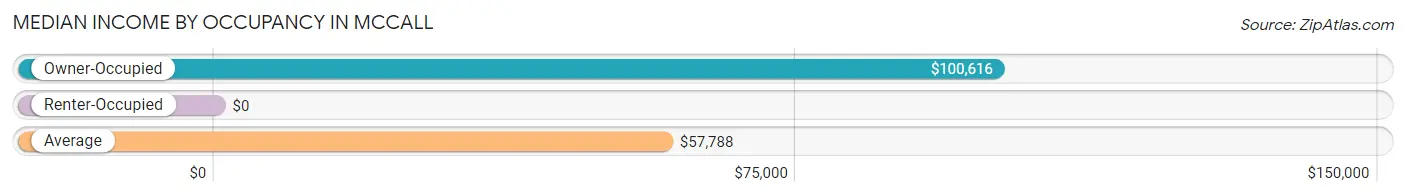
| Occupancy Type | # Households | Median Income |
| Owner-Occupied | 994 (76.3%) | $100,616 |
| Renter-Occupied | 308 (23.7%) | $0 |
| Average | 1,302 (100.0%) | $57,788 |
Occupancy by Householder Income Bracket in Mccall
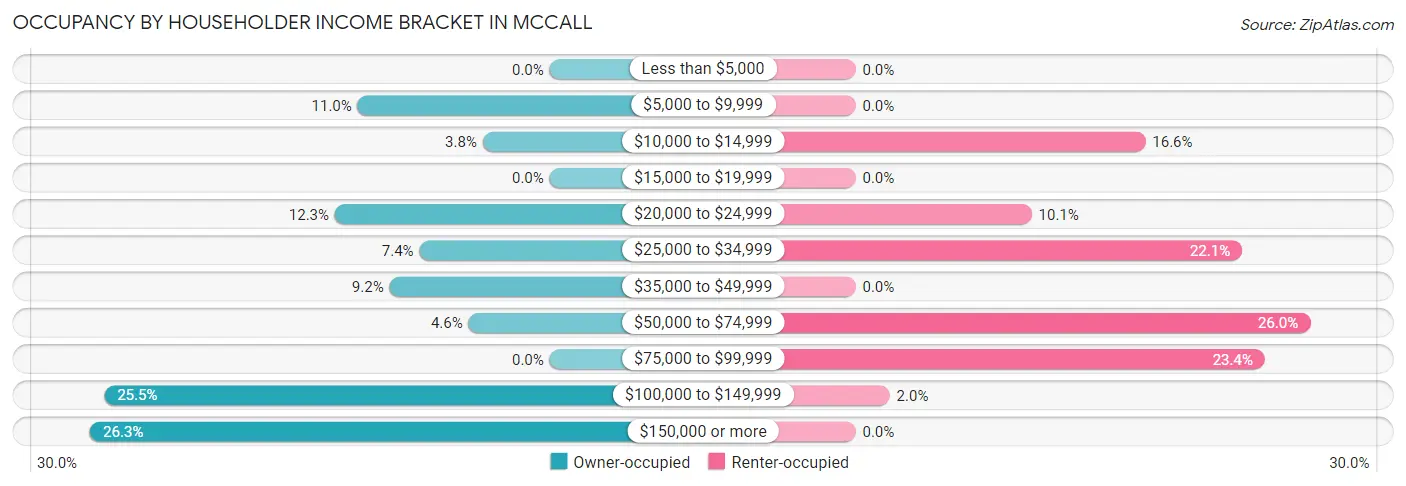
| Income Bracket | Owner-occupied | Renter-occupied |
| Less than $5,000 | 0 (0.0%) | 0 (0.0%) |
| $5,000 to $9,999 | 109 (11.0%) | 0 (0.0%) |
| $10,000 to $14,999 | 38 (3.8%) | 51 (16.6%) |
| $15,000 to $19,999 | 0 (0.0%) | 0 (0.0%) |
| $20,000 to $24,999 | 122 (12.3%) | 31 (10.1%) |
| $25,000 to $34,999 | 74 (7.4%) | 68 (22.1%) |
| $35,000 to $49,999 | 91 (9.1%) | 0 (0.0%) |
| $50,000 to $74,999 | 46 (4.6%) | 80 (26.0%) |
| $75,000 to $99,999 | 0 (0.0%) | 72 (23.4%) |
| $100,000 to $149,999 | 253 (25.5%) | 6 (1.9%) |
| $150,000 or more | 261 (26.3%) | 0 (0.0%) |
| Total | 994 (100.0%) | 308 (100.0%) |
Monthly Housing Cost Tiers in Mccall
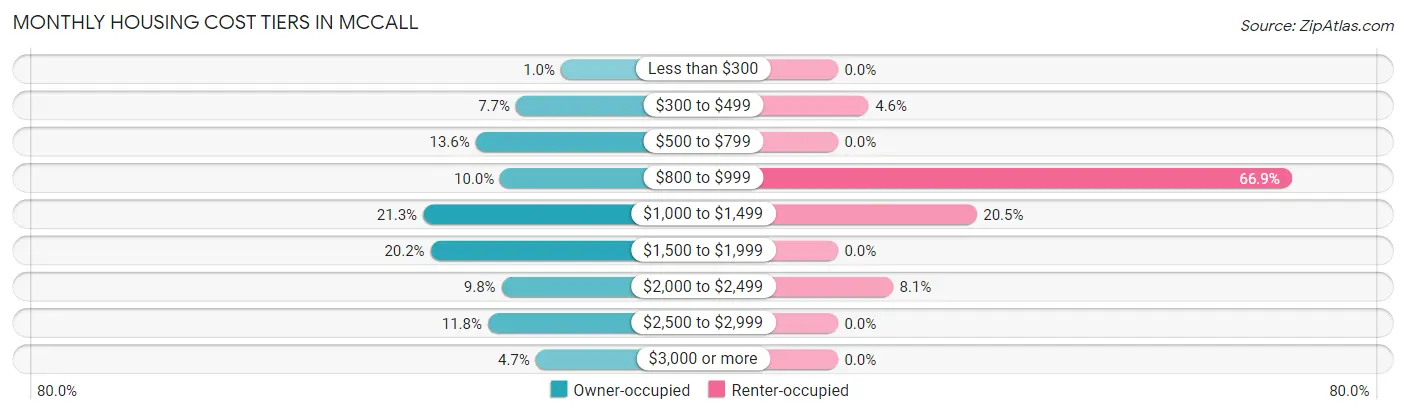
| Monthly Cost | Owner-occupied | Renter-occupied |
| Less than $300 | 10 (1.0%) | 0 (0.0%) |
| $300 to $499 | 76 (7.6%) | 14 (4.5%) |
| $500 to $799 | 135 (13.6%) | 0 (0.0%) |
| $800 to $999 | 99 (10.0%) | 206 (66.9%) |
| $1,000 to $1,499 | 212 (21.3%) | 63 (20.4%) |
| $1,500 to $1,999 | 201 (20.2%) | 0 (0.0%) |
| $2,000 to $2,499 | 97 (9.8%) | 25 (8.1%) |
| $2,500 to $2,999 | 117 (11.8%) | 0 (0.0%) |
| $3,000 or more | 47 (4.7%) | 0 (0.0%) |
| Total | 994 (100.0%) | 308 (100.0%) |
Physical Housing Characteristics in Mccall
Housing Structures in Mccall
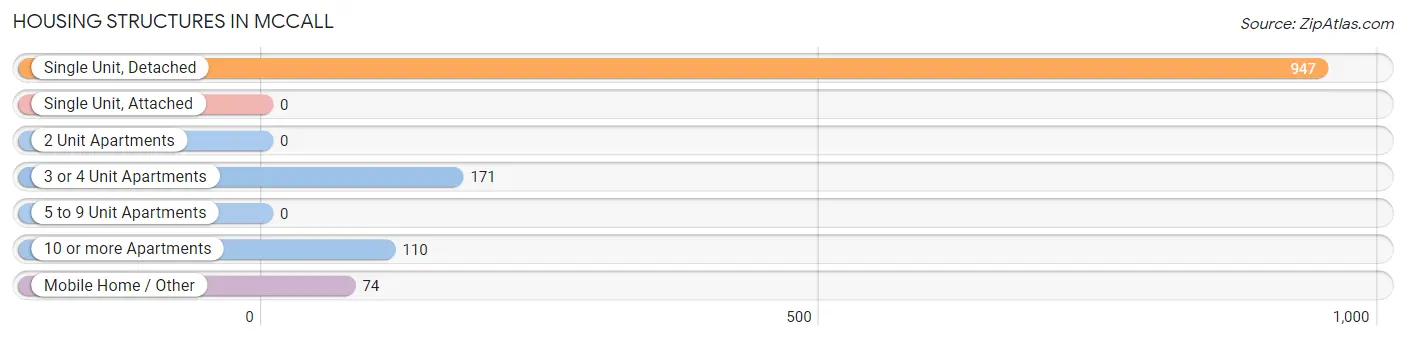
| Structure Type | # Housing Units | % Housing Units |
| Single Unit, Detached | 947 | 72.7% |
| Single Unit, Attached | 0 | 0.0% |
| 2 Unit Apartments | 0 | 0.0% |
| 3 or 4 Unit Apartments | 171 | 13.1% |
| 5 to 9 Unit Apartments | 0 | 0.0% |
| 10 or more Apartments | 110 | 8.5% |
| Mobile Home / Other | 74 | 5.7% |
| Total | 1,302 | 100.0% |
Housing Structures by Occupancy in Mccall
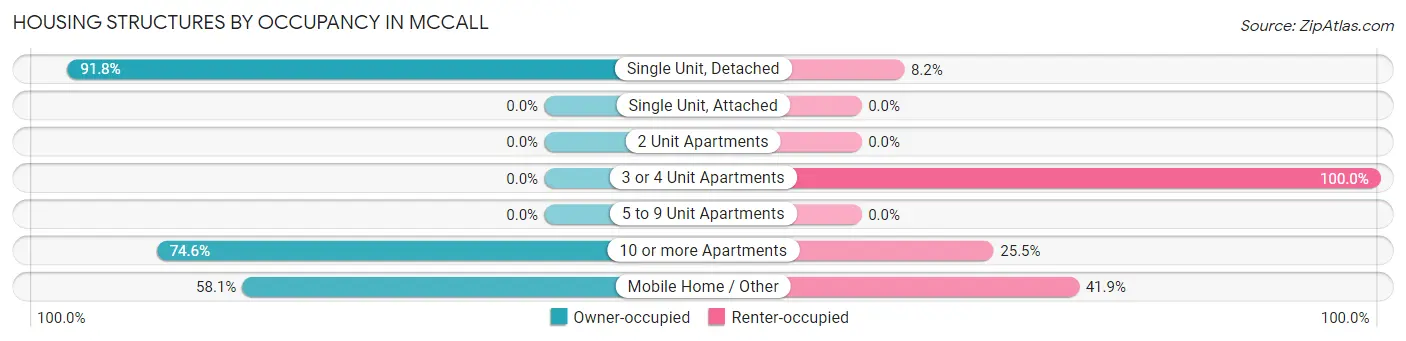
| Structure Type | Owner-occupied | Renter-occupied |
| Single Unit, Detached | 869 (91.8%) | 78 (8.2%) |
| Single Unit, Attached | 0 (0.0%) | 0 (0.0%) |
| 2 Unit Apartments | 0 (0.0%) | 0 (0.0%) |
| 3 or 4 Unit Apartments | 0 (0.0%) | 171 (100.0%) |
| 5 to 9 Unit Apartments | 0 (0.0%) | 0 (0.0%) |
| 10 or more Apartments | 82 (74.6%) | 28 (25.5%) |
| Mobile Home / Other | 43 (58.1%) | 31 (41.9%) |
| Total | 994 (76.3%) | 308 (23.7%) |
Housing Structures by Number of Rooms in Mccall
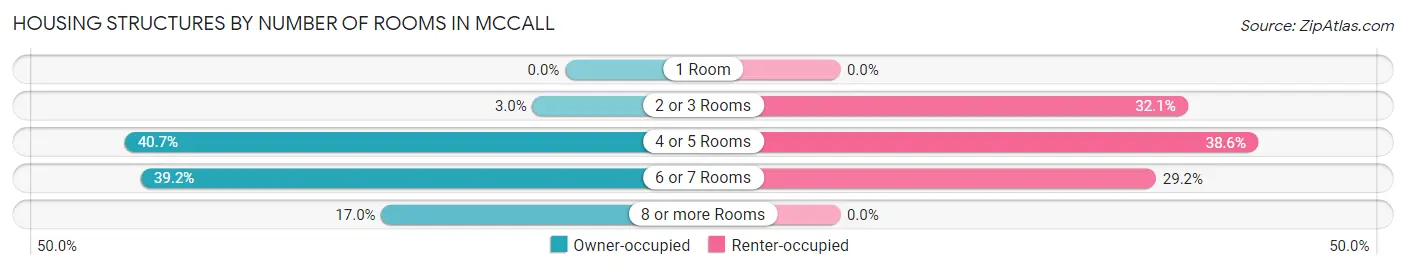
| Number of Rooms | Owner-occupied | Renter-occupied |
| 1 Room | 0 (0.0%) | 0 (0.0%) |
| 2 or 3 Rooms | 30 (3.0%) | 99 (32.1%) |
| 4 or 5 Rooms | 405 (40.7%) | 119 (38.6%) |
| 6 or 7 Rooms | 390 (39.2%) | 90 (29.2%) |
| 8 or more Rooms | 169 (17.0%) | 0 (0.0%) |
| Total | 994 (100.0%) | 308 (100.0%) |
Housing Structure by Heating Type in Mccall
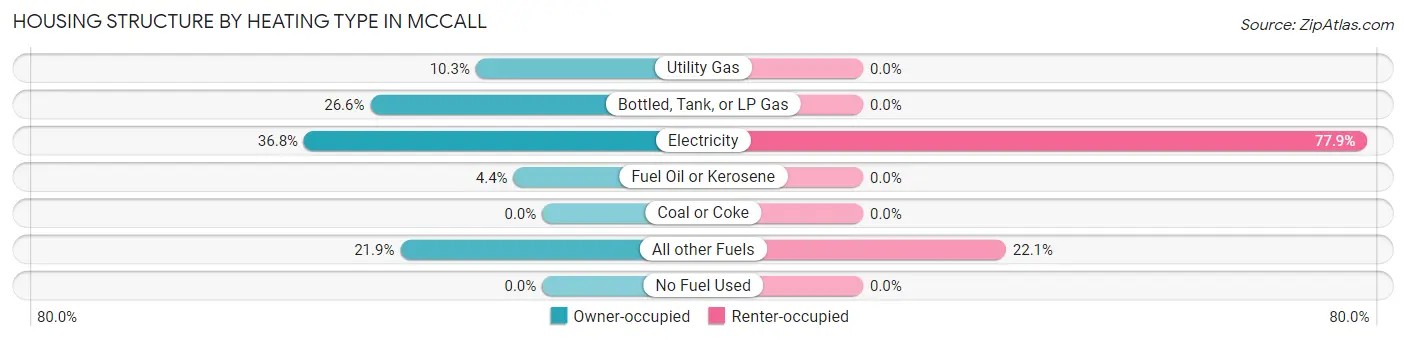
| Heating Type | Owner-occupied | Renter-occupied |
| Utility Gas | 102 (10.3%) | 0 (0.0%) |
| Bottled, Tank, or LP Gas | 264 (26.6%) | 0 (0.0%) |
| Electricity | 366 (36.8%) | 240 (77.9%) |
| Fuel Oil or Kerosene | 44 (4.4%) | 0 (0.0%) |
| Coal or Coke | 0 (0.0%) | 0 (0.0%) |
| All other Fuels | 218 (21.9%) | 68 (22.1%) |
| No Fuel Used | 0 (0.0%) | 0 (0.0%) |
| Total | 994 (100.0%) | 308 (100.0%) |
Household Vehicle Usage in Mccall
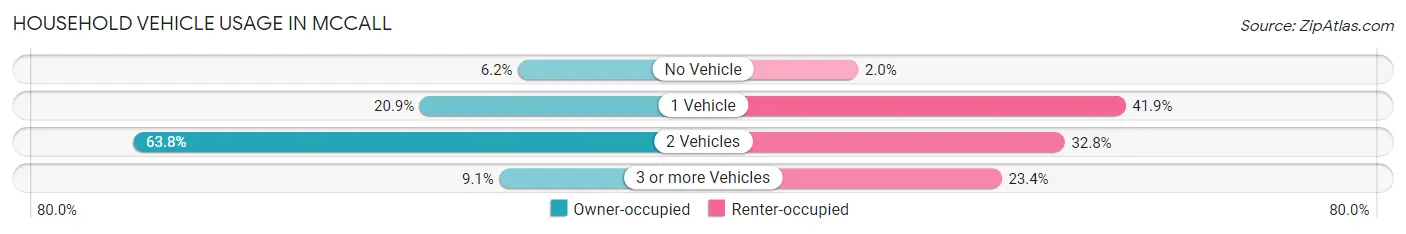
| Vehicles per Household | Owner-occupied | Renter-occupied |
| No Vehicle | 62 (6.2%) | 6 (1.9%) |
| 1 Vehicle | 208 (20.9%) | 129 (41.9%) |
| 2 Vehicles | 634 (63.8%) | 101 (32.8%) |
| 3 or more Vehicles | 90 (9.0%) | 72 (23.4%) |
| Total | 994 (100.0%) | 308 (100.0%) |
Real Estate & Mortgages in Mccall
Real Estate and Mortgage Overview in Mccall
| Characteristic | Without Mortgage | With Mortgage |
| Housing Units | 299 | 695 |
| Median Property Value | $552,700 | $484,500 |
| Median Household Income | - | - |
| Monthly Housing Costs | $675 | $47 |
| Real Estate Taxes | $2,568 | $0 |
Property Value by Mortgage Status in Mccall
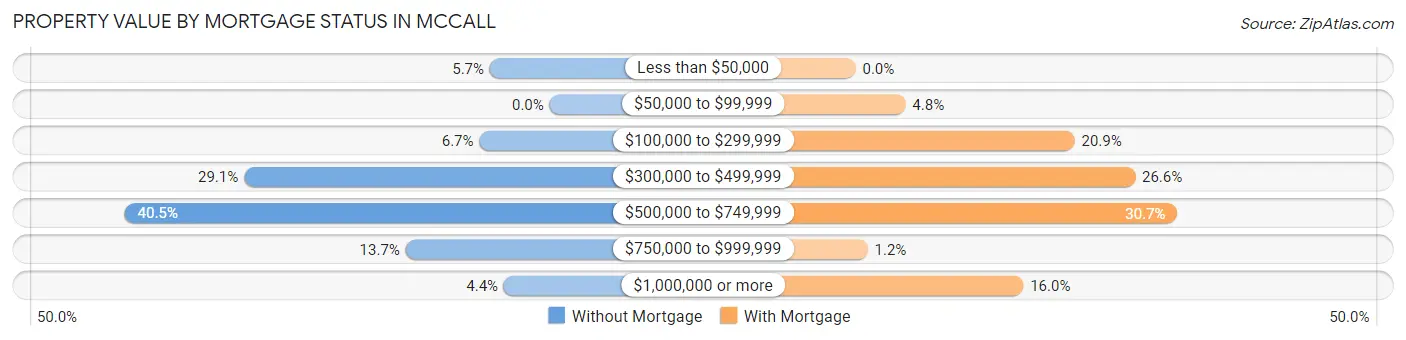
| Property Value | Without Mortgage | With Mortgage |
| Less than $50,000 | 17 (5.7%) | 0 (0.0%) |
| $50,000 to $99,999 | 0 (0.0%) | 33 (4.8%) |
| $100,000 to $299,999 | 20 (6.7%) | 145 (20.9%) |
| $300,000 to $499,999 | 87 (29.1%) | 185 (26.6%) |
| $500,000 to $749,999 | 121 (40.5%) | 213 (30.6%) |
| $750,000 to $999,999 | 41 (13.7%) | 8 (1.1%) |
| $1,000,000 or more | 13 (4.3%) | 111 (16.0%) |
| Total | 299 (100.0%) | 695 (100.0%) |
Household Income by Mortgage Status in Mccall
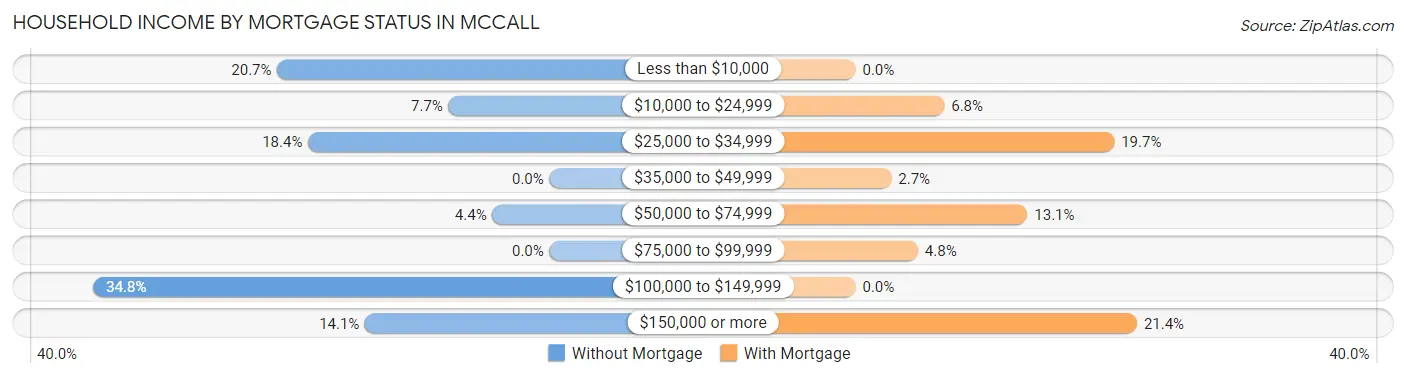
| Household Income | Without Mortgage | With Mortgage |
| Less than $10,000 | 62 (20.7%) | 0 (0.0%) |
| $10,000 to $24,999 | 23 (7.7%) | 47 (6.8%) |
| $25,000 to $34,999 | 55 (18.4%) | 137 (19.7%) |
| $35,000 to $49,999 | 0 (0.0%) | 19 (2.7%) |
| $50,000 to $74,999 | 13 (4.3%) | 91 (13.1%) |
| $75,000 to $99,999 | 0 (0.0%) | 33 (4.8%) |
| $100,000 to $149,999 | 104 (34.8%) | 0 (0.0%) |
| $150,000 or more | 42 (14.1%) | 149 (21.4%) |
| Total | 299 (100.0%) | 695 (100.0%) |
Property Value to Household Income Ratio in Mccall
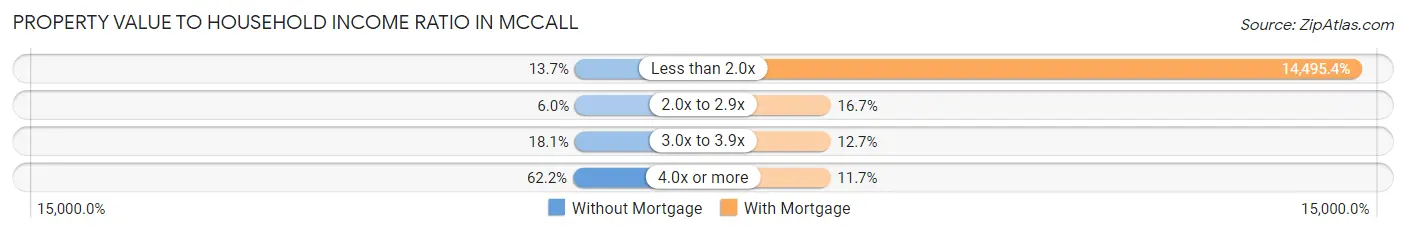
| Value-to-Income Ratio | Without Mortgage | With Mortgage |
| Less than 2.0x | 41 (13.7%) | 100,743 (14,495.4%) |
| 2.0x to 2.9x | 18 (6.0%) | 116 (16.7%) |
| 3.0x to 3.9x | 54 (18.1%) | 88 (12.7%) |
| 4.0x or more | 186 (62.2%) | 81 (11.7%) |
| Total | 299 (100.0%) | 695 (100.0%) |
Real Estate Taxes by Mortgage Status in Mccall
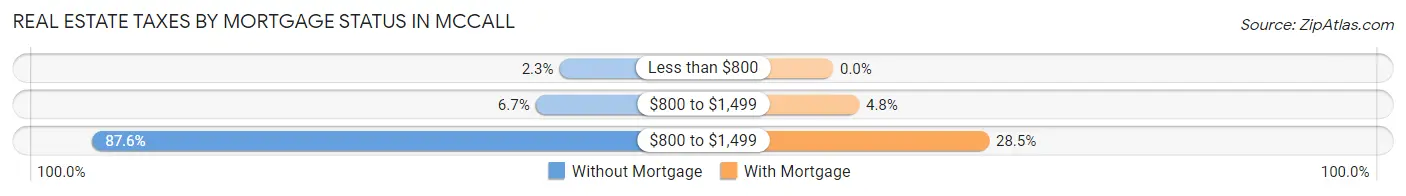
| Property Taxes | Without Mortgage | With Mortgage |
| Less than $800 | 7 (2.3%) | 0 (0.0%) |
| $800 to $1,499 | 20 (6.7%) | 33 (4.8%) |
| $800 to $1,499 | 262 (87.6%) | 198 (28.5%) |
| Total | 299 (100.0%) | 695 (100.0%) |
Health & Disability in Mccall
Health Insurance Coverage by Age in Mccall
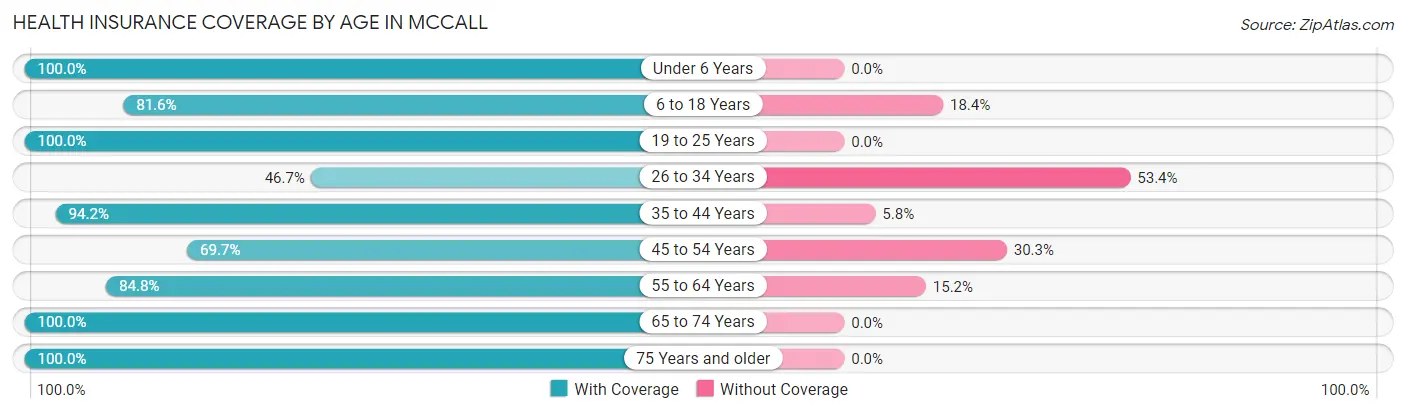
| Age Bracket | With Coverage | Without Coverage |
| Under 6 Years | 341 (100.0%) | 0 (0.0%) |
| 6 to 18 Years | 195 (81.6%) | 44 (18.4%) |
| 19 to 25 Years | 337 (100.0%) | 0 (0.0%) |
| 26 to 34 Years | 265 (46.7%) | 303 (53.3%) |
| 35 to 44 Years | 617 (94.2%) | 38 (5.8%) |
| 45 to 54 Years | 177 (69.7%) | 77 (30.3%) |
| 55 to 64 Years | 262 (84.8%) | 47 (15.2%) |
| 65 to 74 Years | 748 (100.0%) | 0 (0.0%) |
| 75 Years and older | 238 (100.0%) | 0 (0.0%) |
| Total | 3,180 (86.2%) | 509 (13.8%) |
Health Insurance Coverage by Citizenship Status in Mccall
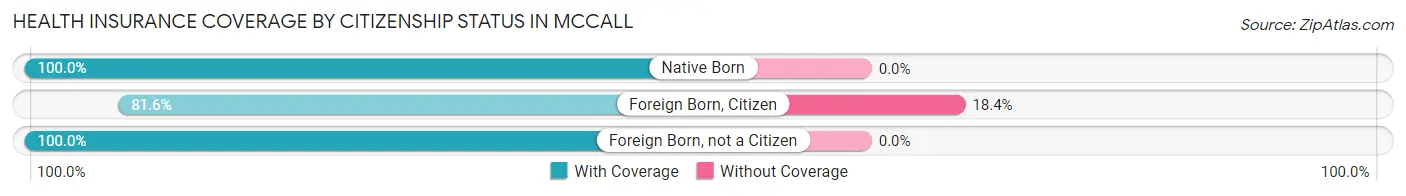
| Citizenship Status | With Coverage | Without Coverage |
| Native Born | 341 (100.0%) | 0 (0.0%) |
| Foreign Born, Citizen | 195 (81.6%) | 44 (18.4%) |
| Foreign Born, not a Citizen | 337 (100.0%) | 0 (0.0%) |
Health Insurance Coverage by Household Income in Mccall
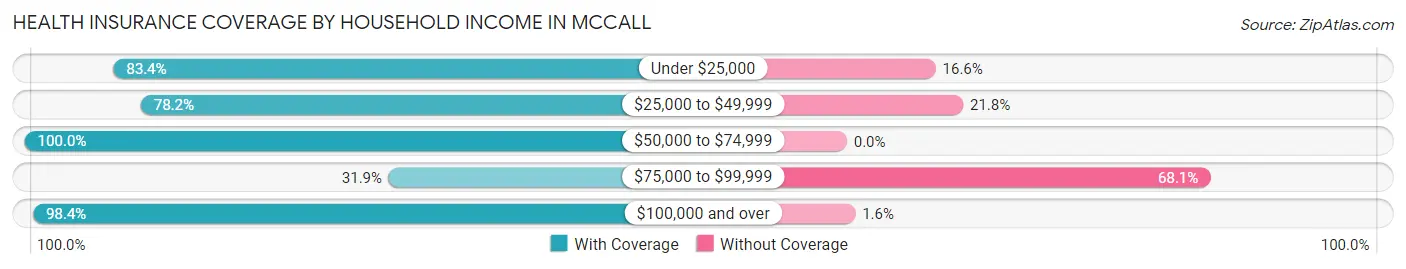
| Household Income | With Coverage | Without Coverage |
| Under $25,000 | 466 (83.4%) | 93 (16.6%) |
| $25,000 to $49,999 | 255 (78.2%) | 71 (21.8%) |
| $50,000 to $74,999 | 557 (100.0%) | 0 (0.0%) |
| $75,000 to $99,999 | 138 (31.9%) | 294 (68.1%) |
| $100,000 and over | 1,695 (98.4%) | 27 (1.6%) |
Public vs Private Health Insurance Coverage by Age in Mccall
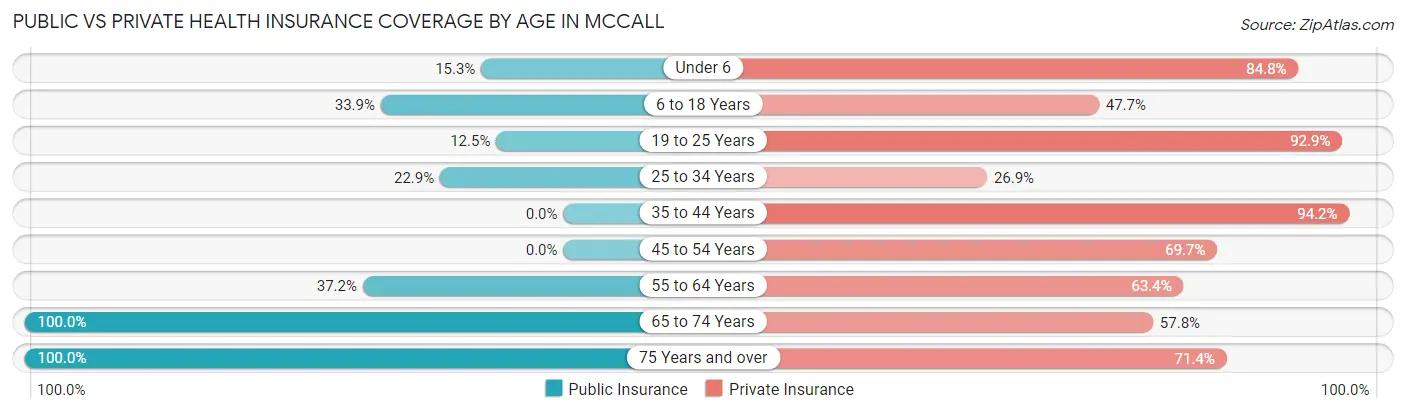
| Age Bracket | Public Insurance | Private Insurance |
| Under 6 | 52 (15.2%) | 289 (84.8%) |
| 6 to 18 Years | 81 (33.9%) | 114 (47.7%) |
| 19 to 25 Years | 42 (12.5%) | 313 (92.9%) |
| 25 to 34 Years | 130 (22.9%) | 153 (26.9%) |
| 35 to 44 Years | 0 (0.0%) | 617 (94.2%) |
| 45 to 54 Years | 0 (0.0%) | 177 (69.7%) |
| 55 to 64 Years | 115 (37.2%) | 196 (63.4%) |
| 65 to 74 Years | 748 (100.0%) | 432 (57.8%) |
| 75 Years and over | 238 (100.0%) | 170 (71.4%) |
| Total | 1,406 (38.1%) | 2,461 (66.7%) |
Disability Status by Sex by Age in Mccall
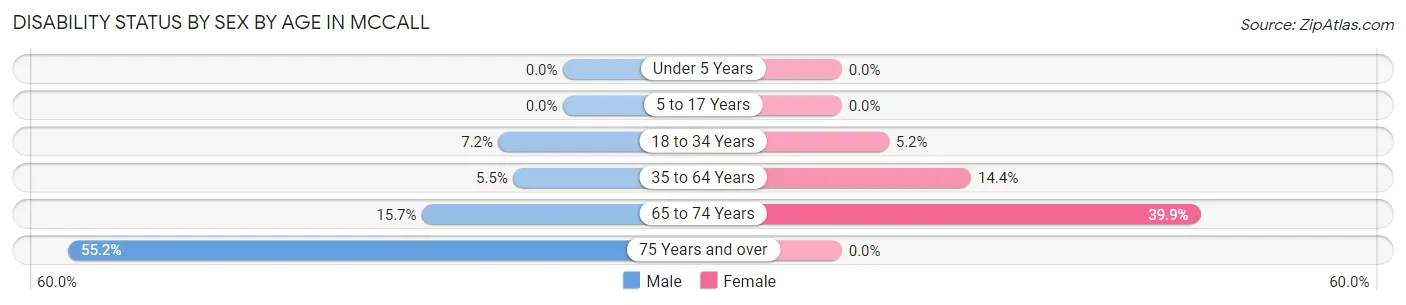
| Age Bracket | Male | Female |
| Under 5 Years | 0 (0.0%) | 0 (0.0%) |
| 5 to 17 Years | 0 (0.0%) | 0 (0.0%) |
| 18 to 34 Years | 31 (7.2%) | 25 (5.2%) |
| 35 to 64 Years | 47 (5.5%) | 53 (14.4%) |
| 65 to 74 Years | 62 (15.7%) | 141 (39.9%) |
| 75 Years and over | 107 (55.1%) | 0 (0.0%) |
Disability Class by Sex by Age in Mccall
Disability Class: Hearing Difficulty
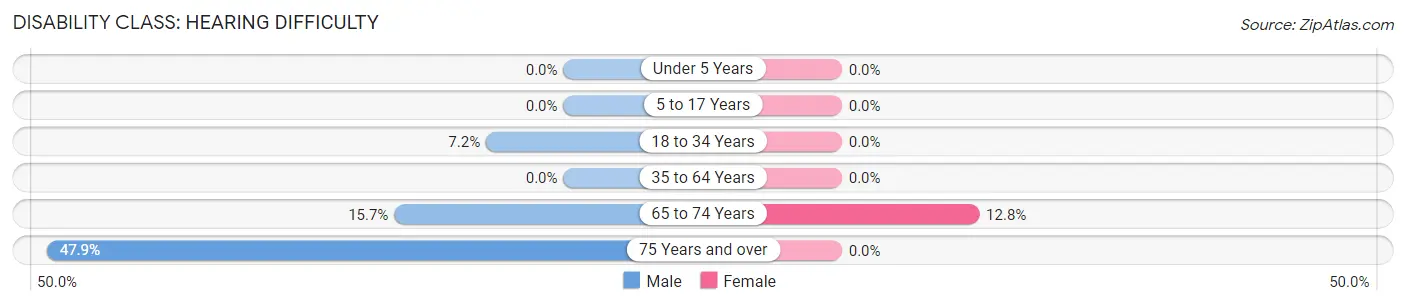
| Age Bracket | Male | Female |
| Under 5 Years | 0 (0.0%) | 0 (0.0%) |
| 5 to 17 Years | 0 (0.0%) | 0 (0.0%) |
| 18 to 34 Years | 31 (7.2%) | 0 (0.0%) |
| 35 to 64 Years | 0 (0.0%) | 0 (0.0%) |
| 65 to 74 Years | 62 (15.7%) | 45 (12.8%) |
| 75 Years and over | 93 (47.9%) | 0 (0.0%) |
Disability Class: Vision Difficulty
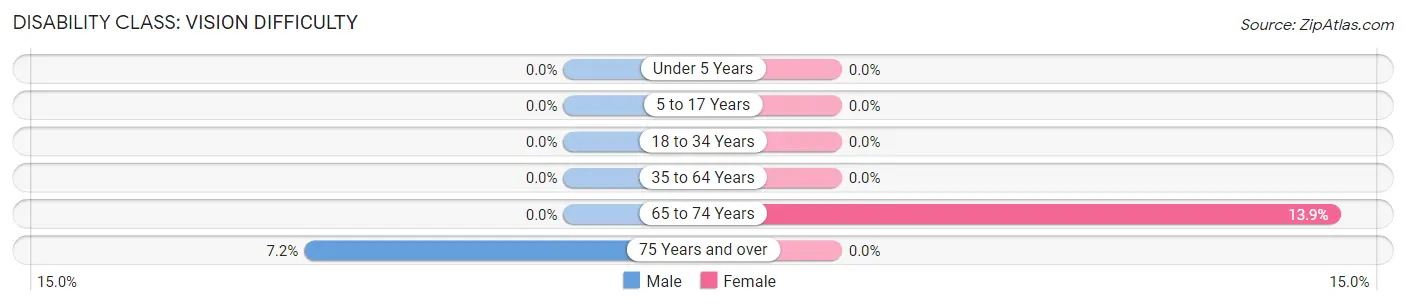
| Age Bracket | Male | Female |
| Under 5 Years | 0 (0.0%) | 0 (0.0%) |
| 5 to 17 Years | 0 (0.0%) | 0 (0.0%) |
| 18 to 34 Years | 0 (0.0%) | 0 (0.0%) |
| 35 to 64 Years | 0 (0.0%) | 0 (0.0%) |
| 65 to 74 Years | 0 (0.0%) | 49 (13.9%) |
| 75 Years and over | 14 (7.2%) | 0 (0.0%) |
Disability Class: Cognitive Difficulty
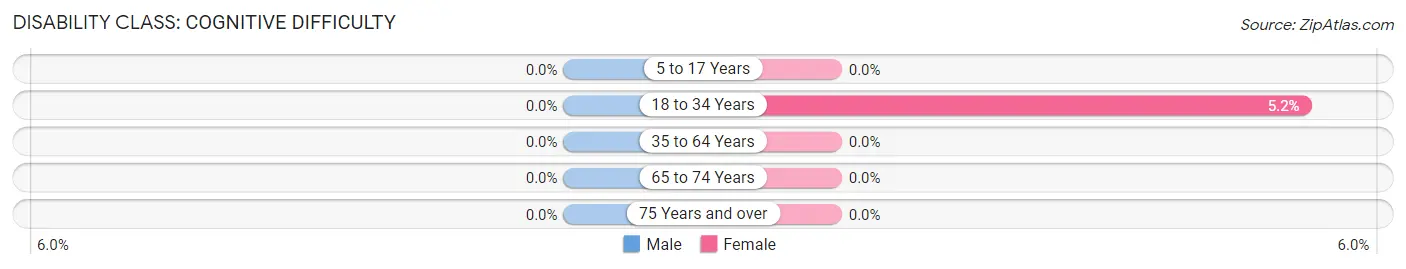
| Age Bracket | Male | Female |
| 5 to 17 Years | 0 (0.0%) | 0 (0.0%) |
| 18 to 34 Years | 0 (0.0%) | 25 (5.2%) |
| 35 to 64 Years | 0 (0.0%) | 0 (0.0%) |
| 65 to 74 Years | 0 (0.0%) | 0 (0.0%) |
| 75 Years and over | 0 (0.0%) | 0 (0.0%) |
Disability Class: Ambulatory Difficulty
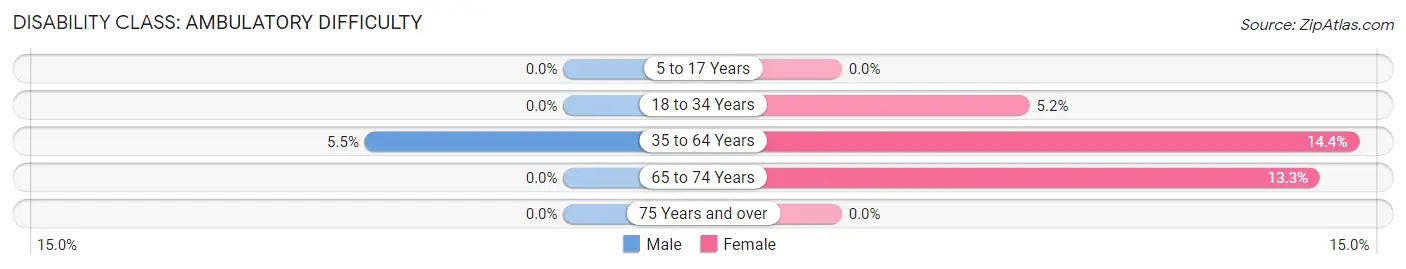
| Age Bracket | Male | Female |
| 5 to 17 Years | 0 (0.0%) | 0 (0.0%) |
| 18 to 34 Years | 0 (0.0%) | 25 (5.2%) |
| 35 to 64 Years | 47 (5.5%) | 53 (14.4%) |
| 65 to 74 Years | 0 (0.0%) | 47 (13.3%) |
| 75 Years and over | 0 (0.0%) | 0 (0.0%) |
Disability Class: Self-Care Difficulty
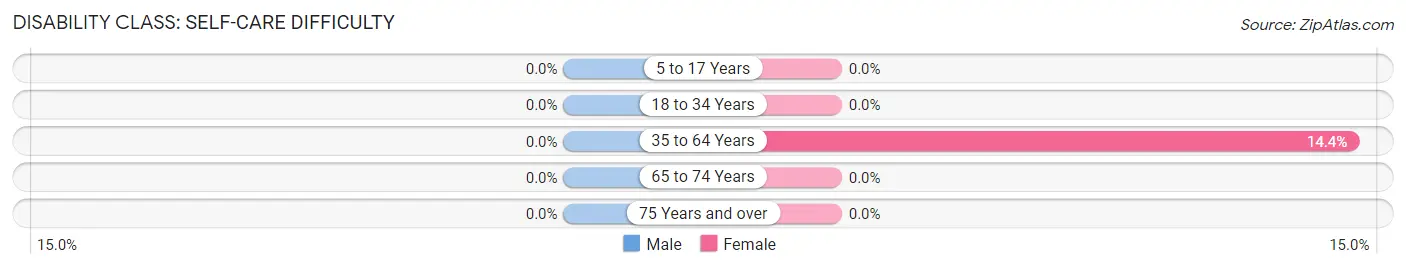
| Age Bracket | Male | Female |
| 5 to 17 Years | 0 (0.0%) | 0 (0.0%) |
| 18 to 34 Years | 0 (0.0%) | 0 (0.0%) |
| 35 to 64 Years | 0 (0.0%) | 53 (14.4%) |
| 65 to 74 Years | 0 (0.0%) | 0 (0.0%) |
| 75 Years and over | 0 (0.0%) | 0 (0.0%) |
Technology Access in Mccall
Computing Device Access in Mccall
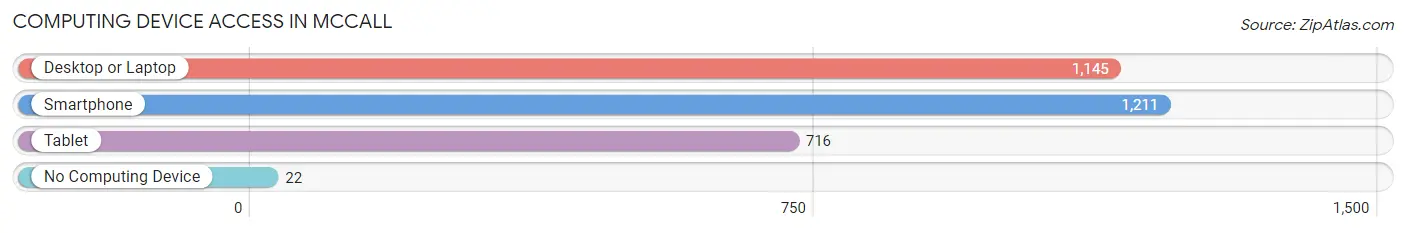
| Device Type | # Households | % Households |
| Desktop or Laptop | 1,145 | 87.9% |
| Smartphone | 1,211 | 93.0% |
| Tablet | 716 | 55.0% |
| No Computing Device | 22 | 1.7% |
| Total | 1,302 | 100.0% |
Internet Access in Mccall
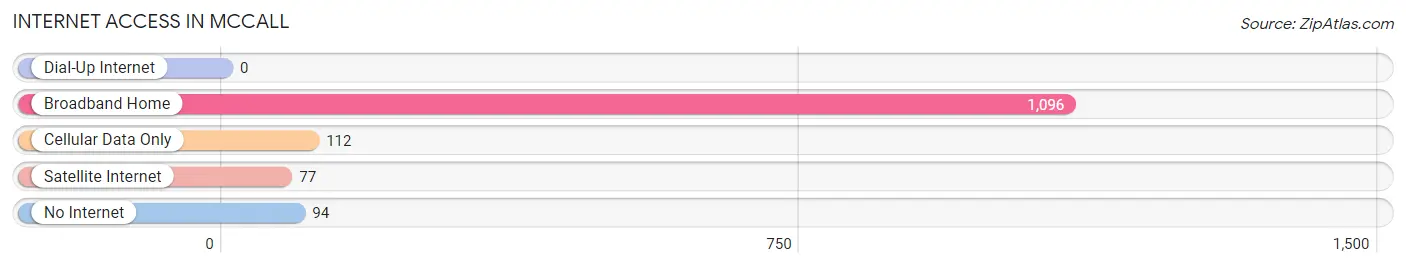
| Internet Type | # Households | % Households |
| Dial-Up Internet | 0 | 0.0% |
| Broadband Home | 1,096 | 84.2% |
| Cellular Data Only | 112 | 8.6% |
| Satellite Internet | 77 | 5.9% |
| No Internet | 94 | 7.2% |
| Total | 1,302 | 100.0% |
Mccall Summary
Mccall, Idaho is a small city located in Valley County, Idaho. It is situated on the western shore of Payette Lake, and is surrounded by the Payette National Forest. The city is known for its outdoor recreation opportunities, including skiing, snowmobiling, fishing, and camping.
History
Mccall was founded in 1890 by Thomas Mccall, a prospector who discovered gold in the area. The city was originally named "Mccall City" after its founder, but the name was later changed to Mccall. The city was incorporated in 1911, and the first mayor was elected in 1912.
The city grew rapidly in the early 20th century, and by the 1930s, it had become a popular tourist destination. The city was home to several resorts, including the Hotel Mccall, which was built in 1929. The city also had a thriving lumber industry, and the Mccall Lumber Company was one of the largest employers in the area.
The city experienced a decline in the 1950s and 1960s, as the lumber industry declined and tourism decreased. However, the city has since experienced a resurgence, and is now a popular destination for outdoor recreation.
Geography
Mccall is located in Valley County, Idaho, on the western shore of Payette Lake. The city is surrounded by the Payette National Forest, and is located approximately 80 miles north of Boise. The city has a total area of 4.2 square miles, and has an elevation of 4,919 feet.
The climate in Mccall is generally mild, with warm summers and cold winters. The average high temperature in July is 85 degrees Fahrenheit, and the average low temperature in January is 18 degrees Fahrenheit.
Economy
The economy of Mccall is largely based on tourism and outdoor recreation. The city is home to several resorts, including the Hotel Mccall, which is a popular destination for visitors. The city also has a thriving lumber industry, and the Mccall Lumber Company is one of the largest employers in the area.
The city is also home to several manufacturing companies, including the Mccall Manufacturing Company, which produces a variety of products, including furniture, cabinetry, and windows.
Demographics
As of the 2010 census, the population of Mccall was 2,991. The racial makeup of the city was 95.3% White, 0.3% African American, 0.7% Native American, 0.7% Asian, 0.1% Pacific Islander, 0.7% from other races, and 2.0% from two or more races. Hispanic or Latino of any race were 2.7% of the population.
The median household income in Mccall was $41,944, and the median family income was $50,917. The per capita income was $25,945. About 11.3% of families and 14.2% of the population were below the poverty line, including 18.2% of those under age 18 and 8.2% of those age 65 or over.
Common Questions
What is Per Capita Income in Mccall?
Per Capita income in Mccall is $45,117.
What is the Median Family Income in Mccall?
Median Family Income in Mccall is $124,286.
What is the Median Household income in Mccall?
Median Household Income in Mccall is $57,788.
What is Income or Wage Gap in Mccall?
Income or Wage Gap in Mccall is 46.2%.
Women in Mccall earn 53.8 cents for every dollar earned by a man.
What is Inequality or Gini Index in Mccall?
Inequality or Gini Index in Mccall is 0.54.
What is the Total Population of Mccall?
Total Population of Mccall is 3,731.
What is the Total Male Population of Mccall?
Total Male Population of Mccall is 2,180.
What is the Total Female Population of Mccall?
Total Female Population of Mccall is 1,551.
What is the Ratio of Males per 100 Females in Mccall?
There are 140.55 Males per 100 Females in Mccall.
What is the Ratio of Females per 100 Males in Mccall?
There are 71.15 Females per 100 Males in Mccall.
What is the Median Population Age in Mccall?
Median Population Age in Mccall is 38.7 Years.
What is the Average Family Size in Mccall
Average Family Size in Mccall is 2.9 People.
What is the Average Household Size in Mccall
Average Household Size in Mccall is 2.8 People.
How Large is the Labor Force in Mccall?
There are 2,035 People in the Labor Forcein in Mccall.
What is the Percentage of People in the Labor Force in Mccall?
62.7% of People are in the Labor Force in Mccall.
What is the Unemployment Rate in Mccall?
Unemployment Rate in Mccall is 1.6%.