Zip Codes with the Highest Percentage of Population with a Degree in Arts and Humanities in Iowa
RELATED REPORTS & OPTIONS
Arts and Humanities
Iowa
Compare Zip Codes
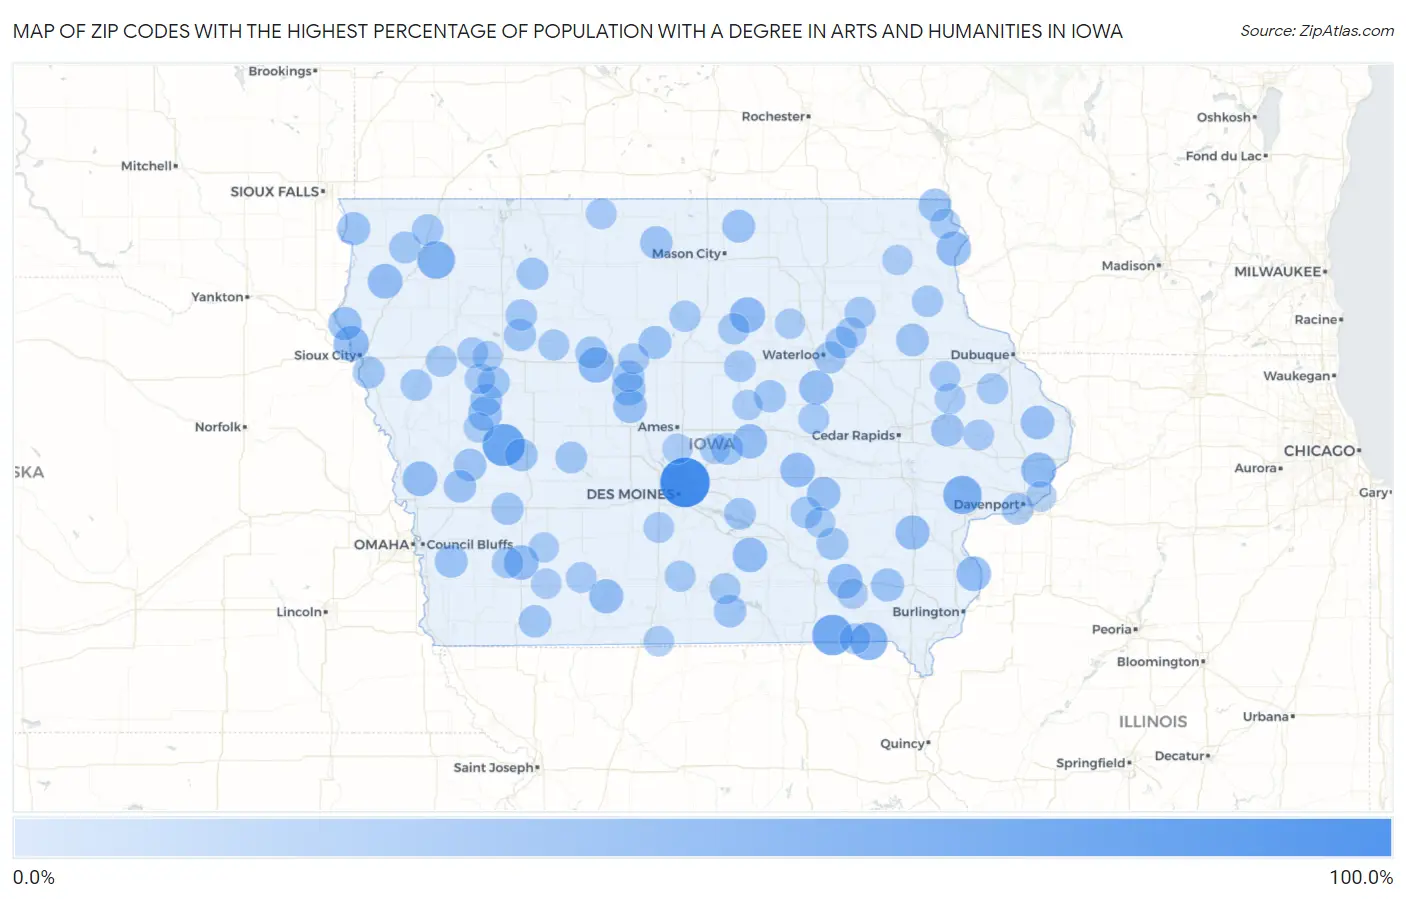
Map of Zip Codes with the Highest Percentage of Population with a Degree in Arts and Humanities in Iowa
0.0%
100.0%
Zip Codes with the Highest Percentage of Population with a Degree in Arts and Humanities in Iowa
| Zip Code | % Graduates | vs State | vs National | |
| 1. | 50032 | 100.0% | 6.8%(+93.2)#1 | 6.0%(+94.0)#12 |
| 2. | 51432 | 66.7% | 6.8%(+59.8)#2 | 6.0%(+60.7)#137 |
| 3. | 52584 | 59.2% | 6.8%(+52.3)#3 | 6.0%(+53.2)#162 |
| 4. | 52760 | 50.0% | 6.8%(+43.2)#4 | 6.0%(+44.0)#204 |
| 5. | 51231 | 46.3% | 6.8%(+39.5)#5 | 6.0%(+40.3)#263 |
| 6. | 52573 | 46.2% | 6.8%(+39.3)#6 | 6.0%(+40.2)#266 |
| 7. | 50566 | 37.0% | 6.8%(+30.1)#7 | 6.0%(+31.0)#420 |
| 8. | 50625 | 36.5% | 6.8%(+29.7)#8 | 6.0%(+30.5)#430 |
| 9. | 51109 | 36.2% | 6.8%(+29.4)#9 | 6.0%(+30.2)#444 |
| 10. | 52758 | 35.0% | 6.8%(+28.2)#10 | 6.0%(+29.0)#474 |
| 11. | 52533 | 33.9% | 6.8%(+27.1)#11 | 6.0%(+27.9)#501 |
| 12. | 51036 | 33.7% | 6.8%(+26.9)#12 | 6.0%(+27.7)#504 |
| 13. | 52646 | 33.3% | 6.8%(+26.5)#13 | 6.0%(+27.3)#522 |
| 14. | 50116 | 33.3% | 6.8%(+26.5)#14 | 6.0%(+27.3)#527 |
| 15. | 51550 | 33.3% | 6.8%(+26.5)#15 | 6.0%(+27.3)#529 |
| 16. | 50847 | 33.3% | 6.8%(+26.5)#16 | 6.0%(+27.3)#536 |
| 17. | 50157 | 33.0% | 6.8%(+26.2)#17 | 6.0%(+27.0)#544 |
| 18. | 52146 | 32.9% | 6.8%(+26.1)#18 | 6.0%(+27.0)#545 |
| 19. | 50120 | 32.3% | 6.8%(+25.5)#19 | 6.0%(+26.3)#565 |
| 20. | 50612 | 31.8% | 6.8%(+25.0)#20 | 6.0%(+25.8)#589 |
| 21. | 50861 | 31.4% | 6.8%(+24.6)#21 | 6.0%(+25.4)#606 |
| 22. | 52201 | 31.1% | 6.8%(+24.2)#22 | 6.0%(+25.1)#620 |
| 23. | 51441 | 30.8% | 6.8%(+23.9)#23 | 6.0%(+24.8)#629 |
| 24. | 52222 | 29.4% | 6.8%(+22.6)#24 | 6.0%(+23.4)#688 |
| 25. | 52069 | 28.9% | 6.8%(+22.1)#25 | 6.0%(+22.9)#711 |
| 26. | 50530 | 28.7% | 6.8%(+21.9)#26 | 6.0%(+22.7)#716 |
| 27. | 50223 | 28.6% | 6.8%(+21.7)#27 | 6.0%(+22.6)#725 |
| 28. | 51062 | 27.9% | 6.8%(+21.0)#28 | 6.0%(+21.9)#770 |
| 29. | 51240 | 27.0% | 6.8%(+20.2)#29 | 6.0%(+21.0)#819 |
| 30. | 52635 | 26.8% | 6.8%(+20.0)#30 | 6.0%(+20.8)#834 |
| 31. | 50599 | 26.7% | 6.8%(+19.8)#31 | 6.0%(+20.7)#842 |
| 32. | 50440 | 26.2% | 6.8%(+19.3)#32 | 6.0%(+20.2)#880 |
| 33. | 51571 | 26.0% | 6.8%(+19.1)#33 | 6.0%(+20.0)#892 |
| 34. | 52160 | 25.0% | 6.8%(+18.2)#34 | 6.0%(+19.0)#950 |
| 35. | 52038 | 25.0% | 6.8%(+18.2)#35 | 6.0%(+19.0)#960 |
| 36. | 50432 | 25.0% | 6.8%(+18.2)#36 | 6.0%(+19.0)#968 |
| 37. | 52312 | 25.0% | 6.8%(+18.2)#37 | 6.0%(+19.0)#980 |
| 38. | 50110 | 25.0% | 6.8%(+18.2)#38 | 6.0%(+19.0)#981 |
| 39. | 51530 | 24.2% | 6.8%(+17.4)#39 | 6.0%(+18.2)#1,016 |
| 40. | 51565 | 24.0% | 6.8%(+17.2)#40 | 6.0%(+18.0)#1,034 |
| 41. | 52583 | 23.9% | 6.8%(+17.1)#41 | 6.0%(+17.9)#1,043 |
| 42. | 51646 | 23.5% | 6.8%(+16.7)#42 | 6.0%(+17.5)#1,065 |
| 43. | 51552 | 23.1% | 6.8%(+16.3)#43 | 6.0%(+17.1)#1,108 |
| 44. | 50568 | 22.8% | 6.8%(+16.0)#44 | 6.0%(+16.8)#1,135 |
| 45. | 50609 | 22.7% | 6.8%(+15.9)#45 | 6.0%(+16.7)#1,147 |
| 46. | 51054 | 22.3% | 6.8%(+15.5)#46 | 6.0%(+16.3)#1,187 |
| 47. | 52562 | 22.2% | 6.8%(+15.4)#47 | 6.0%(+16.2)#1,208 |
| 48. | 51448 | 22.0% | 6.8%(+15.1)#48 | 6.0%(+16.0)#1,241 |
| 49. | 50234 | 21.9% | 6.8%(+15.1)#49 | 6.0%(+15.9)#1,247 |
| 50. | 51458 | 21.9% | 6.8%(+15.0)#50 | 6.0%(+15.9)#1,250 |
| 51. | 50518 | 21.4% | 6.8%(+14.6)#51 | 6.0%(+15.4)#1,300 |
| 52. | 50515 | 21.4% | 6.8%(+14.6)#52 | 6.0%(+15.4)#1,304 |
| 53. | 52802 | 21.4% | 6.8%(+14.6)#53 | 6.0%(+15.4)#1,307 |
| 54. | 50707 | 21.3% | 6.8%(+14.4)#54 | 6.0%(+15.3)#1,323 |
| 55. | 50626 | 21.1% | 6.8%(+14.3)#55 | 6.0%(+15.1)#1,337 |
| 56. | 51234 | 21.1% | 6.8%(+14.2)#56 | 6.0%(+15.1)#1,341 |
| 57. | 50214 | 20.8% | 6.8%(+14.0)#57 | 6.0%(+14.8)#1,371 |
| 58. | 50029 | 20.7% | 6.8%(+13.9)#58 | 6.0%(+14.7)#1,388 |
| 59. | 50557 | 20.4% | 6.8%(+13.6)#59 | 6.0%(+14.4)#1,425 |
| 60. | 50672 | 20.4% | 6.8%(+13.6)#60 | 6.0%(+14.4)#1,429 |
| 61. | 51232 | 20.0% | 6.8%(+13.2)#61 | 6.0%(+14.0)#1,480 |
| 62. | 50027 | 20.0% | 6.8%(+13.2)#62 | 6.0%(+14.0)#1,492 |
| 63. | 51044 | 20.0% | 6.8%(+13.2)#63 | 6.0%(+14.0)#1,496 |
| 64. | 51532 | 19.5% | 6.8%(+12.7)#64 | 6.0%(+13.5)#1,568 |
| 65. | 50510 | 19.3% | 6.8%(+12.5)#65 | 6.0%(+13.3)#1,607 |
| 66. | 52043 | 19.1% | 6.8%(+12.3)#66 | 6.0%(+13.1)#1,634 |
| 67. | 50633 | 18.8% | 6.8%(+11.9)#67 | 6.0%(+12.8)#1,690 |
| 68. | 50470 | 18.8% | 6.8%(+11.9)#68 | 6.0%(+12.8)#1,692 |
| 69. | 52032 | 18.6% | 6.8%(+11.8)#69 | 6.0%(+12.6)#1,701 |
| 70. | 50681 | 18.2% | 6.8%(+11.4)#70 | 6.0%(+12.2)#1,803 |
| 71. | 50575 | 18.1% | 6.8%(+11.2)#71 | 6.0%(+12.1)#1,830 |
| 72. | 51018 | 17.9% | 6.8%(+11.1)#72 | 6.0%(+12.0)#1,855 |
| 73. | 50238 | 17.8% | 6.8%(+11.0)#73 | 6.0%(+11.8)#1,892 |
| 74. | 50275 | 17.3% | 6.8%(+10.5)#74 | 6.0%(+11.3)#2,009 |
| 75. | 52217 | 17.2% | 6.8%(+10.4)#75 | 6.0%(+11.2)#2,021 |
| 76. | 52323 | 16.7% | 6.8%(+9.84)#76 | 6.0%(+10.7)#2,155 |
| 77. | 50590 | 16.7% | 6.8%(+9.84)#77 | 6.0%(+10.7)#2,157 |
| 78. | 52542 | 16.7% | 6.8%(+9.84)#78 | 6.0%(+10.7)#2,164 |
| 79. | 50842 | 16.7% | 6.8%(+9.84)#79 | 6.0%(+10.7)#2,179 |
| 80. | 50229 | 16.5% | 6.8%(+9.66)#80 | 6.0%(+10.5)#2,221 |
| 81. | 50532 | 16.5% | 6.8%(+9.65)#81 | 6.0%(+10.5)#2,224 |
| 82. | 52310 | 16.3% | 6.8%(+9.48)#82 | 6.0%(+10.3)#2,265 |
| 83. | 51020 | 16.2% | 6.8%(+9.39)#83 | 6.0%(+10.2)#2,284 |
| 84. | 51431 | 15.9% | 6.8%(+9.05)#84 | 6.0%(+9.88)#2,380 |
| 85. | 50629 | 15.8% | 6.8%(+8.99)#85 | 6.0%(+9.82)#2,391 |
| 86. | 52237 | 15.6% | 6.8%(+8.80)#86 | 6.0%(+9.63)#2,446 |
| 87. | 50065 | 15.5% | 6.8%(+8.69)#87 | 6.0%(+9.52)#2,488 |
| 88. | 52767 | 15.4% | 6.8%(+8.62)#88 | 6.0%(+9.45)#2,518 |
| 89. | 52133 | 15.4% | 6.8%(+8.56)#89 | 6.0%(+9.39)#2,533 |
| 90. | 52151 | 15.2% | 6.8%(+8.42)#90 | 6.0%(+9.25)#2,579 |
| 91. | 50055 | 15.2% | 6.8%(+8.40)#91 | 6.0%(+9.23)#2,584 |
| 92. | 50841 | 15.2% | 6.8%(+8.38)#92 | 6.0%(+9.21)#2,597 |
| 93. | 51053 | 15.1% | 6.8%(+8.25)#93 | 6.0%(+9.07)#2,645 |
| 94. | 52567 | 15.0% | 6.8%(+8.13)#94 | 6.0%(+8.96)#2,697 |
| 95. | 50853 | 14.9% | 6.8%(+8.12)#95 | 6.0%(+8.95)#2,702 |
| 96. | 50124 | 14.9% | 6.8%(+8.07)#96 | 6.0%(+8.90)#2,715 |
| 97. | 50268 | 14.8% | 6.8%(+7.99)#97 | 6.0%(+8.82)#2,750 |
| 98. | 50148 | 14.8% | 6.8%(+7.99)#98 | 6.0%(+8.82)#2,753 |
| 99. | 50670 | 14.6% | 6.8%(+7.80)#99 | 6.0%(+8.63)#2,826 |
| 100. | 51442 | 14.6% | 6.8%(+7.79)#100 | 6.0%(+8.61)#2,835 |
Common Questions
What are the Top 10 Zip Codes with the Highest Percentage of Population with a Degree in Arts and Humanities in Iowa?
Top 10 Zip Codes with the Highest Percentage of Population with a Degree in Arts and Humanities in Iowa are:
What zip code has the Highest Percentage of Population with a Degree in Arts and Humanities in Iowa?
50032 has the Highest Percentage of Population with a Degree in Arts and Humanities in Iowa with 100.0%.
What is the Percentage of Population with a Degree in Arts and Humanities in the State of Iowa?
Percentage of Population with a Degree in Arts and Humanities in Iowa is 6.8%.
What is the Percentage of Population with a Degree in Arts and Humanities in the United States?
Percentage of Population with a Degree in Arts and Humanities in the United States is 6.0%.