Zip Codes with the Highest Poverty Level Among Children Under the Age of 5 in Delaware

RELATED REPORTS & OPTIONS

Highest Poverty | Child 0-5
Population
Families and Households
Female Fertility
Female Fertility (Unmarried)
Race (Community Size)
Race (Percentage)
Ancestry (Community Size)
AfghanAfricanAlaska NativeAlaskan AthabascanAlbanianAleutAlsatianAmericanApacheArabArapahoArgentineanArmenianAssyrian / Chaldean / SyriacAustralianAustrianBahamianBangladeshiBarbadianBasqueBelgianBelizeanBermudanBhutaneseBlackfeetBolivianBrazilianBritishBritish West IndianBulgarianBurmeseCajunCambodianCanadianCape VerdeanCarpatho RusynCelticCentral AmericanCentral American IndianCherokeeCheyenneChickasawChileanChineseChippewaChoctawColombianColvilleComancheCosta RicanCreeCreekCroatianCrowCubanCypriotCzechCzechoslovakianDanishDelawareDominicanDutchDutch West IndianEastern EuropeanEcuadorianEgyptianEnglishEstonianEthiopianEuropeanFijianFilipinoFinnishFrenchFrench American IndianFrench CanadianGermanGerman RussianGhanaianGreekGuamanian / ChamorroGuatemalanGuyaneseHaitianHmongHonduranHopiHoumaHungarianIcelanderIndian (Asian)IndonesianInupiatIranianIraqiIrishIroquoisIsraeliItalianJamaicanJapaneseJordanianKenyanKiowaKoreanLaotianLatvianLebaneseLiberianLithuanianLumbeeLuxembourgerMacedonianMalaysianMalteseMarshalleseMenomineeMexicanMexican American IndianMongolianMoroccanNative HawaiianNavajoNepaleseNew ZealanderNicaraguanNigerianNorthern EuropeanNorwegianOkinawanOsageOttawaPaiutePakistaniPalestinianPanamanianParaguayanPennsylvania GermanPeruvianPimaPolishPortuguesePotawatomiPuebloPuerto RicanPuget Sound SalishRomanianRussianSalvadoranSamoanScandinavianScotch-IrishScottishSeminoleSenegaleseSerbianShoshoneSierra LeoneanSiouxSlavicSlovakSloveneSomaliSouth AfricanSouth AmericanSouth American IndianSoviet UnionSpaniardSpanishSpanish AmericanSpanish American IndianSri LankanSubsaharan AfricanSudaneseSwedishSwissSyrianTaiwaneseThaiTlingit-HaidaTohono O'OdhamTonganTrinidadian and TobagonianTsimshianTurkishU.S. Virgin IslanderUgandanUkrainianUruguayanUteVenezuelanVietnameseWelshWest IndianYakamaYaquiYugoslavianYumanYup'ikZimbabwean
Ancestry (Percentage)
AfghanAfricanAlaska NativeAlaskan AthabascanAlbanianAleutAlsatianAmericanApacheArabArapahoArgentineanArmenianAssyrian / Chaldean / SyriacAustralianAustrianBahamianBangladeshiBarbadianBasqueBelgianBelizeanBermudanBhutaneseBlackfeetBolivianBrazilianBritishBritish West IndianBulgarianBurmeseCajunCambodianCanadianCape VerdeanCarpatho RusynCelticCentral AmericanCentral American IndianCherokeeCheyenneChickasawChileanChineseChippewaChoctawColombianColvilleComancheCosta RicanCreeCreekCroatianCrowCubanCypriotCzechCzechoslovakianDanishDelawareDominicanDutchDutch West IndianEastern EuropeanEcuadorianEgyptianEnglishEstonianEthiopianEuropeanFijianFilipinoFinnishFrenchFrench American IndianFrench CanadianGermanGerman RussianGhanaianGreekGuamanian / ChamorroGuatemalanGuyaneseHaitianHmongHonduranHopiHoumaHungarianIcelanderIndian (Asian)IndonesianInupiatIranianIraqiIrishIroquoisIsraeliItalianJamaicanJapaneseJordanianKenyanKiowaKoreanLaotianLatvianLebaneseLiberianLithuanianLumbeeLuxembourgerMacedonianMalaysianMalteseMarshalleseMenomineeMexicanMexican American IndianMongolianMoroccanNative HawaiianNavajoNepaleseNew ZealanderNicaraguanNigerianNorthern EuropeanNorwegianOkinawanOsageOttawaPaiutePakistaniPalestinianPanamanianParaguayanPennsylvania GermanPeruvianPimaPolishPortuguesePotawatomiPuebloPuerto RicanPuget Sound SalishRomanianRussianSalvadoranSamoanScandinavianScotch-IrishScottishSeminoleSenegaleseSerbianShoshoneSierra LeoneanSiouxSlavicSlovakSloveneSomaliSouth AfricanSouth AmericanSouth American IndianSoviet UnionSpaniardSpanishSpanish AmericanSpanish American IndianSri LankanSubsaharan AfricanSudaneseSwedishSwissSyrianTaiwaneseThaiTlingit-HaidaTohono O'OdhamTonganTrinidadian and TobagonianTsimshianTurkishU.S. Virgin IslanderUgandanUkrainianUruguayanUteVenezuelanVietnameseWelshWest IndianYakamaYaquiYugoslavianYumanYup'ikZimbabwean
Immigrant Origin (Total)
AfghanistanAfricaAlbaniaArgentinaArmeniaAsiaAustraliaAustriaAzoresBahamasBangladeshBarbadosBelarusBelgiumBelizeBoliviaBosnia and HerzegovinaBrazilBulgariaBurma / MyanmarCabo VerdeCambodiaCameroonCanadaCaribbeanCentral AmericaChileChinaColombiaCongoCosta RicaCroatiaCubaCzechoslovakiaDenmarkDominicaDominican RepublicEastern AfricaEastern AsiaEastern EuropeEcuadorEgyptEl SalvadorEnglandEritreaEthiopiaEuropeFijiFranceGermanyGhanaGreeceGrenadaGuatemalaGuyanaHaitiHondurasHong KongHungaryIndiaIndonesiaIranIraqIrelandIsraelItalyJamaicaJapanJordanKazakhstanKenyaKoreaKuwaitLaosLatin AmericaLatviaLebanonLiberiaLithuaniaMalaysiaMexicoMicronesiaMiddle AfricaMoldovaMoroccoNepalNetherlandsNicaraguaNigeriaNorth MacedoniaNorthern AfricaNorthern EuropeNorwayOceaniaPakistanPanamaPeruPhilippinesPolandPortugalRomaniaRussiaSaudi ArabiaScotlandSenegalSerbiaSierra LeoneSingaporeSomaliaSouth AfricaSouth AmericaSouth Central AsiaSouth Eastern AsiaSouthern EuropeSpainSri LankaSt. Vincent and the GrenadinesSudanSwedenSwitzerlandSyriaTaiwanThailandTrinidad and TobagoTurkeyUgandaUkraineUruguayUzbekistanVenezuelaVietnamWest IndiesWestern AfricaWestern AsiaWestern EuropeYemenZaireZimbabwe
Immigrant Origin (Percentage)
AfghanistanAfricaAlbaniaArgentinaArmeniaAsiaAustraliaAustriaAzoresBahamasBangladeshBarbadosBelarusBelgiumBelizeBoliviaBosnia and HerzegovinaBrazilBulgariaBurma / MyanmarCabo VerdeCambodiaCameroonCanadaCaribbeanCentral AmericaChileChinaColombiaCongoCosta RicaCroatiaCubaCzechoslovakiaDenmarkDominicaDominican RepublicEastern AfricaEastern AsiaEastern EuropeEcuadorEgyptEl SalvadorEnglandEritreaEthiopiaEuropeFijiFranceGermanyGhanaGreeceGrenadaGuatemalaGuyanaHaitiHondurasHong KongHungaryIndiaIndonesiaIranIraqIrelandIsraelItalyJamaicaJapanJordanKazakhstanKenyaKoreaKuwaitLaosLatin AmericaLatviaLebanonLiberiaLithuaniaMalaysiaMexicoMicronesiaMiddle AfricaMoldovaMoroccoNepalNetherlandsNicaraguaNigeriaNorth MacedoniaNorthern AfricaNorthern EuropeNorwayOceaniaPakistanPanamaPeruPhilippinesPolandPortugalRomaniaRussiaSaudi ArabiaScotlandSenegalSerbiaSierra LeoneSingaporeSomaliaSouth AfricaSouth AmericaSouth Central AsiaSouth Eastern AsiaSouthern EuropeSpainSri LankaSt. Vincent and the GrenadinesSudanSwedenSwitzerlandSyriaTaiwanThailandTrinidad and TobagoTurkeyUgandaUkraineUruguayUzbekistanVenezuelaVietnamWest IndiesWestern AfricaWestern AsiaWestern EuropeYemenZaireZimbabwe
Income
Income (Families)
Income (Households)
Poverty
Poverty (Families)
Unemployment
Employment Occupations
Employment Industries
Employer Class
Commute Time
Commute Means
School Enrollment
Education by Degree Field
Occupancy
Finances
Physical Characteristics
Delaware
Compare Zip Codes
Comparison Subject

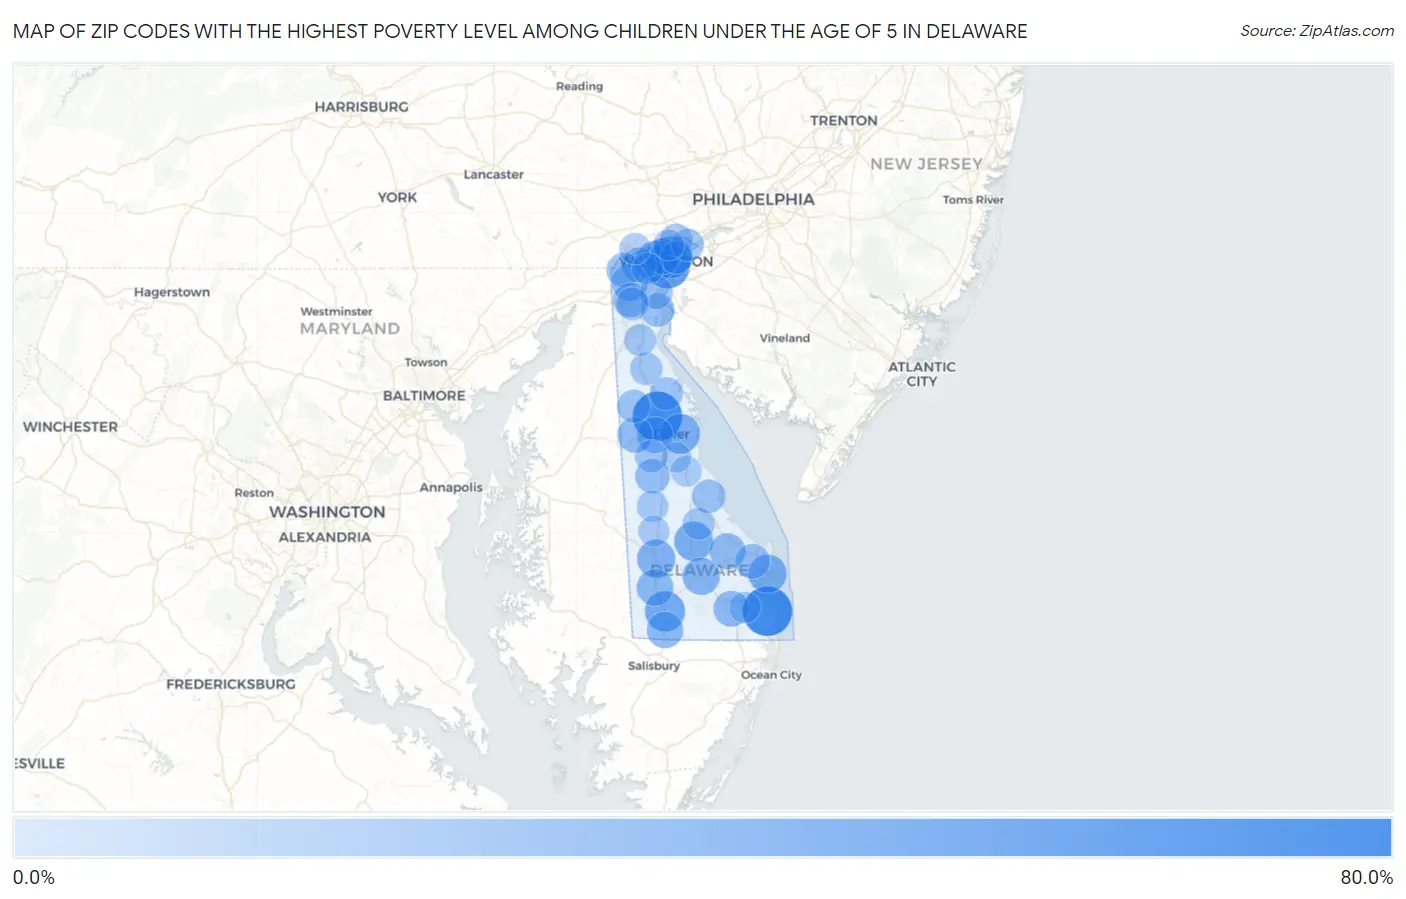
Map of Zip Codes with the Highest Poverty Level Among Children Under the Age of 5 in Delaware

0.0%
80.0%
Zip Codes with the Highest Poverty Level Among Children Under the Age of 5 in Delaware Map

Zip Codes with the Highest Poverty Level Among Children Under the Age of 5 in Delaware

Zip Code Child Poverty vs State vs National
1.1997077.7%19.1%(+58.7)#118.1%(+59.7)#883
2.1993676.9%19.1%(+57.9)#218.1%(+58.9)#901
3.1980156.7%19.1%(+37.7)#318.1%(+38.7)#1,929
4.1980245.9%19.1%(+26.8)#418.1%(+27.8)#3,062
5.1980542.2%19.1%(+23.1)#518.1%(+24.1)#3,621
6.1995640.0%19.1%(+21.0)#618.1%(+22.0)#4,001
7.1990138.2%19.1%(+19.1)#718.1%(+20.1)#4,375
8.1994135.5%19.1%(+16.4)#818.1%(+17.4)#4,958
9.1997132.2%19.1%(+13.1)#918.1%(+14.1)#5,793
10.1993331.5%19.1%(+12.5)#1018.1%(+13.5)#5,950
11.1994727.9%19.1%(+8.83)#1118.1%(+9.83)#6,992
12.1997325.6%19.1%(+6.57)#1218.1%(+7.58)#7,760
13.1971324.2%19.1%(+5.18)#1318.1%(+6.18)#8,269
14.1994024.1%19.1%(+5.06)#1418.1%(+6.07)#8,310
15.1980623.1%19.1%(+4.07)#1518.1%(+5.07)#8,716
16.1996822.8%19.1%(+3.74)#1618.1%(+4.74)#8,833
17.1990422.7%19.1%(+3.61)#1718.1%(+4.61)#8,889
18.1996621.5%19.1%(+2.44)#1818.1%(+3.44)#9,387
19.1995319.9%19.1%(+0.840)#1918.1%(+1.84)#10,103
20.1980817.2%19.1%(-1.86)#2018.1%(-0.862)#11,335
21.1995817.2%19.1%(-1.90)#2118.1%(-0.896)#11,348
22.1994316.7%19.1%(-2.40)#2218.1%(-1.40)#11,533
23.1971116.3%19.1%(-2.77)#2318.1%(-1.77)#11,757
24.1970215.1%19.1%(-3.93)#2418.1%(-2.93)#12,386
25.1970613.3%19.1%(-5.73)#2518.1%(-4.73)#13,421
26.1996312.6%19.1%(-6.43)#2618.1%(-5.43)#13,834
27.1997711.0%19.1%(-8.06)#2718.1%(-7.06)#14,835
28.1993810.8%19.1%(-8.24)#2818.1%(-7.24)#14,940
29.1972010.5%19.1%(-8.55)#2918.1%(-7.55)#15,113
30.197019.2%19.1%(-9.85)#3018.1%(-8.85)#15,916
31.198109.0%19.1%(-10.0)#3118.1%(-9.01)#16,031
32.198099.0%19.1%(-10.1)#3218.1%(-9.09)#16,070
33.197039.0%19.1%(-10.1)#3318.1%(-9.09)#16,077
34.199348.9%19.1%(-10.1)#3418.1%(-9.11)#16,092
35.197348.3%19.1%(-10.8)#3518.1%(-9.80)#16,592
36.199607.0%19.1%(-12.1)#3618.1%(-11.1)#17,389
37.197096.1%19.1%(-12.9)#3718.1%(-11.9)#17,974
38.198045.1%19.1%(-14.0)#3818.1%(-13.0)#18,708
39.199524.7%19.1%(-14.4)#3918.1%(-13.4)#18,980
40.197074.5%19.1%(-14.6)#4018.1%(-13.6)#19,120
41.199393.7%19.1%(-15.4)#4118.1%(-14.4)#19,745
42.199502.7%19.1%(-16.4)#4218.1%(-15.4)#20,407
43.198032.3%19.1%(-16.8)#4318.1%(-15.8)#20,636
44.199461.5%19.1%(-17.6)#4418.1%(-16.6)#21,144
45.199620.41%19.1%(-18.7)#4518.1%(-17.7)#21,640

Common Questions

What are the Top 10 Zip Codes with the Highest Poverty Level Among Children Under the Age of 5 in Delaware?
Top 10 Zip Codes with the Highest Poverty Level Among Children Under the Age of 5 in Delaware are:
#1
77.7%
#2
76.9%
#3
56.7%
#4
45.9%
#5
42.2%
#6
40.0%
#7
38.2%
#8
35.5%
#9
32.2%
#10
31.5%
What zip code has the Highest Poverty Level Among Children Under the Age of 5 in Delaware?
19970 has the Highest Poverty Level Among Children Under the Age of 5 in Delaware with 77.7%.
What is the Poverty Level Among Children Under the Age of 5 in the State of Delaware?
Poverty Level Among Children Under the Age of 5 in Delaware is 19.1%.
What is the Poverty Level Among Children Under the Age of 5 in the United States?
Poverty Level Among Children Under the Age of 5 in the United States is 18.1%.