Immigrants from Syria 4 or more Vehicles in Household
COMPARE
Immigrants from Syria
Select to Compare
4 or more Vehicles in Household
Immigrants from Syria 4 or more Vehicles in Household
6.3%
4+ VEHICLES AVAILABLE
52.8/ 100
METRIC RATING
170th/ 347
METRIC RANK
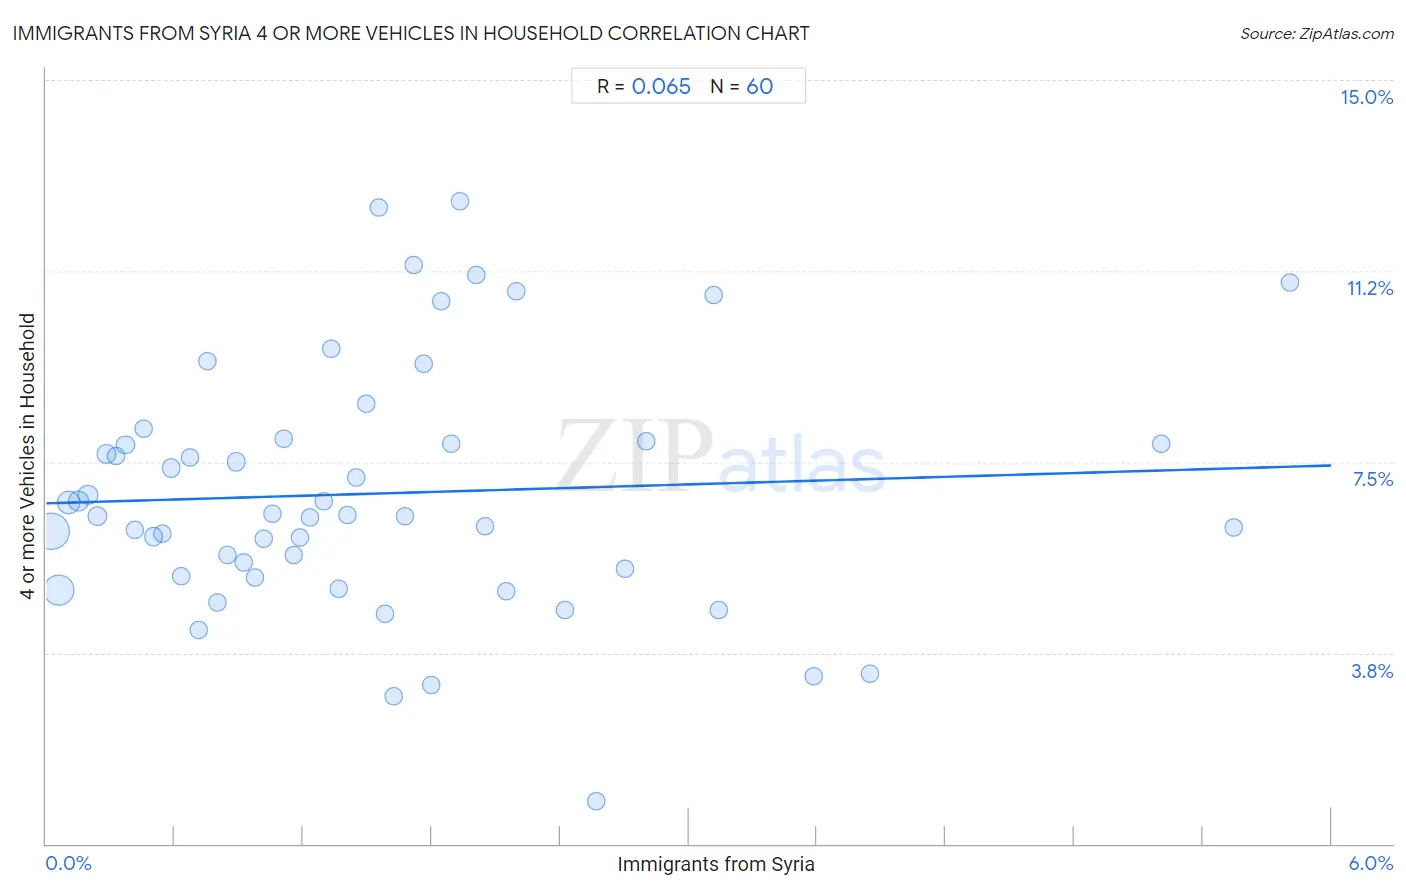
Immigrants from Syria 4 or more Vehicles in Household Correlation Chart
The statistical analysis conducted on geographies consisting of 173,706,064 people shows a slight positive correlation between the proportion of Immigrants from Syria and percentage of households with 4 or more vehicles available in the United States with a correlation coefficient (R) of 0.065 and weighted average of 6.3%. On average, for every 1% (one percent) increase in Immigrants from Syria within a typical geography, there is an increase of 0.12% in percentage of households with 4 or more vehicles available.
It is essential to understand that the correlation between the percentage of Immigrants from Syria and percentage of households with 4 or more vehicles available does not imply a direct cause-and-effect relationship. It remains uncertain whether the presence of Immigrants from Syria influences an upward or downward trend in the level of percentage of households with 4 or more vehicles available within an area, or if Immigrants from Syria simply ended up residing in those areas with higher or lower levels of percentage of households with 4 or more vehicles available due to other factors.
Demographics Similar to Immigrants from Syria by 4 or more Vehicles in Household
In terms of 4 or more vehicles in household, the demographic groups most similar to Immigrants from Syria are Immigrants from India (6.3%, a difference of 0.080%), Immigrants from Lebanon (6.3%, a difference of 0.11%), Slovene (6.3%, a difference of 0.16%), Estonian (6.4%, a difference of 0.24%), and Lithuanian (6.3%, a difference of 0.28%).
| Demographics | Rating | Rank | 4 or more Vehicles in Household |
| Chileans | 61.2 /100 | #163 | Good 6.4% |
| Hungarians | 61.1 /100 | #164 | Good 6.4% |
| Immigrants from Peru | 59.8 /100 | #165 | Average 6.4% |
| Immigrants from Denmark | 57.8 /100 | #166 | Average 6.4% |
| Poles | 56.9 /100 | #167 | Average 6.4% |
| Lebanese | 55.8 /100 | #168 | Average 6.4% |
| Estonians | 55.1 /100 | #169 | Average 6.4% |
| Immigrants from Syria | 52.8 /100 | #170 | Average 6.3% |
| Immigrants from India | 51.9 /100 | #171 | Average 6.3% |
| Immigrants from Lebanon | 51.7 /100 | #172 | Average 6.3% |
| Slovenes | 51.1 /100 | #173 | Average 6.3% |
| Lithuanians | 50.0 /100 | #174 | Average 6.3% |
| Immigrants from Western Europe | 48.8 /100 | #175 | Average 6.3% |
| Ukrainians | 47.6 /100 | #176 | Average 6.3% |
| Slovaks | 46.9 /100 | #177 | Average 6.3% |
Immigrants from Syria 4 or more Vehicles in Household Correlation Summary
| Measurement | Immigrants from Syria Data | 4 or more Vehicles in Household Data |
| Minimum | 0.021% | 0.83% |
| Maximum | 5.8% | 12.6% |
| Range | 5.8% | 11.8% |
| Mean | 1.6% | 6.9% |
| Median | 1.3% | 6.4% |
| Interquartile 25% (IQ1) | 0.65% | 5.3% |
| Interquartile 75% (IQ3) | 2.0% | 7.9% |
| Interquartile Range (IQR) | 1.3% | 2.6% |
| Standard Deviation (Sample) | 1.3% | 2.4% |
| Standard Deviation (Population) | 1.3% | 2.4% |
Correlation Details
| Immigrants from Syria Percentile | Sample Size | 4 or more Vehicles in Household |
[ 0.0% - 0.5% ] 0.021% | 70,357,393 | 6.1% |
[ 0.0% - 0.5% ] 0.060% | 45,770,389 | 5.0% |
[ 0.0% - 0.5% ] 0.11% | 19,299,952 | 6.7% |
[ 0.0% - 0.5% ] 0.15% | 10,477,066 | 6.7% |
[ 0.0% - 0.5% ] 0.20% | 5,870,432 | 6.9% |
[ 0.0% - 0.5% ] 0.24% | 5,353,321 | 6.4% |
[ 0.0% - 0.5% ] 0.28% | 3,244,069 | 7.7% |
[ 0.0% - 0.5% ] 0.33% | 2,044,231 | 7.6% |
[ 0.0% - 0.5% ] 0.37% | 1,463,273 | 7.8% |
[ 0.0% - 0.5% ] 0.41% | 1,108,294 | 6.2% |
[ 0.0% - 0.5% ] 0.46% | 858,730 | 8.2% |
[ 0.0% - 0.5% ] 0.50% | 1,541,790 | 6.0% |
[ 0.5% - 1.0% ] 0.54% | 555,551 | 6.1% |
[ 0.5% - 1.0% ] 0.58% | 775,662 | 7.4% |
[ 0.5% - 1.0% ] 0.63% | 581,789 | 5.3% |
[ 0.5% - 1.0% ] 0.67% | 159,709 | 7.6% |
[ 0.5% - 1.0% ] 0.71% | 345,202 | 4.2% |
[ 0.5% - 1.0% ] 0.75% | 389,433 | 9.5% |
[ 0.5% - 1.0% ] 0.80% | 488,355 | 4.7% |
[ 0.5% - 1.0% ] 0.85% | 229,137 | 5.7% |
[ 0.5% - 1.0% ] 0.89% | 238,027 | 7.5% |
[ 0.5% - 1.0% ] 0.92% | 265,761 | 5.5% |
[ 0.5% - 1.0% ] 0.98% | 182,116 | 5.2% |
[ 1.0% - 1.5% ] 1.02% | 347,495 | 6.0% |
[ 1.0% - 1.5% ] 1.06% | 183,678 | 6.5% |
[ 1.0% - 1.5% ] 1.11% | 134,021 | 8.0% |
[ 1.0% - 1.5% ] 1.16% | 41,357 | 5.7% |
[ 1.0% - 1.5% ] 1.18% | 124,920 | 6.0% |
[ 1.0% - 1.5% ] 1.23% | 267,825 | 6.4% |
[ 1.0% - 1.5% ] 1.30% | 18,512 | 6.7% |
[ 1.0% - 1.5% ] 1.33% | 42,486 | 9.7% |
[ 1.0% - 1.5% ] 1.37% | 94,053 | 5.0% |
[ 1.0% - 1.5% ] 1.41% | 54,260 | 6.4% |
[ 1.0% - 1.5% ] 1.45% | 58,332 | 7.2% |
[ 1.0% - 1.5% ] 1.49% | 47,791 | 8.6% |
[ 1.5% - 2.0% ] 1.55% | 258 | 12.5% |
[ 1.5% - 2.0% ] 1.58% | 68,001 | 4.5% |
[ 1.5% - 2.0% ] 1.62% | 149,839 | 2.9% |
[ 1.5% - 2.0% ] 1.67% | 4,362 | 6.4% |
[ 1.5% - 2.0% ] 1.72% | 22,017 | 11.4% |
[ 1.5% - 2.0% ] 1.76% | 32,376 | 9.4% |
[ 1.5% - 2.0% ] 1.80% | 17,212 | 3.1% |
[ 1.5% - 2.0% ] 1.84% | 3,363 | 10.7% |
[ 1.5% - 2.0% ] 1.89% | 30,372 | 7.9% |
[ 1.5% - 2.0% ] 1.93% | 31,984 | 12.6% |
[ 2.0% - 2.5% ] 2.01% | 1,097 | 11.2% |
[ 2.0% - 2.5% ] 2.05% | 9,761 | 6.2% |
[ 2.0% - 2.5% ] 2.15% | 83,343 | 5.0% |
[ 2.0% - 2.5% ] 2.19% | 27,468 | 10.8% |
[ 2.0% - 2.5% ] 2.42% | 248 | 4.6% |
[ 2.5% - 3.0% ] 2.57% | 80,113 | 0.83% |
[ 2.5% - 3.0% ] 2.70% | 35,960 | 5.4% |
[ 2.5% - 3.0% ] 2.80% | 8,180 | 7.9% |
[ 3.0% - 3.5% ] 3.12% | 8,764 | 10.8% |
[ 3.0% - 3.5% ] 3.14% | 191 | 4.6% |
[ 3.5% - 4.0% ] 3.58% | 24,985 | 3.3% |
[ 3.5% - 4.0% ] 3.85% | 156 | 3.3% |
[ 5.0% - 5.5% ] 5.21% | 29,286 | 7.9% |
[ 5.5% - 6.0% ] 5.54% | 16,358 | 6.2% |
[ 5.5% - 6.0% ] 5.81% | 5,958 | 11.0% |