Immigrants from Syria vs Soviet Union Disability Age Under 5

COMPARE

Immigrants from Syria
Race
Ancestry
AfghanAfricanAlaska NativeAlaskan AthabascanAlbanianAleutAlsatianAmericanApacheArabArapahoArgentineanArmenianAssyrian/Chaldean/SyriacAustralianAustrianBahamianBangladeshiBarbadianBasqueBelgianBelizeanBermudanBhutaneseBlackfeetBolivianBrazilianBritishBritish West IndianBulgarianBurmeseCajunCambodianCanadianCape VerdeanCarpatho RusynCelticCentral AmericanCentral American IndianCherokeeCheyenneChickasawChileanChineseChippewaChoctawColombianColvilleComancheCosta RicanCreeCreekCroatianCrowCubanCypriotCzechCzechoslovakianDanishDelawareDominicanDutchDutch West IndianEastern EuropeanEcuadorianEgyptianEnglishEstonianEthiopianEuropeanFijianFilipinoFinnishFrenchFrench American IndianFrench CanadianGermanGerman RussianGhanaianGreekGuamanian/ChamorroGuatemalanGuyaneseHaitianHmongHonduranHopiHoumaHungarianIcelanderIndian (Asian)IndonesianInupiatIranianIraqiIrishIroquoisIsraeliItalianJamaicanJapaneseJordanianKenyanKiowaKoreanLaotianLatvianLebaneseLiberianLithuanianLumbeeLuxembourgerMacedonianMalaysianMalteseMarshalleseMenomineeMexicanMexican American IndianMongolianMoroccanNative HawaiianNavajoNepaleseNew ZealanderNicaraguanNigerianNorthern EuropeanNorwegianOkinawanOsageOttawaPaiutePakistaniPalestinianPanamanianParaguayanPennsylvania GermanPeruvianPimaPolishPortuguesePotawatomiPuebloPuerto RicanPuget Sound SalishRomanianRussianSalvadoranSamoanScandinavianScotch-IrishScottishSeminoleSenegaleseSerbianShoshoneSierra LeoneanSiouxSlavicSlovakSloveneSomaliSouth AfricanSouth AmericanSouth American IndianSpaniardSpanishSpanish AmericanSpanish American IndianSri LankanSubsaharan AfricanSudaneseSwedishSwissSyrianTaiwaneseThaiTlingit-HaidaTohono O'OdhamTonganTrinidadian and TobagonianTsimshianTurkishU.S. Virgin IslanderUgandanUkrainianUruguayanUteVenezuelanVietnameseWelshWest IndianYakamaYaquiYugoslavianYumanYup'ikZimbabwean
Immigration
NonimmigrantsImmigrantsAfghanistanAfricaAlbaniaArgentinaArmeniaAsiaAustraliaAustriaBahamasBangladeshBarbadosBelarusBelgiumBelizeBoliviaBosnia and HerzegovinaBrazilBulgariaBurma/MyanmarCabo VerdeCambodiaCameroonCanadaCaribbeanCentral AmericaChileChinaColombiaCongoCosta RicaCroatiaCubaCzechoslovakiaDenmarkDominicaDominican RepublicEastern AfricaEastern AsiaEastern EuropeEcuadorEgyptEl SalvadorEnglandEritreaEthiopiaEuropeFijiFranceGermanyGhanaGreeceGrenadaGuatemalaGuyanaHaitiHondurasHong KongHungaryIndiaIndonesiaIranIraqIrelandIsraelItalyJamaicaJapanJordanKazakhstanKenyaKoreaKuwaitLaosLatin AmericaLatviaLebanonLiberiaLithuaniaMalaysiaMexicoMicronesiaMiddle AfricaMoldovaMoroccoNepalNetherlandsNicaraguaNigeriaNorth AmericaNorth MacedoniaNorthern AfricaNorthern EuropeNorwayOceaniaPakistanPanamaPeruPhilippinesPolandPortugalRomaniaRussiaSaudi ArabiaScotlandSenegalSerbiaSierra LeoneSingaporeSomaliaSouth AfricaSouth AmericaSouth Central AsiaSouth Eastern AsiaSouthern EuropeSpainSri LankaSt. Vincent and the GrenadinesSudanSwedenSwitzerlandSyriaTaiwanThailandTrinidad and TobagoTurkeyUgandaUkraineUruguayUzbekistanVenezuelaVietnamWest IndiesWestern AfricaWestern AsiaWestern EuropeYemenZaireZimbabweAzores
Soviet Union
Race
Ancestry
AfghanAfricanAlaska NativeAlaskan AthabascanAlbanianAleutAlsatianAmericanApacheArabArapahoArgentineanArmenianAssyrian/Chaldean/SyriacAustralianAustrianBahamianBangladeshiBarbadianBasqueBelgianBelizeanBermudanBhutaneseBlackfeetBolivianBrazilianBritishBritish West IndianBulgarianBurmeseCajunCambodianCanadianCape VerdeanCarpatho RusynCelticCentral AmericanCentral American IndianCherokeeCheyenneChickasawChileanChineseChippewaChoctawColombianColvilleComancheCosta RicanCreeCreekCroatianCrowCubanCypriotCzechCzechoslovakianDanishDelawareDominicanDutchDutch West IndianEastern EuropeanEcuadorianEgyptianEnglishEstonianEthiopianEuropeanFijianFilipinoFinnishFrenchFrench American IndianFrench CanadianGermanGerman RussianGhanaianGreekGuamanian/ChamorroGuatemalanGuyaneseHaitianHmongHonduranHopiHoumaHungarianIcelanderIndian (Asian)IndonesianInupiatIranianIraqiIrishIroquoisIsraeliItalianJamaicanJapaneseJordanianKenyanKiowaKoreanLaotianLatvianLebaneseLiberianLithuanianLumbeeLuxembourgerMacedonianMalaysianMalteseMarshalleseMenomineeMexicanMexican American IndianMongolianMoroccanNative HawaiianNavajoNepaleseNew ZealanderNicaraguanNigerianNorthern EuropeanNorwegianOkinawanOsageOttawaPaiutePakistaniPalestinianPanamanianParaguayanPennsylvania GermanPeruvianPimaPolishPortuguesePotawatomiPuebloPuerto RicanPuget Sound SalishRomanianRussianSalvadoranSamoanScandinavianScotch-IrishScottishSeminoleSenegaleseSerbianShoshoneSierra LeoneanSiouxSlavicSlovakSloveneSomaliSouth AfricanSouth AmericanSouth American IndianSoviet UnionSpaniardSpanishSpanish AmericanSpanish American IndianSri LankanSubsaharan AfricanSudaneseSwedishSwissSyrianTaiwaneseThaiTlingit-HaidaTohono O'OdhamTonganTrinidadian and TobagonianTsimshianTurkishU.S. Virgin IslanderUgandanUkrainianUruguayanUteVenezuelanVietnameseWelshWest IndianYakamaYaquiYugoslavianYumanYup'ikZimbabwean
Immigration
NonimmigrantsImmigrantsAfghanistanAfricaAlbaniaArgentinaArmeniaAsiaAustraliaAustriaBahamasBangladeshBarbadosBelarusBelgiumBelizeBoliviaBosnia and HerzegovinaBrazilBulgariaBurma/MyanmarCabo VerdeCambodiaCameroonCanadaCaribbeanCentral AmericaChileChinaColombiaCongoCosta RicaCroatiaCubaCzechoslovakiaDenmarkDominicaDominican RepublicEastern AfricaEastern AsiaEastern EuropeEcuadorEgyptEl SalvadorEnglandEritreaEthiopiaEuropeFijiFranceGermanyGhanaGreeceGrenadaGuatemalaGuyanaHaitiHondurasHong KongHungaryIndiaIndonesiaIranIraqIrelandIsraelItalyJamaicaJapanJordanKazakhstanKenyaKoreaKuwaitLaosLatin AmericaLatviaLebanonLiberiaLithuaniaMalaysiaMexicoMicronesiaMiddle AfricaMoldovaMoroccoNepalNetherlandsNicaraguaNigeriaNorth AmericaNorth MacedoniaNorthern AfricaNorthern EuropeNorwayOceaniaPakistanPanamaPeruPhilippinesPolandPortugalRomaniaRussiaSaudi ArabiaScotlandSenegalSerbiaSierra LeoneSingaporeSomaliaSouth AfricaSouth AmericaSouth Central AsiaSouth Eastern AsiaSouthern EuropeSpainSri LankaSt. Vincent and the GrenadinesSudanSwedenSwitzerlandTaiwanThailandTrinidad and TobagoTurkeyUgandaUkraineUruguayUzbekistanVenezuelaVietnamWest IndiesWestern AfricaWestern AsiaWestern EuropeYemenZaireZimbabweAzores
Disability Age Under 5
Income
Poverty
Unemployment
Labor Participation
Family Structure
Vehicle Availability
Education Level
Disability

Disability Age Under 5 Comparison

Immigrants from Syria

Soviet Union

Exceptional
Exceptional
1.1%
DISABILITY AGE UNDER 5
97.9/ 100
METRIC RATING
83rd/ 347
METRIC RANK
0.95%
DISABILITY AGE UNDER 5
100.0/ 100
METRIC RATING
13th/ 347
METRIC RANK

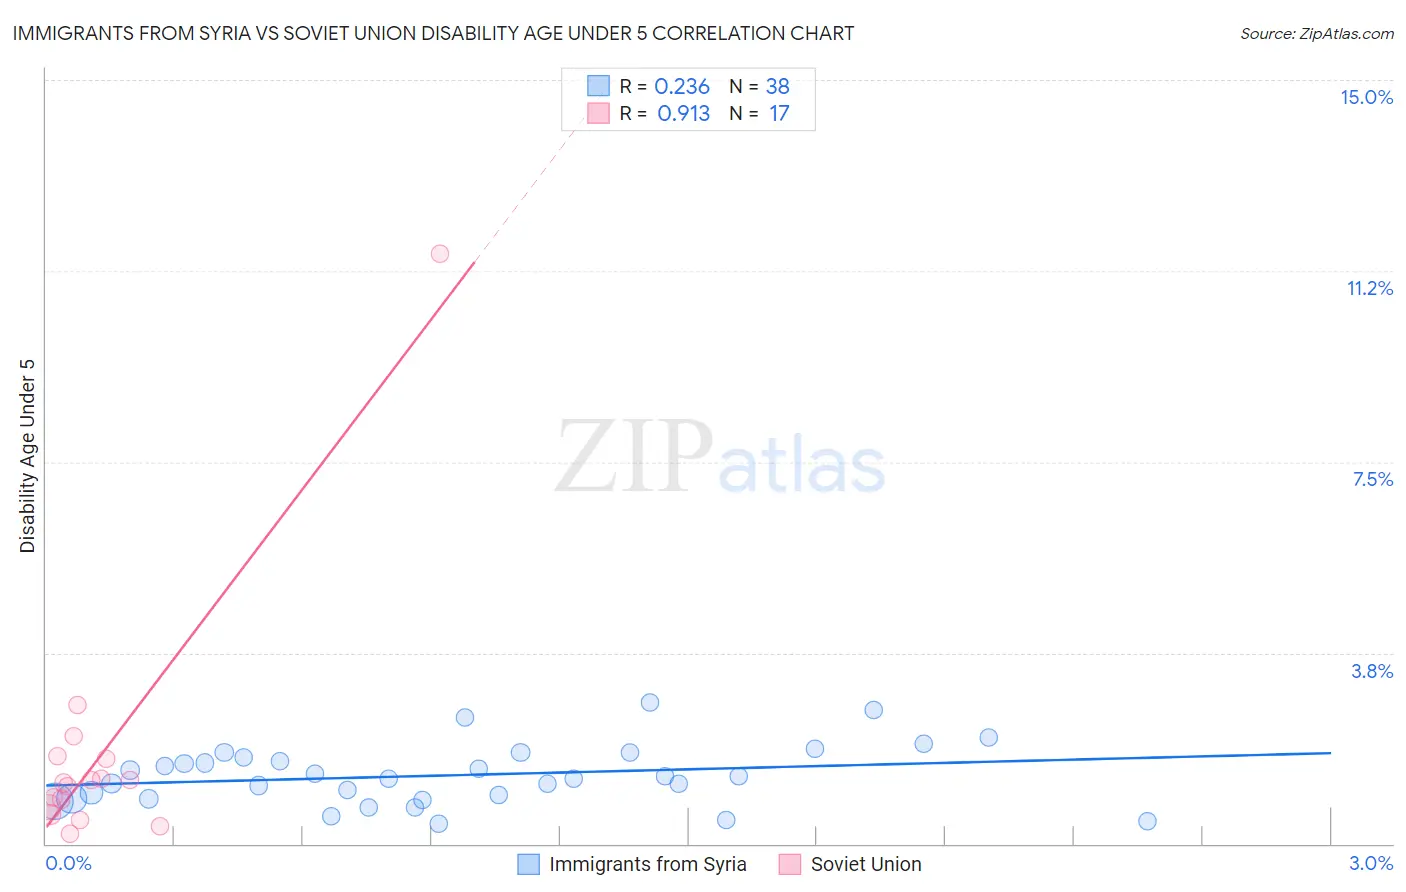
Immigrants from Syria vs Soviet Union Disability Age Under 5 Correlation Chart

The statistical analysis conducted on geographies consisting of 121,605,651 people shows a weak positive correlation between the proportion of Immigrants from Syria and percentage of population with a disability under the age of 5 in the United States with a correlation coefficient (R) of 0.236 and weighted average of 1.1%. Similarly, the statistical analysis conducted on geographies consisting of 37,806,626 people shows a near-perfect positive correlation between the proportion of Soviet Union and percentage of population with a disability under the age of 5 in the United States with a correlation coefficient (R) of 0.913 and weighted average of 0.95%, a difference of 19.8%.
Immigrants from Syria vs Soviet Union Disability Age Under 5

Disability Age Under 5 Correlation Summary

MeasurementImmigrants from SyriaSoviet Union
Minimum0.39%0.19%
Maximum2.8%11.6%
Range2.4%11.4%
Mean1.3%1.8%
Median1.3%1.2%
Interquartile 25% (IQ1)0.88%0.64%
Interquartile 75% (IQ3)1.7%1.7%
Interquartile Range (IQR)0.81%1.0%
Standard Deviation (Sample)0.58%2.6%
Standard Deviation (Population)0.57%2.5%

Similar Demographics by Disability Age Under 5

Demographics Similar to Immigrants from Syria by Disability Age Under 5

In terms of disability age under 5, the demographic groups most similar to Immigrants from Syria are Immigrants from Jordan (1.1%, a difference of 0.010%), Turkish (1.1%, a difference of 0.12%), Immigrants from Trinidad and Tobago (1.1%, a difference of 0.14%), Immigrants from Zaire (1.1%, a difference of 0.15%), and Hmong (1.1%, a difference of 0.16%).
DemographicsRating | RankDisability Age Under 5
Immigrants | Burma/Myanmar
98.2
/100
|
#76
Exceptional
1.1%
Immigrants | Denmark
98.1
/100
|
#77
Exceptional
1.1%
West Indians
98.0
/100
|
#78
Exceptional
1.1%
Hmong
98.0
/100
|
#79
Exceptional
1.1%
Immigrants | Trinidad and Tobago
98.0
/100
|
#80
Exceptional
1.1%
Turks
98.0
/100
|
#81
Exceptional
1.1%
Immigrants | Jordan
97.9
/100
|
#82
Exceptional
1.1%
Immigrants | Syria
97.9
/100
|
#83
Exceptional
1.1%
Immigrants | Zaire
97.8
/100
|
#84
Exceptional
1.1%
Sudanese
97.7
/100
|
#85
Exceptional
1.1%
Okinawans
97.6
/100
|
#86
Exceptional
1.1%
Ugandans
97.5
/100
|
#87
Exceptional
1.1%
Immigrants | Dominican Republic
97.5
/100
|
#88
Exceptional
1.1%
Ethiopians
97.2
/100
|
#89
Exceptional
1.1%
Chinese
97.2
/100
|
#90
Exceptional
1.1%

Demographics Similar to Soviet Union by Disability Age Under 5

In terms of disability age under 5, the demographic groups most similar to Soviet Union are Yuman (0.95%, a difference of 0.080%), Immigrants from Hong Kong (0.95%, a difference of 0.11%), Immigrants from Grenada (0.94%, a difference of 0.17%), Afghan (0.94%, a difference of 0.19%), and Marshallese (0.94%, a difference of 0.95%).
DemographicsRating | RankDisability Age Under 5
Ute
100.0
/100
|
#6
Exceptional
0.86%
Immigrants | Afghanistan
100.0
/100
|
#7
Exceptional
0.91%
Immigrants | Yemen
100.0
/100
|
#8
Exceptional
0.91%
Immigrants | Fiji
100.0
/100
|
#9
Exceptional
0.92%
Marshallese
100.0
/100
|
#10
Exceptional
0.94%
Afghans
100.0
/100
|
#11
Exceptional
0.94%
Immigrants | Grenada
100.0
/100
|
#12
Exceptional
0.94%
Soviet Union
100.0
/100
|
#13
Exceptional
0.95%
Yuman
100.0
/100
|
#14
Exceptional
0.95%
Immigrants | Hong Kong
100.0
/100
|
#15
Exceptional
0.95%
Immigrants | Israel
100.0
/100
|
#16
Exceptional
0.96%
Immigrants | China
100.0
/100
|
#17
Exceptional
0.96%
Immigrants | Barbados
100.0
/100
|
#18
Exceptional
0.97%
Puget Sound Salish
100.0
/100
|
#19
Exceptional
0.97%
Nepalese
100.0
/100
|
#20
Exceptional
0.97%