Immigrants from Syria 3 or more Vehicles in Household
COMPARE
Immigrants from Syria
Select to Compare
3 or more Vehicles in Household
Immigrants from Syria 3 or more Vehicles in Household
19.4%
3+ VEHICLES AVAILABLE
40.3/ 100
METRIC RATING
178th/ 347
METRIC RANK
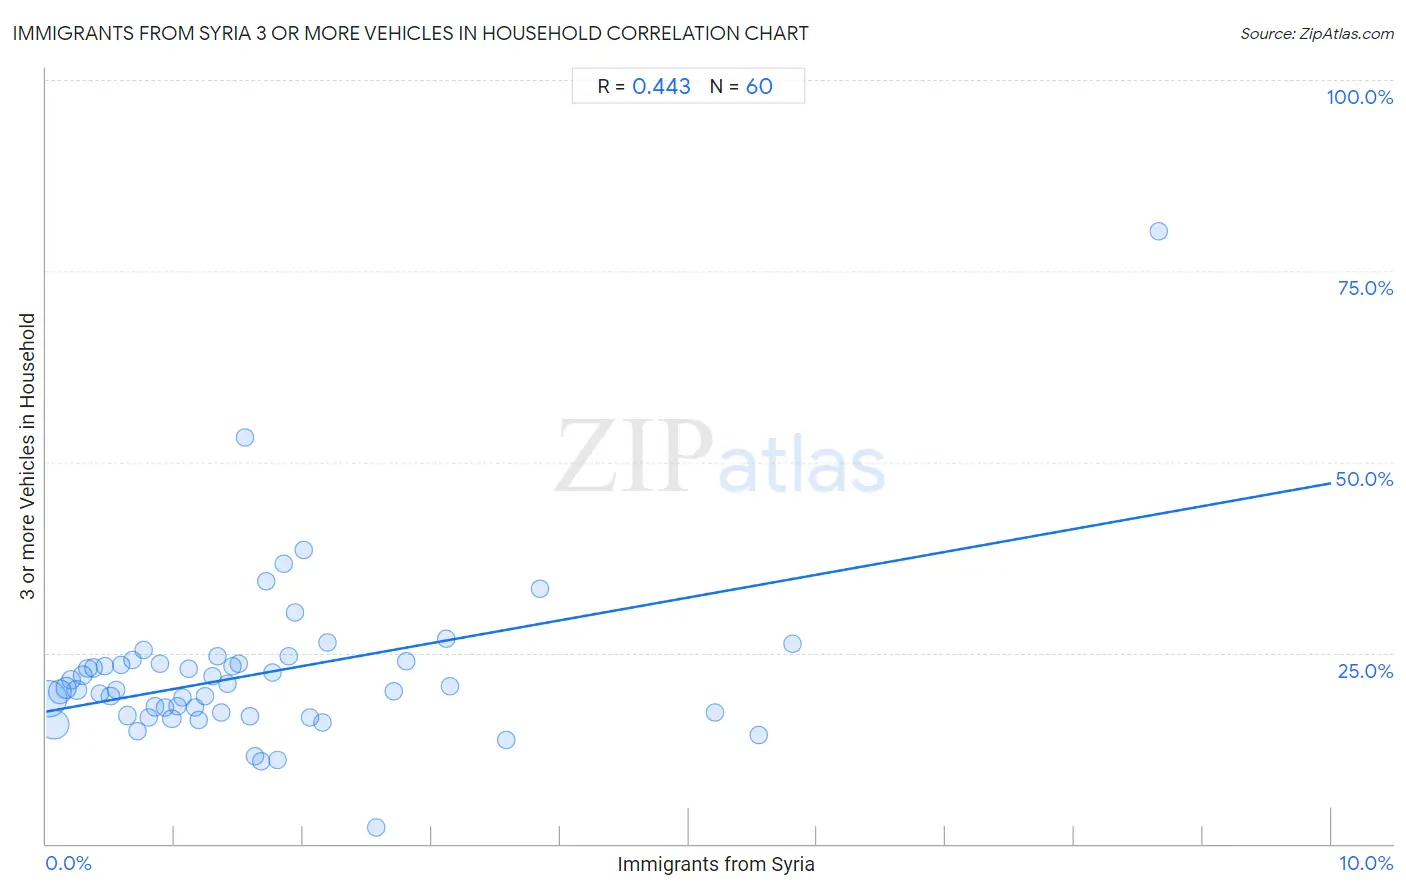
Immigrants from Syria 3 or more Vehicles in Household Correlation Chart
The statistical analysis conducted on geographies consisting of 174,111,368 people shows a moderate positive correlation between the proportion of Immigrants from Syria and percentage of households with 3 or more vehicles available in the United States with a correlation coefficient (R) of 0.443 and weighted average of 19.4%. On average, for every 1% (one percent) increase in Immigrants from Syria within a typical geography, there is an increase of 3.0% in percentage of households with 3 or more vehicles available.
It is essential to understand that the correlation between the percentage of Immigrants from Syria and percentage of households with 3 or more vehicles available does not imply a direct cause-and-effect relationship. It remains uncertain whether the presence of Immigrants from Syria influences an upward or downward trend in the level of percentage of households with 3 or more vehicles available within an area, or if Immigrants from Syria simply ended up residing in those areas with higher or lower levels of percentage of households with 3 or more vehicles available due to other factors.
Demographics Similar to Immigrants from Syria by 3 or more Vehicles in Household
In terms of 3 or more vehicles in household, the demographic groups most similar to Immigrants from Syria are Immigrants from Peru (19.4%, a difference of 0.070%), Immigrants from South Central Asia (19.3%, a difference of 0.11%), South African (19.3%, a difference of 0.22%), Romanian (19.3%, a difference of 0.25%), and Cuban (19.3%, a difference of 0.30%).
| Demographics | Rating | Rank | 3 or more Vehicles in Household |
| Immigrants from Western Europe | 53.2 /100 | #171 | Average 19.5% |
| Kiowa | 50.9 /100 | #172 | Average 19.5% |
| Immigrants from Northern Europe | 50.2 /100 | #173 | Average 19.5% |
| Immigrants from South Africa | 50.0 /100 | #174 | Average 19.5% |
| Syrians | 47.0 /100 | #175 | Average 19.5% |
| Iroquois | 46.0 /100 | #176 | Average 19.4% |
| Immigrants from Peru | 41.1 /100 | #177 | Average 19.4% |
| Immigrants from Syria | 40.3 /100 | #178 | Average 19.4% |
| Immigrants from South Central Asia | 38.9 /100 | #179 | Fair 19.3% |
| South Africans | 37.5 /100 | #180 | Fair 19.3% |
| Romanians | 37.1 /100 | #181 | Fair 19.3% |
| Cubans | 36.6 /100 | #182 | Fair 19.3% |
| Cajuns | 36.0 /100 | #183 | Fair 19.3% |
| Latvians | 35.7 /100 | #184 | Fair 19.3% |
| Immigrants from Sri Lanka | 30.7 /100 | #185 | Fair 19.2% |
Immigrants from Syria 3 or more Vehicles in Household Correlation Summary
| Measurement | Immigrants from Syria Data | 3 or more Vehicles in Household Data |
| Minimum | 0.021% | 2.1% |
| Maximum | 8.7% | 80.2% |
| Range | 8.6% | 78.1% |
| Mean | 1.7% | 22.3% |
| Median | 1.3% | 20.3% |
| Interquartile 25% (IQ1) | 0.65% | 17.0% |
| Interquartile 75% (IQ3) | 2.0% | 23.7% |
| Interquartile Range (IQR) | 1.3% | 6.7% |
| Standard Deviation (Sample) | 1.6% | 10.6% |
| Standard Deviation (Population) | 1.6% | 10.5% |
Correlation Details
| Immigrants from Syria Percentile | Sample Size | 3 or more Vehicles in Household |
[ 0.0% - 0.5% ] 0.021% | 70,566,214 | 18.9% |
[ 0.0% - 0.5% ] 0.060% | 45,844,544 | 15.6% |
[ 0.0% - 0.5% ] 0.11% | 19,349,685 | 19.9% |
[ 0.0% - 0.5% ] 0.15% | 10,497,619 | 20.4% |
[ 0.0% - 0.5% ] 0.20% | 5,870,432 | 21.5% |
[ 0.0% - 0.5% ] 0.24% | 5,355,711 | 20.2% |
[ 0.0% - 0.5% ] 0.28% | 3,266,609 | 22.0% |
[ 0.0% - 0.5% ] 0.33% | 2,051,960 | 22.9% |
[ 0.0% - 0.5% ] 0.37% | 1,463,273 | 23.0% |
[ 0.0% - 0.5% ] 0.41% | 1,108,294 | 19.7% |
[ 0.0% - 0.5% ] 0.46% | 858,730 | 23.3% |
[ 0.0% - 0.5% ] 0.50% | 1,546,038 | 19.3% |
[ 0.5% - 1.0% ] 0.54% | 555,551 | 20.2% |
[ 0.5% - 1.0% ] 0.58% | 775,662 | 23.4% |
[ 0.5% - 1.0% ] 0.63% | 586,381 | 16.8% |
[ 0.5% - 1.0% ] 0.67% | 161,763 | 24.1% |
[ 0.5% - 1.0% ] 0.71% | 345,202 | 14.7% |
[ 0.5% - 1.0% ] 0.75% | 389,433 | 25.3% |
[ 0.5% - 1.0% ] 0.80% | 488,355 | 16.6% |
[ 0.5% - 1.0% ] 0.85% | 229,137 | 17.9% |
[ 0.5% - 1.0% ] 0.89% | 238,027 | 23.5% |
[ 0.5% - 1.0% ] 0.92% | 265,761 | 17.9% |
[ 0.5% - 1.0% ] 0.98% | 182,116 | 16.3% |
[ 1.0% - 1.5% ] 1.02% | 347,495 | 18.0% |
[ 1.0% - 1.5% ] 1.06% | 183,678 | 19.1% |
[ 1.0% - 1.5% ] 1.11% | 134,021 | 23.0% |
[ 1.0% - 1.5% ] 1.16% | 49,586 | 17.8% |
[ 1.0% - 1.5% ] 1.18% | 124,920 | 16.2% |
[ 1.0% - 1.5% ] 1.23% | 267,825 | 19.4% |
[ 1.0% - 1.5% ] 1.30% | 18,512 | 21.9% |
[ 1.0% - 1.5% ] 1.33% | 42,486 | 24.5% |
[ 1.0% - 1.5% ] 1.37% | 94,053 | 17.2% |
[ 1.0% - 1.5% ] 1.41% | 54,260 | 21.0% |
[ 1.0% - 1.5% ] 1.45% | 58,332 | 23.2% |
[ 1.0% - 1.5% ] 1.49% | 47,791 | 23.5% |
[ 1.5% - 2.0% ] 1.55% | 258 | 53.1% |
[ 1.5% - 2.0% ] 1.58% | 68,001 | 16.7% |
[ 1.5% - 2.0% ] 1.62% | 149,839 | 11.4% |
[ 1.5% - 2.0% ] 1.67% | 4,362 | 10.7% |
[ 1.5% - 2.0% ] 1.72% | 22,017 | 34.4% |
[ 1.5% - 2.0% ] 1.76% | 32,376 | 22.4% |
[ 1.5% - 2.0% ] 1.80% | 17,212 | 11.0% |
[ 1.5% - 2.0% ] 1.84% | 3,363 | 36.7% |
[ 1.5% - 2.0% ] 1.89% | 30,372 | 24.6% |
[ 1.5% - 2.0% ] 1.93% | 31,984 | 30.3% |
[ 2.0% - 2.5% ] 2.01% | 1,097 | 38.5% |
[ 2.0% - 2.5% ] 2.05% | 9,761 | 16.5% |
[ 2.0% - 2.5% ] 2.15% | 83,343 | 15.9% |
[ 2.0% - 2.5% ] 2.19% | 27,468 | 26.4% |
[ 2.5% - 3.0% ] 2.57% | 80,113 | 2.1% |
[ 2.5% - 3.0% ] 2.70% | 35,960 | 20.0% |
[ 2.5% - 3.0% ] 2.80% | 8,180 | 23.8% |
[ 3.0% - 3.5% ] 3.12% | 8,764 | 26.9% |
[ 3.0% - 3.5% ] 3.14% | 191 | 20.7% |
[ 3.5% - 4.0% ] 3.58% | 24,985 | 13.5% |
[ 3.5% - 4.0% ] 3.85% | 156 | 33.3% |
[ 5.0% - 5.5% ] 5.21% | 29,286 | 17.2% |
[ 5.5% - 6.0% ] 5.54% | 16,358 | 14.3% |
[ 5.5% - 6.0% ] 5.81% | 5,958 | 26.3% |
[ 8.5% - 9.0% ] 8.66% | 508 | 80.2% |