Immigrants from Syria Wage/Income Gap

COMPARE

Immigrants from Syria
Race
Ancestry
AfghanAfricanAlaska NativeAlaskan AthabascanAlbanianAleutAlsatianAmericanApacheArabArapahoArgentineanArmenianAssyrian/Chaldean/SyriacAustralianAustrianBahamianBangladeshiBarbadianBasqueBelgianBelizeanBermudanBhutaneseBlackfeetBolivianBrazilianBritishBritish West IndianBulgarianBurmeseCajunCambodianCanadianCape VerdeanCarpatho RusynCelticCentral AmericanCentral American IndianCherokeeCheyenneChickasawChileanChineseChippewaChoctawColombianColvilleComancheCosta RicanCreeCreekCroatianCrowCubanCypriotCzechCzechoslovakianDanishDelawareDominicanDutchDutch West IndianEastern EuropeanEcuadorianEgyptianEnglishEstonianEthiopianEuropeanFijianFilipinoFinnishFrenchFrench American IndianFrench CanadianGermanGerman RussianGhanaianGreekGuamanian/ChamorroGuatemalanGuyaneseHaitianHmongHonduranHopiHoumaHungarianIcelanderIndian (Asian)IndonesianInupiatIranianIraqiIrishIroquoisIsraeliItalianJamaicanJapaneseJordanianKenyanKiowaKoreanLaotianLatvianLebaneseLiberianLithuanianLumbeeLuxembourgerMacedonianMalaysianMalteseMarshalleseMenomineeMexicanMexican American IndianMongolianMoroccanNative HawaiianNavajoNepaleseNew ZealanderNicaraguanNigerianNorthern EuropeanNorwegianOkinawanOsageOttawaPaiutePakistaniPalestinianPanamanianParaguayanPennsylvania GermanPeruvianPimaPolishPortuguesePotawatomiPuebloPuerto RicanPuget Sound SalishRomanianRussianSalvadoranSamoanScandinavianScotch-IrishScottishSeminoleSenegaleseSerbianShoshoneSierra LeoneanSiouxSlavicSlovakSloveneSomaliSouth AfricanSouth AmericanSouth American IndianSoviet UnionSpaniardSpanishSpanish AmericanSpanish American IndianSri LankanSubsaharan AfricanSudaneseSwedishSwissSyrianTaiwaneseThaiTlingit-HaidaTohono O'OdhamTonganTrinidadian and TobagonianTsimshianTurkishU.S. Virgin IslanderUgandanUkrainianUruguayanUteVenezuelanVietnameseWelshWest IndianYakamaYaquiYugoslavianYumanYup'ikZimbabwean
Immigration
NonimmigrantsImmigrantsAfghanistanAfricaAlbaniaArgentinaArmeniaAsiaAustraliaAustriaBahamasBangladeshBarbadosBelarusBelgiumBelizeBoliviaBosnia and HerzegovinaBrazilBulgariaBurma/MyanmarCabo VerdeCambodiaCameroonCanadaCaribbeanCentral AmericaChileChinaColombiaCongoCosta RicaCroatiaCubaCzechoslovakiaDenmarkDominicaDominican RepublicEastern AfricaEastern AsiaEastern EuropeEcuadorEgyptEl SalvadorEnglandEritreaEthiopiaEuropeFijiFranceGermanyGhanaGreeceGrenadaGuatemalaGuyanaHaitiHondurasHong KongHungaryIndiaIndonesiaIranIraqIrelandIsraelItalyJamaicaJapanJordanKazakhstanKenyaKoreaKuwaitLaosLatin AmericaLatviaLebanonLiberiaLithuaniaMalaysiaMexicoMicronesiaMiddle AfricaMoldovaMoroccoNepalNetherlandsNicaraguaNigeriaNorth AmericaNorth MacedoniaNorthern AfricaNorthern EuropeNorwayOceaniaPakistanPanamaPeruPhilippinesPolandPortugalRomaniaRussiaSaudi ArabiaScotlandSenegalSerbiaSierra LeoneSingaporeSomaliaSouth AfricaSouth AmericaSouth Central AsiaSouth Eastern AsiaSouthern EuropeSpainSri LankaSt. Vincent and the GrenadinesSudanSwedenSwitzerlandSyriaTaiwanThailandTrinidad and TobagoTurkeyUgandaUkraineUruguayUzbekistanVenezuelaVietnamWest IndiesWestern AfricaWestern AsiaWestern EuropeYemenZaireZimbabweAzores
Select to Compare
Race
Ancestry
AfghanAfricanAlaska NativeAlaskan AthabascanAlbanianAleutAlsatianAmericanApacheArabArapahoArgentineanArmenianAssyrian/Chaldean/SyriacAustralianAustrianBahamianBangladeshiBarbadianBasqueBelgianBelizeanBermudanBhutaneseBlackfeetBolivianBrazilianBritishBritish West IndianBulgarianBurmeseCajunCambodianCanadianCape VerdeanCarpatho RusynCelticCentral AmericanCentral American IndianCherokeeCheyenneChickasawChileanChineseChippewaChoctawColombianColvilleComancheCosta RicanCreeCreekCroatianCrowCubanCypriotCzechCzechoslovakianDanishDelawareDominicanDutchDutch West IndianEastern EuropeanEcuadorianEgyptianEnglishEstonianEthiopianEuropeanFijianFilipinoFinnishFrenchFrench American IndianFrench CanadianGermanGerman RussianGhanaianGreekGuamanian/ChamorroGuatemalanGuyaneseHaitianHmongHonduranHopiHoumaHungarianIcelanderIndian (Asian)IndonesianInupiatIranianIraqiIrishIroquoisIsraeliItalianJamaicanJapaneseJordanianKenyanKiowaKoreanLaotianLatvianLebaneseLiberianLithuanianLumbeeLuxembourgerMacedonianMalaysianMalteseMarshalleseMenomineeMexicanMexican American IndianMongolianMoroccanNative HawaiianNavajoNepaleseNew ZealanderNicaraguanNigerianNorthern EuropeanNorwegianOkinawanOsageOttawaPaiutePakistaniPalestinianPanamanianParaguayanPennsylvania GermanPeruvianPimaPolishPortuguesePotawatomiPuebloPuerto RicanPuget Sound SalishRomanianRussianSalvadoranSamoanScandinavianScotch-IrishScottishSeminoleSenegaleseSerbianShoshoneSierra LeoneanSiouxSlavicSlovakSloveneSomaliSouth AfricanSouth AmericanSouth American IndianSoviet UnionSpaniardSpanishSpanish AmericanSpanish American IndianSri LankanSubsaharan AfricanSudaneseSwedishSwissSyrianTaiwaneseThaiTlingit-HaidaTohono O'OdhamTonganTrinidadian and TobagonianTsimshianTurkishU.S. Virgin IslanderUgandanUkrainianUruguayanUteVenezuelanVietnameseWelshWest IndianYakamaYaquiYugoslavianYumanYup'ikZimbabwean
Immigration
NonimmigrantsImmigrantsAfghanistanAfricaAlbaniaArgentinaArmeniaAsiaAustraliaAustriaBahamasBangladeshBarbadosBelarusBelgiumBelizeBoliviaBosnia and HerzegovinaBrazilBulgariaBurma/MyanmarCabo VerdeCambodiaCameroonCanadaCaribbeanCentral AmericaChileChinaColombiaCongoCosta RicaCroatiaCubaCzechoslovakiaDenmarkDominicaDominican RepublicEastern AfricaEastern AsiaEastern EuropeEcuadorEgyptEl SalvadorEnglandEritreaEthiopiaEuropeFijiFranceGermanyGhanaGreeceGrenadaGuatemalaGuyanaHaitiHondurasHong KongHungaryIndiaIndonesiaIranIraqIrelandIsraelItalyJamaicaJapanJordanKazakhstanKenyaKoreaKuwaitLaosLatin AmericaLatviaLebanonLiberiaLithuaniaMalaysiaMexicoMicronesiaMiddle AfricaMoldovaMoroccoNepalNetherlandsNicaraguaNigeriaNorth AmericaNorth MacedoniaNorthern AfricaNorthern EuropeNorwayOceaniaPakistanPanamaPeruPhilippinesPolandPortugalRomaniaRussiaSaudi ArabiaScotlandSenegalSerbiaSierra LeoneSingaporeSomaliaSouth AfricaSouth AmericaSouth Central AsiaSouth Eastern AsiaSouthern EuropeSpainSri LankaSt. Vincent and the GrenadinesSudanSwedenSwitzerlandTaiwanThailandTrinidad and TobagoTurkeyUgandaUkraineUruguayUzbekistanVenezuelaVietnamWest IndiesWestern AfricaWestern AsiaWestern EuropeYemenZaireZimbabweAzores
Wage/Income Gap
Income
Poverty
Unemployment
Labor Participation
Family Structure
Vehicle Availability
Education Level
Disability

Immigrants from Syria Wage/Income Gap
Poor

26.4%
WAGE/INCOME GAP
19.3/ 100
METRIC RATING
201st/ 347
METRIC RANK

Immigrants from Syria Wage/Income Gap Correlation Chart

The statistical analysis conducted on geographies consisting of 174,099,463 people shows a poor positive correlation between the proportion of Immigrants from Syria and wage/income gap percentage in the United States with a correlation coefficient (R) of 0.151 and weighted average of 26.4%. On average, for every 1% (one percent) increase in Immigrants from Syria within a typical geography, there is an increase of 0.87% in wage/income gap percentage.
Immigrants from Syria Wage/Income Gap
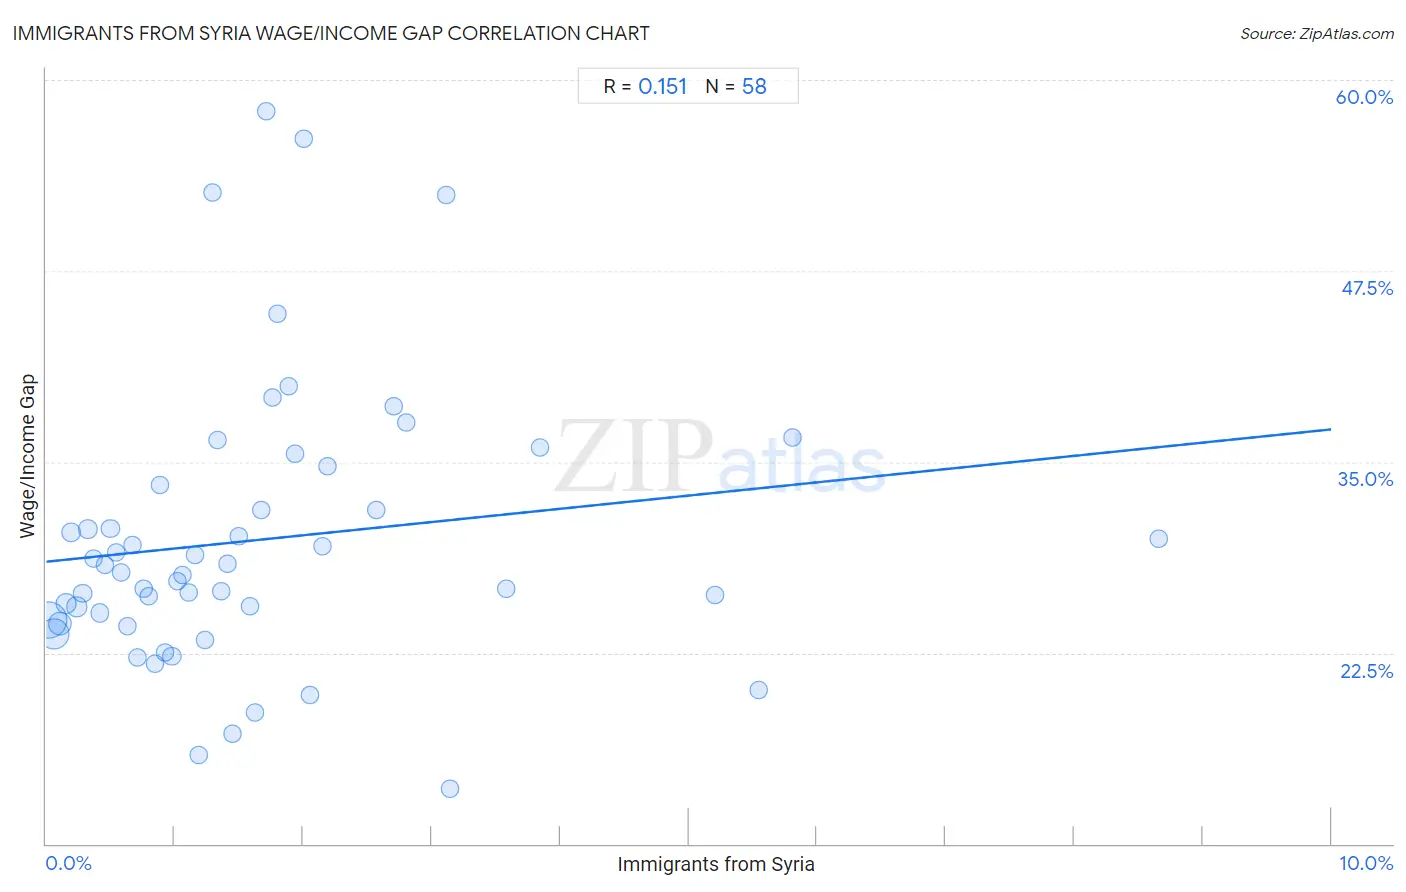
It is essential to understand that the correlation between the percentage of Immigrants from Syria and wage/income gap percentage does not imply a direct cause-and-effect relationship. It remains uncertain whether the presence of Immigrants from Syria influences an upward or downward trend in the level of wage/income gap percentage within an area, or if Immigrants from Syria simply ended up residing in those areas with higher or lower levels of wage/income gap percentage due to other factors.

Demographics Similar to Immigrants from Syria by Wage/Income Gap

In terms of wage/income gap, the demographic groups most similar to Immigrants from Syria are Laotian (26.4%, a difference of 0.010%), Immigrants from Eastern Europe (26.4%, a difference of 0.010%), Immigrants from Russia (26.4%, a difference of 0.030%), Delaware (26.3%, a difference of 0.16%), and Dutch West Indian (26.3%, a difference of 0.17%).
DemographicsRating | RankWage/Income Gap
Chileans
22.3
/100
|
#194
Fair
26.3%
Immigrants from Malaysia
22.2
/100
|
#195
Fair
26.3%
Immigrants from Western Asia
21.7
/100
|
#196
Fair
26.3%
Zimbabweans
21.6
/100
|
#197
Fair
26.3%
Venezuelans
21.5
/100
|
#198
Fair
26.3%
Dutch West Indians
21.0
/100
|
#199
Fair
26.3%
Delaware
20.9
/100
|
#200
Fair
26.3%
Immigrants from Syria
19.3
/100
|
#201
Poor
26.4%
Laotians
19.2
/100
|
#202
Poor
26.4%
Immigrants from Eastern Europe
19.2
/100
|
#203
Poor
26.4%
Immigrants from Russia
19.0
/100
|
#204
Poor
26.4%
Immigrants from Southern Europe
17.3
/100
|
#205
Poor
26.4%
Indians (Asian)
16.5
/100
|
#206
Poor
26.4%
Immigrants from Italy
15.8
/100
|
#207
Poor
26.5%
Egyptians
12.7
/100
|
#208
Poor
26.6%

Immigrants from Syria Wage/Income Gap Correlation Summary

MeasurementImmigrants from Syria DataWage/Income Gap Data
Minimum0.021%13.6%
Maximum8.7%58.0%
Range8.6%44.4%
Mean1.7%29.9%
Median1.3%28.0%
Interquartile 25% (IQ1)0.63%24.7%
Interquartile 75% (IQ3)2.0%33.5%
Interquartile Range (IQR)1.4%8.8%
Standard Deviation (Sample)1.6%9.2%
Standard Deviation (Population)1.6%9.1%

Correlation Details

Immigrants from Syria PercentileSample SizeWage/Income Gap
[
0.0%
-
0.5%
]
0.021%
70,566,21424.7%
[
0.0%
-
0.5%
]
0.060%
45,844,54423.7%
[
0.0%
-
0.5%
]
0.11%
19,349,68524.4%
[
0.0%
-
0.5%
]
0.15%
10,497,61925.7%
[
0.0%
-
0.5%
]
0.20%
5,870,43230.4%
[
0.0%
-
0.5%
]
0.24%
5,355,71125.5%
[
0.0%
-
0.5%
]
0.28%
3,266,60926.4%
[
0.0%
-
0.5%
]
0.33%
2,050,31230.6%
[
0.0%
-
0.5%
]
0.37%
1,463,27328.7%
[
0.0%
-
0.5%
]
0.41%
1,108,29425.1%
[
0.0%
-
0.5%
]
0.46%
858,73028.3%
[
0.0%
-
0.5%
]
0.50%
1,546,03830.6%
[
0.5%
-
1.0%
]
0.54%
555,55129.1%
[
0.5%
-
1.0%
]
0.58%
775,66227.8%
[
0.5%
-
1.0%
]
0.63%
585,73624.2%
[
0.5%
-
1.0%
]
0.67%
162,13029.6%
[
0.5%
-
1.0%
]
0.71%
345,20222.2%
[
0.5%
-
1.0%
]
0.75%
389,43326.7%
[
0.5%
-
1.0%
]
0.80%
488,35526.2%
[
0.5%
-
1.0%
]
0.85%
227,34921.8%
[
0.5%
-
1.0%
]
0.89%
238,02733.5%
[
0.5%
-
1.0%
]
0.92%
265,76122.5%
[
0.5%
-
1.0%
]
0.98%
182,11622.3%
[
1.0%
-
1.5%
]
1.02%
345,70227.2%
[
1.0%
-
1.5%
]
1.06%
183,67827.6%
[
1.0%
-
1.5%
]
1.11%
134,02126.5%
[
1.0%
-
1.5%
]
1.16%
49,58628.9%
[
1.0%
-
1.5%
]
1.18%
123,07515.8%
[
1.0%
-
1.5%
]
1.23%
267,82523.3%
[
1.0%
-
1.5%
]
1.30%
17,89352.6%
[
1.0%
-
1.5%
]
1.33%
42,48636.5%
[
1.0%
-
1.5%
]
1.37%
94,05326.5%
[
1.0%
-
1.5%
]
1.41%
54,26028.3%
[
1.0%
-
1.5%
]
1.45%
58,33217.2%
[
1.0%
-
1.5%
]
1.49%
47,79130.2%
[
1.5%
-
2.0%
]
1.58%
68,00125.6%
[
1.5%
-
2.0%
]
1.62%
149,83918.6%
[
1.5%
-
2.0%
]
1.67%
4,36231.8%
[
1.5%
-
2.0%
]
1.72%
22,01758.0%
[
1.5%
-
2.0%
]
1.76%
32,37639.2%
[
1.5%
-
2.0%
]
1.80%
17,21244.7%
[
1.5%
-
2.0%
]
1.89%
30,37239.9%
[
1.5%
-
2.0%
]
1.93%
31,67135.5%
[
2.0%
-
2.5%
]
2.01%
1,09756.2%
[
2.0%
-
2.5%
]
2.05%
9,76119.8%
[
2.0%
-
2.5%
]
2.15%
83,34329.5%
[
2.0%
-
2.5%
]
2.19%
27,46834.7%
[
2.5%
-
3.0%
]
2.57%
80,11331.8%
[
2.5%
-
3.0%
]
2.70%
35,96038.6%
[
2.5%
-
3.0%
]
2.80%
8,18037.6%
[
3.0%
-
3.5%
]
3.12%
8,76452.5%
[
3.0%
-
3.5%
]
3.14%
19113.6%
[
3.5%
-
4.0%
]
3.58%
24,98526.7%
[
3.5%
-
4.0%
]
3.85%
15635.9%
[
5.0%
-
5.5%
]
5.21%
29,28626.3%
[
5.5%
-
6.0%
]
5.54%
16,35820.1%
[
5.5%
-
6.0%
]
5.81%
5,95836.6%
[
8.5%
-
9.0%
]
8.66%
50830.0%