Immigrants from Syria Married-Couple Family Poverty

COMPARE

Immigrants from Syria
Race
Ancestry
AfghanAfricanAlaska NativeAlaskan AthabascanAlbanianAleutAlsatianAmericanApacheArabArapahoArgentineanArmenianAssyrian/Chaldean/SyriacAustralianAustrianBahamianBangladeshiBarbadianBasqueBelgianBelizeanBermudanBhutaneseBlackfeetBolivianBrazilianBritishBritish West IndianBulgarianBurmeseCajunCambodianCanadianCape VerdeanCarpatho RusynCelticCentral AmericanCentral American IndianCherokeeCheyenneChickasawChileanChineseChippewaChoctawColombianColvilleComancheCosta RicanCreeCreekCroatianCrowCubanCypriotCzechCzechoslovakianDanishDelawareDominicanDutchDutch West IndianEastern EuropeanEcuadorianEgyptianEnglishEstonianEthiopianEuropeanFijianFilipinoFinnishFrenchFrench American IndianFrench CanadianGermanGerman RussianGhanaianGreekGuamanian/ChamorroGuatemalanGuyaneseHaitianHmongHonduranHopiHoumaHungarianIcelanderIndian (Asian)IndonesianInupiatIranianIraqiIrishIroquoisIsraeliItalianJamaicanJapaneseJordanianKenyanKiowaKoreanLaotianLatvianLebaneseLiberianLithuanianLumbeeLuxembourgerMacedonianMalaysianMalteseMarshalleseMenomineeMexicanMexican American IndianMongolianMoroccanNative HawaiianNavajoNepaleseNew ZealanderNicaraguanNigerianNorthern EuropeanNorwegianOkinawanOsageOttawaPaiutePakistaniPalestinianPanamanianParaguayanPennsylvania GermanPeruvianPimaPolishPortuguesePotawatomiPuebloPuerto RicanPuget Sound SalishRomanianRussianSalvadoranSamoanScandinavianScotch-IrishScottishSeminoleSenegaleseSerbianShoshoneSierra LeoneanSiouxSlavicSlovakSloveneSomaliSouth AfricanSouth AmericanSouth American IndianSoviet UnionSpaniardSpanishSpanish AmericanSpanish American IndianSri LankanSubsaharan AfricanSudaneseSwedishSwissSyrianTaiwaneseThaiTlingit-HaidaTohono O'OdhamTonganTrinidadian and TobagonianTsimshianTurkishU.S. Virgin IslanderUgandanUkrainianUruguayanUteVenezuelanVietnameseWelshWest IndianYakamaYaquiYugoslavianYumanYup'ikZimbabwean
Immigration
NonimmigrantsImmigrantsAfghanistanAfricaAlbaniaArgentinaArmeniaAsiaAustraliaAustriaBahamasBangladeshBarbadosBelarusBelgiumBelizeBoliviaBosnia and HerzegovinaBrazilBulgariaBurma/MyanmarCabo VerdeCambodiaCameroonCanadaCaribbeanCentral AmericaChileChinaColombiaCongoCosta RicaCroatiaCubaCzechoslovakiaDenmarkDominicaDominican RepublicEastern AfricaEastern AsiaEastern EuropeEcuadorEgyptEl SalvadorEnglandEritreaEthiopiaEuropeFijiFranceGermanyGhanaGreeceGrenadaGuatemalaGuyanaHaitiHondurasHong KongHungaryIndiaIndonesiaIranIraqIrelandIsraelItalyJamaicaJapanJordanKazakhstanKenyaKoreaKuwaitLaosLatin AmericaLatviaLebanonLiberiaLithuaniaMalaysiaMexicoMicronesiaMiddle AfricaMoldovaMoroccoNepalNetherlandsNicaraguaNigeriaNorth AmericaNorth MacedoniaNorthern AfricaNorthern EuropeNorwayOceaniaPakistanPanamaPeruPhilippinesPolandPortugalRomaniaRussiaSaudi ArabiaScotlandSenegalSerbiaSierra LeoneSingaporeSomaliaSouth AfricaSouth AmericaSouth Central AsiaSouth Eastern AsiaSouthern EuropeSpainSri LankaSt. Vincent and the GrenadinesSudanSwedenSwitzerlandSyriaTaiwanThailandTrinidad and TobagoTurkeyUgandaUkraineUruguayUzbekistanVenezuelaVietnamWest IndiesWestern AfricaWestern AsiaWestern EuropeYemenZaireZimbabweAzores
Select to Compare
Race
Ancestry
AfghanAfricanAlaska NativeAlaskan AthabascanAlbanianAleutAlsatianAmericanApacheArabArapahoArgentineanArmenianAssyrian/Chaldean/SyriacAustralianAustrianBahamianBangladeshiBarbadianBasqueBelgianBelizeanBermudanBhutaneseBlackfeetBolivianBrazilianBritishBritish West IndianBulgarianBurmeseCajunCambodianCanadianCape VerdeanCarpatho RusynCelticCentral AmericanCentral American IndianCherokeeCheyenneChickasawChileanChineseChippewaChoctawColombianColvilleComancheCosta RicanCreeCreekCroatianCrowCubanCypriotCzechCzechoslovakianDanishDelawareDominicanDutchDutch West IndianEastern EuropeanEcuadorianEgyptianEnglishEstonianEthiopianEuropeanFijianFilipinoFinnishFrenchFrench American IndianFrench CanadianGermanGerman RussianGhanaianGreekGuamanian/ChamorroGuatemalanGuyaneseHaitianHmongHonduranHopiHoumaHungarianIcelanderIndian (Asian)IndonesianInupiatIranianIraqiIrishIroquoisIsraeliItalianJamaicanJapaneseJordanianKenyanKiowaKoreanLaotianLatvianLebaneseLiberianLithuanianLumbeeLuxembourgerMacedonianMalaysianMalteseMarshalleseMenomineeMexicanMexican American IndianMongolianMoroccanNative HawaiianNavajoNepaleseNew ZealanderNicaraguanNigerianNorthern EuropeanNorwegianOkinawanOsageOttawaPaiutePakistaniPalestinianPanamanianParaguayanPennsylvania GermanPeruvianPimaPolishPortuguesePotawatomiPuebloPuerto RicanPuget Sound SalishRomanianRussianSalvadoranSamoanScandinavianScotch-IrishScottishSeminoleSenegaleseSerbianShoshoneSierra LeoneanSiouxSlavicSlovakSloveneSomaliSouth AfricanSouth AmericanSouth American IndianSoviet UnionSpaniardSpanishSpanish AmericanSpanish American IndianSri LankanSubsaharan AfricanSudaneseSwedishSwissSyrianTaiwaneseThaiTlingit-HaidaTohono O'OdhamTonganTrinidadian and TobagonianTsimshianTurkishU.S. Virgin IslanderUgandanUkrainianUruguayanUteVenezuelanVietnameseWelshWest IndianYakamaYaquiYugoslavianYumanYup'ikZimbabwean
Immigration
NonimmigrantsImmigrantsAfghanistanAfricaAlbaniaArgentinaArmeniaAsiaAustraliaAustriaBahamasBangladeshBarbadosBelarusBelgiumBelizeBoliviaBosnia and HerzegovinaBrazilBulgariaBurma/MyanmarCabo VerdeCambodiaCameroonCanadaCaribbeanCentral AmericaChileChinaColombiaCongoCosta RicaCroatiaCubaCzechoslovakiaDenmarkDominicaDominican RepublicEastern AfricaEastern AsiaEastern EuropeEcuadorEgyptEl SalvadorEnglandEritreaEthiopiaEuropeFijiFranceGermanyGhanaGreeceGrenadaGuatemalaGuyanaHaitiHondurasHong KongHungaryIndiaIndonesiaIranIraqIrelandIsraelItalyJamaicaJapanJordanKazakhstanKenyaKoreaKuwaitLaosLatin AmericaLatviaLebanonLiberiaLithuaniaMalaysiaMexicoMicronesiaMiddle AfricaMoldovaMoroccoNepalNetherlandsNicaraguaNigeriaNorth AmericaNorth MacedoniaNorthern AfricaNorthern EuropeNorwayOceaniaPakistanPanamaPeruPhilippinesPolandPortugalRomaniaRussiaSaudi ArabiaScotlandSenegalSerbiaSierra LeoneSingaporeSomaliaSouth AfricaSouth AmericaSouth Central AsiaSouth Eastern AsiaSouthern EuropeSpainSri LankaSt. Vincent and the GrenadinesSudanSwedenSwitzerlandTaiwanThailandTrinidad and TobagoTurkeyUgandaUkraineUruguayUzbekistanVenezuelaVietnamWest IndiesWestern AfricaWestern AsiaWestern EuropeYemenZaireZimbabweAzores
Married-Couple Family Poverty
Income
Poverty
Unemployment
Labor Participation
Family Structure
Vehicle Availability
Education Level
Disability

Immigrants from Syria Married-Couple Family Poverty
Poor

5.5%
POVERTY | MARRIED-COUPLE FAMILIES
15.4/ 100
METRIC RATING
209th/ 347
METRIC RANK

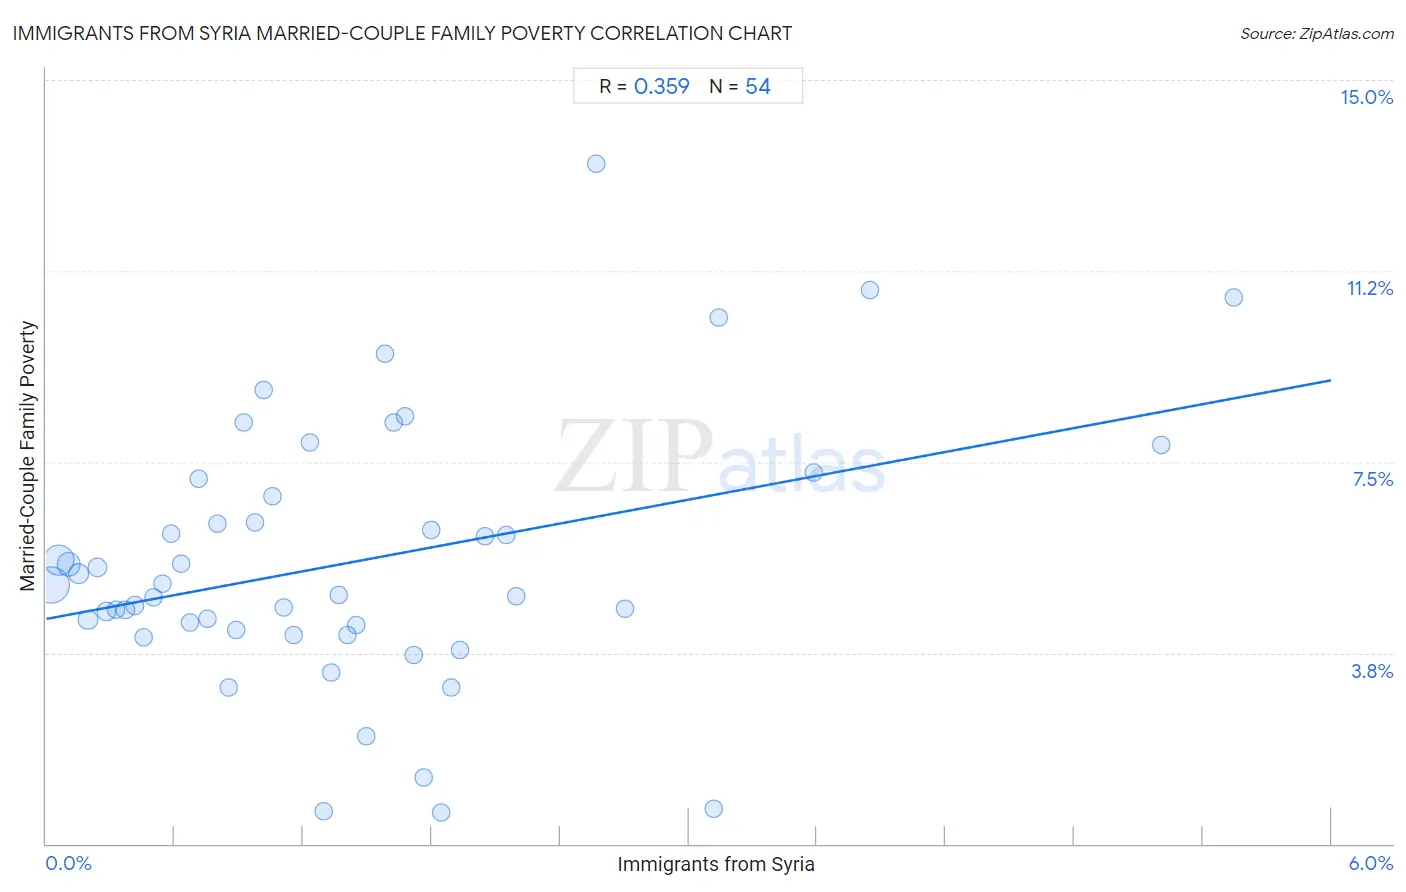
Immigrants from Syria Married-Couple Family Poverty Correlation Chart

The statistical analysis conducted on geographies consisting of 173,511,056 people shows a mild positive correlation between the proportion of Immigrants from Syria and poverty level among married-couple families in the United States with a correlation coefficient (R) of 0.359 and weighted average of 5.5%. On average, for every 1% (one percent) increase in Immigrants from Syria within a typical geography, there is an increase of 0.78% in poverty level among married-couple families.
Immigrants from Syria Married-Couple Family Poverty
It is essential to understand that the correlation between the percentage of Immigrants from Syria and poverty level among married-couple families does not imply a direct cause-and-effect relationship. It remains uncertain whether the presence of Immigrants from Syria influences an upward or downward trend in the level of poverty level among married-couple families within an area, or if Immigrants from Syria simply ended up residing in those areas with higher or lower levels of poverty level among married-couple families due to other factors.

Demographics Similar to Immigrants from Syria by Married-Couple Family Poverty

In terms of married-couple family poverty, the demographic groups most similar to Immigrants from Syria are French American Indian (5.5%, a difference of 0.14%), Immigrants from Micronesia (5.5%, a difference of 0.21%), Nigerian (5.5%, a difference of 0.23%), Immigrants from Thailand (5.5%, a difference of 0.30%), and Immigrants from Africa (5.5%, a difference of 0.46%).
DemographicsRating | RankMarried-Couple Family Poverty
Immigrants from Middle Africa
23.8
/100
|
#202
Fair
5.4%
Immigrants from Peru
21.8
/100
|
#203
Fair
5.4%
Immigrants from Costa Rica
19.4
/100
|
#204
Poor
5.4%
Chippewa
18.9
/100
|
#205
Poor
5.4%
Osage
18.4
/100
|
#206
Poor
5.4%
Immigrants from Africa
17.6
/100
|
#207
Poor
5.5%
French American Indians
16.1
/100
|
#208
Poor
5.5%
Immigrants from Syria
15.4
/100
|
#209
Poor
5.5%
Immigrants from Micronesia
14.4
/100
|
#210
Poor
5.5%
Nigerians
14.3
/100
|
#211
Poor
5.5%
Immigrants from Thailand
14.0
/100
|
#212
Poor
5.5%
Immigrants from Liberia
13.3
/100
|
#213
Poor
5.5%
Iroquois
13.1
/100
|
#214
Poor
5.5%
Armenians
12.8
/100
|
#215
Poor
5.5%
Potawatomi
12.4
/100
|
#216
Poor
5.5%

Immigrants from Syria Married-Couple Family Poverty Correlation Summary

MeasurementImmigrants from Syria DataMarried-Couple Family Poverty Data
Minimum0.021%0.62%
Maximum5.5%13.3%
Range5.5%12.7%
Mean1.4%5.5%
Median1.2%5.0%
Interquartile 25% (IQ1)0.58%4.2%
Interquartile 75% (IQ3)1.8%6.8%
Interquartile Range (IQR)1.3%2.6%
Standard Deviation (Sample)1.2%2.6%
Standard Deviation (Population)1.2%2.6%

Correlation Details

Immigrants from Syria PercentileSample SizeMarried-Couple Family Poverty
[
0.0%
-
0.5%
]
0.021%
70,547,3115.1%
[
0.0%
-
0.5%
]
0.060%
45,808,0365.6%
[
0.0%
-
0.5%
]
0.11%
19,268,3985.5%
[
0.0%
-
0.5%
]
0.15%
10,448,7865.3%
[
0.0%
-
0.5%
]
0.20%
5,807,5984.4%
[
0.0%
-
0.5%
]
0.24%
5,327,3845.4%
[
0.0%
-
0.5%
]
0.28%
3,240,5904.6%
[
0.0%
-
0.5%
]
0.33%
2,036,7644.6%
[
0.0%
-
0.5%
]
0.37%
1,451,2694.6%
[
0.0%
-
0.5%
]
0.41%
1,098,5754.7%
[
0.0%
-
0.5%
]
0.46%
844,2724.1%
[
0.0%
-
0.5%
]
0.50%
1,541,1824.8%
[
0.5%
-
1.0%
]
0.54%
552,2645.1%
[
0.5%
-
1.0%
]
0.58%
766,3346.1%
[
0.5%
-
1.0%
]
0.63%
585,7365.5%
[
0.5%
-
1.0%
]
0.67%
160,3624.3%
[
0.5%
-
1.0%
]
0.71%
341,6667.2%
[
0.5%
-
1.0%
]
0.75%
386,8234.4%
[
0.5%
-
1.0%
]
0.80%
488,3556.3%
[
0.5%
-
1.0%
]
0.85%
210,8853.1%
[
0.5%
-
1.0%
]
0.89%
228,7754.2%
[
0.5%
-
1.0%
]
0.92%
265,7618.3%
[
0.5%
-
1.0%
]
0.98%
181,3936.3%
[
1.0%
-
1.5%
]
1.02%
345,7028.9%
[
1.0%
-
1.5%
]
1.06%
183,6786.8%
[
1.0%
-
1.5%
]
1.11%
134,0214.6%
[
1.0%
-
1.5%
]
1.16%
49,5864.1%
[
1.0%
-
1.5%
]
1.23%
267,8257.9%
[
1.0%
-
1.5%
]
1.30%
17,8930.65%
[
1.0%
-
1.5%
]
1.33%
42,4863.4%
[
1.0%
-
1.5%
]
1.37%
94,0534.9%
[
1.0%
-
1.5%
]
1.41%
52,7084.1%
[
1.0%
-
1.5%
]
1.45%
47,6604.3%
[
1.0%
-
1.5%
]
1.49%
45,6022.1%
[
1.5%
-
2.0%
]
1.58%
68,0019.6%
[
1.5%
-
2.0%
]
1.62%
149,8398.3%
[
1.5%
-
2.0%
]
1.68%
1,5518.4%
[
1.5%
-
2.0%
]
1.72%
22,0173.7%
[
1.5%
-
2.0%
]
1.76%
25,8011.3%
[
1.5%
-
2.0%
]
1.80%
17,2126.2%
[
1.5%
-
2.0%
]
1.84%
3,3630.62%
[
1.5%
-
2.0%
]
1.89%
13,9643.1%
[
1.5%
-
2.0%
]
1.93%
31,6713.8%
[
2.0%
-
2.5%
]
2.05%
9,7616.0%
[
2.0%
-
2.5%
]
2.15%
83,3436.1%
[
2.0%
-
2.5%
]
2.19%
27,4684.9%
[
2.5%
-
3.0%
]
2.57%
80,11313.3%
[
2.5%
-
3.0%
]
2.70%
27,4794.6%
[
3.0%
-
3.5%
]
3.12%
8,7640.68%
[
3.0%
-
3.5%
]
3.14%
19110.3%
[
3.5%
-
4.0%
]
3.58%
24,9857.3%
[
3.5%
-
4.0%
]
3.85%
15610.9%
[
5.0%
-
5.5%
]
5.21%
29,2867.8%
[
5.5%
-
6.0%
]
5.54%
16,35810.7%