Immigrants from Syria Self-Care Disability

COMPARE

Immigrants from Syria
Race
Ancestry
AfghanAfricanAlaska NativeAlaskan AthabascanAlbanianAleutAlsatianAmericanApacheArabArapahoArgentineanArmenianAssyrian/Chaldean/SyriacAustralianAustrianBahamianBangladeshiBarbadianBasqueBelgianBelizeanBermudanBhutaneseBlackfeetBolivianBrazilianBritishBritish West IndianBulgarianBurmeseCajunCambodianCanadianCape VerdeanCarpatho RusynCelticCentral AmericanCentral American IndianCherokeeCheyenneChickasawChileanChineseChippewaChoctawColombianColvilleComancheCosta RicanCreeCreekCroatianCrowCubanCypriotCzechCzechoslovakianDanishDelawareDominicanDutchDutch West IndianEastern EuropeanEcuadorianEgyptianEnglishEstonianEthiopianEuropeanFijianFilipinoFinnishFrenchFrench American IndianFrench CanadianGermanGerman RussianGhanaianGreekGuamanian/ChamorroGuatemalanGuyaneseHaitianHmongHonduranHopiHoumaHungarianIcelanderIndian (Asian)IndonesianInupiatIranianIraqiIrishIroquoisIsraeliItalianJamaicanJapaneseJordanianKenyanKiowaKoreanLaotianLatvianLebaneseLiberianLithuanianLumbeeLuxembourgerMacedonianMalaysianMalteseMarshalleseMenomineeMexicanMexican American IndianMongolianMoroccanNative HawaiianNavajoNepaleseNew ZealanderNicaraguanNigerianNorthern EuropeanNorwegianOkinawanOsageOttawaPaiutePakistaniPalestinianPanamanianParaguayanPennsylvania GermanPeruvianPimaPolishPortuguesePotawatomiPuebloPuerto RicanPuget Sound SalishRomanianRussianSalvadoranSamoanScandinavianScotch-IrishScottishSeminoleSenegaleseSerbianShoshoneSierra LeoneanSiouxSlavicSlovakSloveneSomaliSouth AfricanSouth AmericanSouth American IndianSoviet UnionSpaniardSpanishSpanish AmericanSpanish American IndianSri LankanSubsaharan AfricanSudaneseSwedishSwissSyrianTaiwaneseThaiTlingit-HaidaTohono O'OdhamTonganTrinidadian and TobagonianTsimshianTurkishU.S. Virgin IslanderUgandanUkrainianUruguayanUteVenezuelanVietnameseWelshWest IndianYakamaYaquiYugoslavianYumanYup'ikZimbabwean
Immigration
NonimmigrantsImmigrantsAfghanistanAfricaAlbaniaArgentinaArmeniaAsiaAustraliaAustriaBahamasBangladeshBarbadosBelarusBelgiumBelizeBoliviaBosnia and HerzegovinaBrazilBulgariaBurma/MyanmarCabo VerdeCambodiaCameroonCanadaCaribbeanCentral AmericaChileChinaColombiaCongoCosta RicaCroatiaCubaCzechoslovakiaDenmarkDominicaDominican RepublicEastern AfricaEastern AsiaEastern EuropeEcuadorEgyptEl SalvadorEnglandEritreaEthiopiaEuropeFijiFranceGermanyGhanaGreeceGrenadaGuatemalaGuyanaHaitiHondurasHong KongHungaryIndiaIndonesiaIranIraqIrelandIsraelItalyJamaicaJapanJordanKazakhstanKenyaKoreaKuwaitLaosLatin AmericaLatviaLebanonLiberiaLithuaniaMalaysiaMexicoMicronesiaMiddle AfricaMoldovaMoroccoNepalNetherlandsNicaraguaNigeriaNorth AmericaNorth MacedoniaNorthern AfricaNorthern EuropeNorwayOceaniaPakistanPanamaPeruPhilippinesPolandPortugalRomaniaRussiaSaudi ArabiaScotlandSenegalSerbiaSierra LeoneSingaporeSomaliaSouth AfricaSouth AmericaSouth Central AsiaSouth Eastern AsiaSouthern EuropeSpainSri LankaSt. Vincent and the GrenadinesSudanSwedenSwitzerlandSyriaTaiwanThailandTrinidad and TobagoTurkeyUgandaUkraineUruguayUzbekistanVenezuelaVietnamWest IndiesWestern AfricaWestern AsiaWestern EuropeYemenZaireZimbabweAzores
Select to Compare
Race
Ancestry
AfghanAfricanAlaska NativeAlaskan AthabascanAlbanianAleutAlsatianAmericanApacheArabArapahoArgentineanArmenianAssyrian/Chaldean/SyriacAustralianAustrianBahamianBangladeshiBarbadianBasqueBelgianBelizeanBermudanBhutaneseBlackfeetBolivianBrazilianBritishBritish West IndianBulgarianBurmeseCajunCambodianCanadianCape VerdeanCarpatho RusynCelticCentral AmericanCentral American IndianCherokeeCheyenneChickasawChileanChineseChippewaChoctawColombianColvilleComancheCosta RicanCreeCreekCroatianCrowCubanCypriotCzechCzechoslovakianDanishDelawareDominicanDutchDutch West IndianEastern EuropeanEcuadorianEgyptianEnglishEstonianEthiopianEuropeanFijianFilipinoFinnishFrenchFrench American IndianFrench CanadianGermanGerman RussianGhanaianGreekGuamanian/ChamorroGuatemalanGuyaneseHaitianHmongHonduranHopiHoumaHungarianIcelanderIndian (Asian)IndonesianInupiatIranianIraqiIrishIroquoisIsraeliItalianJamaicanJapaneseJordanianKenyanKiowaKoreanLaotianLatvianLebaneseLiberianLithuanianLumbeeLuxembourgerMacedonianMalaysianMalteseMarshalleseMenomineeMexicanMexican American IndianMongolianMoroccanNative HawaiianNavajoNepaleseNew ZealanderNicaraguanNigerianNorthern EuropeanNorwegianOkinawanOsageOttawaPaiutePakistaniPalestinianPanamanianParaguayanPennsylvania GermanPeruvianPimaPolishPortuguesePotawatomiPuebloPuerto RicanPuget Sound SalishRomanianRussianSalvadoranSamoanScandinavianScotch-IrishScottishSeminoleSenegaleseSerbianShoshoneSierra LeoneanSiouxSlavicSlovakSloveneSomaliSouth AfricanSouth AmericanSouth American IndianSoviet UnionSpaniardSpanishSpanish AmericanSpanish American IndianSri LankanSubsaharan AfricanSudaneseSwedishSwissSyrianTaiwaneseThaiTlingit-HaidaTohono O'OdhamTonganTrinidadian and TobagonianTsimshianTurkishU.S. Virgin IslanderUgandanUkrainianUruguayanUteVenezuelanVietnameseWelshWest IndianYakamaYaquiYugoslavianYumanYup'ikZimbabwean
Immigration
NonimmigrantsImmigrantsAfghanistanAfricaAlbaniaArgentinaArmeniaAsiaAustraliaAustriaBahamasBangladeshBarbadosBelarusBelgiumBelizeBoliviaBosnia and HerzegovinaBrazilBulgariaBurma/MyanmarCabo VerdeCambodiaCameroonCanadaCaribbeanCentral AmericaChileChinaColombiaCongoCosta RicaCroatiaCubaCzechoslovakiaDenmarkDominicaDominican RepublicEastern AfricaEastern AsiaEastern EuropeEcuadorEgyptEl SalvadorEnglandEritreaEthiopiaEuropeFijiFranceGermanyGhanaGreeceGrenadaGuatemalaGuyanaHaitiHondurasHong KongHungaryIndiaIndonesiaIranIraqIrelandIsraelItalyJamaicaJapanJordanKazakhstanKenyaKoreaKuwaitLaosLatin AmericaLatviaLebanonLiberiaLithuaniaMalaysiaMexicoMicronesiaMiddle AfricaMoldovaMoroccoNepalNetherlandsNicaraguaNigeriaNorth AmericaNorth MacedoniaNorthern AfricaNorthern EuropeNorwayOceaniaPakistanPanamaPeruPhilippinesPolandPortugalRomaniaRussiaSaudi ArabiaScotlandSenegalSerbiaSierra LeoneSingaporeSomaliaSouth AfricaSouth AmericaSouth Central AsiaSouth Eastern AsiaSouthern EuropeSpainSri LankaSt. Vincent and the GrenadinesSudanSwedenSwitzerlandTaiwanThailandTrinidad and TobagoTurkeyUgandaUkraineUruguayUzbekistanVenezuelaVietnamWest IndiesWestern AfricaWestern AsiaWestern EuropeYemenZaireZimbabweAzores
Self-Care Disability
Income
Poverty
Unemployment
Labor Participation
Family Structure
Vehicle Availability
Education Level
Disability

Immigrants from Syria Self-Care Disability
Tragic

2.6%
SELF-CARE DISABILITY
1.0/ 100
METRIC RATING
241st/ 347
METRIC RANK

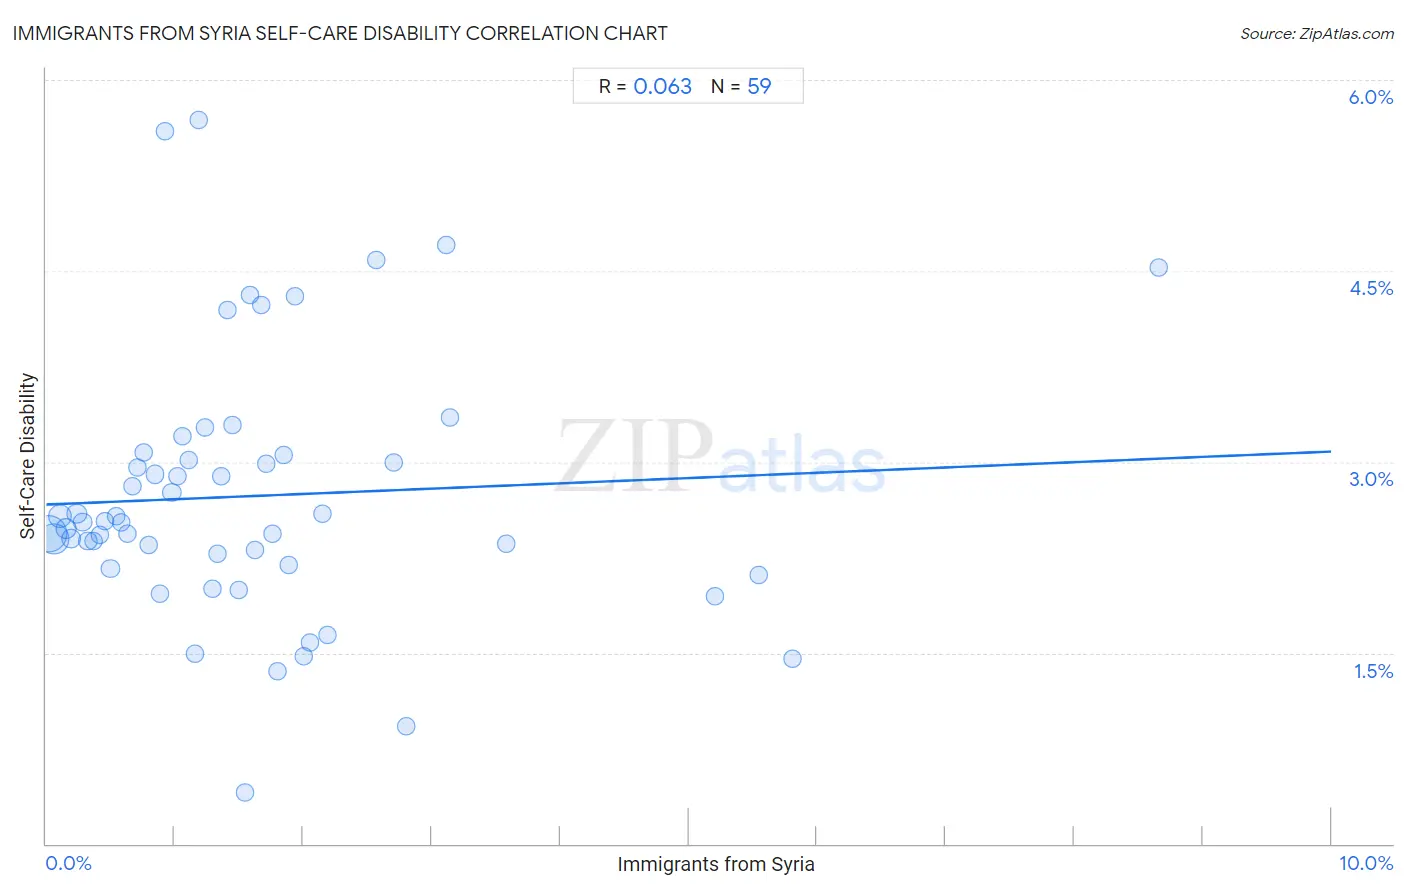
Immigrants from Syria Self-Care Disability Correlation Chart

The statistical analysis conducted on geographies consisting of 174,100,032 people shows a slight positive correlation between the proportion of Immigrants from Syria and percentage of population with self-care disability in the United States with a correlation coefficient (R) of 0.063 and weighted average of 2.6%. On average, for every 1% (one percent) increase in Immigrants from Syria within a typical geography, there is an increase of 0.042% in percentage of population with self-care disability.
Immigrants from Syria Self-Care Disability
It is essential to understand that the correlation between the percentage of Immigrants from Syria and percentage of population with self-care disability does not imply a direct cause-and-effect relationship. It remains uncertain whether the presence of Immigrants from Syria influences an upward or downward trend in the level of percentage of population with self-care disability within an area, or if Immigrants from Syria simply ended up residing in those areas with higher or lower levels of percentage of population with self-care disability due to other factors.

Demographics Similar to Immigrants from Syria by Self-Care Disability

In terms of self-care disability, the demographic groups most similar to Immigrants from Syria are Marshallese (2.6%, a difference of 0.17%), Immigrants from Panama (2.6%, a difference of 0.20%), Spanish (2.6%, a difference of 0.23%), Senegalese (2.6%, a difference of 0.24%), and Hawaiian (2.6%, a difference of 0.31%).
DemographicsRating | RankSelf-Care Disability
Vietnamese
2.1
/100
|
#234
Tragic
2.6%
Bahamians
2.0
/100
|
#235
Tragic
2.6%
Bermudans
1.9
/100
|
#236
Tragic
2.6%
Immigrants from Senegal
1.6
/100
|
#237
Tragic
2.6%
Senegalese
1.3
/100
|
#238
Tragic
2.6%
Immigrants from Panama
1.2
/100
|
#239
Tragic
2.6%
Marshallese
1.2
/100
|
#240
Tragic
2.6%
Immigrants from Syria
1.0
/100
|
#241
Tragic
2.6%
Spanish
0.8
/100
|
#242
Tragic
2.6%
Hawaiians
0.8
/100
|
#243
Tragic
2.6%
Yuman
0.8
/100
|
#244
Tragic
2.6%
Immigrants from Western Asia
0.6
/100
|
#245
Tragic
2.6%
Cheyenne
0.6
/100
|
#246
Tragic
2.6%
Immigrants from Albania
0.6
/100
|
#247
Tragic
2.6%
Nicaraguans
0.6
/100
|
#248
Tragic
2.6%

Immigrants from Syria Self-Care Disability Correlation Summary

MeasurementImmigrants from Syria DataSelf-Care Disability Data
Minimum0.021%0.40%
Maximum8.7%5.7%
Range8.6%5.3%
Mean1.6%2.7%
Median1.3%2.5%
Interquartile 25% (IQ1)0.63%2.2%
Interquartile 75% (IQ3)1.9%3.1%
Interquartile Range (IQR)1.3%0.86%
Standard Deviation (Sample)1.6%1.0%
Standard Deviation (Population)1.5%1.0%

Correlation Details

Immigrants from Syria PercentileSample SizeSelf-Care Disability
[
0.0%
-
0.5%
]
0.021%
70,566,2142.4%
[
0.0%
-
0.5%
]
0.060%
45,844,5442.4%
[
0.0%
-
0.5%
]
0.11%
19,349,6852.6%
[
0.0%
-
0.5%
]
0.15%
10,495,7562.5%
[
0.0%
-
0.5%
]
0.20%
5,870,4322.4%
[
0.0%
-
0.5%
]
0.24%
5,355,7112.6%
[
0.0%
-
0.5%
]
0.28%
3,266,6092.5%
[
0.0%
-
0.5%
]
0.33%
2,052,5722.4%
[
0.0%
-
0.5%
]
0.37%
1,463,2732.4%
[
0.0%
-
0.5%
]
0.41%
1,108,2942.4%
[
0.0%
-
0.5%
]
0.46%
855,7352.5%
[
0.0%
-
0.5%
]
0.50%
1,542,2182.2%
[
0.5%
-
1.0%
]
0.54%
554,8042.6%
[
0.5%
-
1.0%
]
0.58%
775,6622.5%
[
0.5%
-
1.0%
]
0.63%
586,3812.4%
[
0.5%
-
1.0%
]
0.67%
159,7092.8%
[
0.5%
-
1.0%
]
0.71%
345,2023.0%
[
0.5%
-
1.0%
]
0.75%
389,4333.1%
[
0.5%
-
1.0%
]
0.80%
488,3552.3%
[
0.5%
-
1.0%
]
0.85%
229,1372.9%
[
0.5%
-
1.0%
]
0.89%
238,0272.0%
[
0.5%
-
1.0%
]
0.92%
265,7615.6%
[
0.5%
-
1.0%
]
0.98%
182,1162.8%
[
1.0%
-
1.5%
]
1.02%
347,4952.9%
[
1.0%
-
1.5%
]
1.06%
183,6783.2%
[
1.0%
-
1.5%
]
1.11%
134,0213.0%
[
1.0%
-
1.5%
]
1.16%
49,5861.5%
[
1.0%
-
1.5%
]
1.18%
124,9205.7%
[
1.0%
-
1.5%
]
1.23%
267,8253.3%
[
1.0%
-
1.5%
]
1.30%
18,5122.0%
[
1.0%
-
1.5%
]
1.33%
42,4862.3%
[
1.0%
-
1.5%
]
1.37%
94,0532.9%
[
1.0%
-
1.5%
]
1.41%
54,2604.2%
[
1.0%
-
1.5%
]
1.45%
58,3323.3%
[
1.0%
-
1.5%
]
1.49%
47,7912.0%
[
1.5%
-
2.0%
]
1.55%
2580.40%
[
1.5%
-
2.0%
]
1.58%
68,0014.3%
[
1.5%
-
2.0%
]
1.62%
149,8392.3%
[
1.5%
-
2.0%
]
1.67%
4,3624.2%
[
1.5%
-
2.0%
]
1.72%
22,0173.0%
[
1.5%
-
2.0%
]
1.76%
32,3762.4%
[
1.5%
-
2.0%
]
1.80%
17,2121.4%
[
1.5%
-
2.0%
]
1.84%
3,3633.1%
[
1.5%
-
2.0%
]
1.89%
30,3722.2%
[
1.5%
-
2.0%
]
1.93%
31,6714.3%
[
2.0%
-
2.5%
]
2.01%
1,0971.5%
[
2.0%
-
2.5%
]
2.05%
9,7611.6%
[
2.0%
-
2.5%
]
2.15%
83,3432.6%
[
2.0%
-
2.5%
]
2.19%
27,4681.6%
[
2.5%
-
3.0%
]
2.57%
80,1134.6%
[
2.5%
-
3.0%
]
2.70%
35,9603.0%
[
2.5%
-
3.0%
]
2.80%
8,1800.93%
[
3.0%
-
3.5%
]
3.12%
8,7644.7%
[
3.0%
-
3.5%
]
3.14%
1913.4%
[
3.5%
-
4.0%
]
3.58%
24,9852.4%
[
5.0%
-
5.5%
]
5.21%
29,2861.9%
[
5.5%
-
6.0%
]
5.54%
16,3582.1%
[
5.5%
-
6.0%
]
5.81%
5,9581.5%
[
8.5%
-
9.0%
]
8.66%
5084.5%