Choctaw vs Indonesian Disability Age Under 5
COMPARE
Choctaw
Indonesian
Disability Age Under 5
Disability Age Under 5 Comparison
Choctaw
Indonesians
1.9%
DISABILITY AGE UNDER 5
0.0/ 100
METRIC RATING
330th/ 347
METRIC RANK
1.2%
DISABILITY AGE UNDER 5
95.9/ 100
METRIC RATING
104th/ 347
METRIC RANK
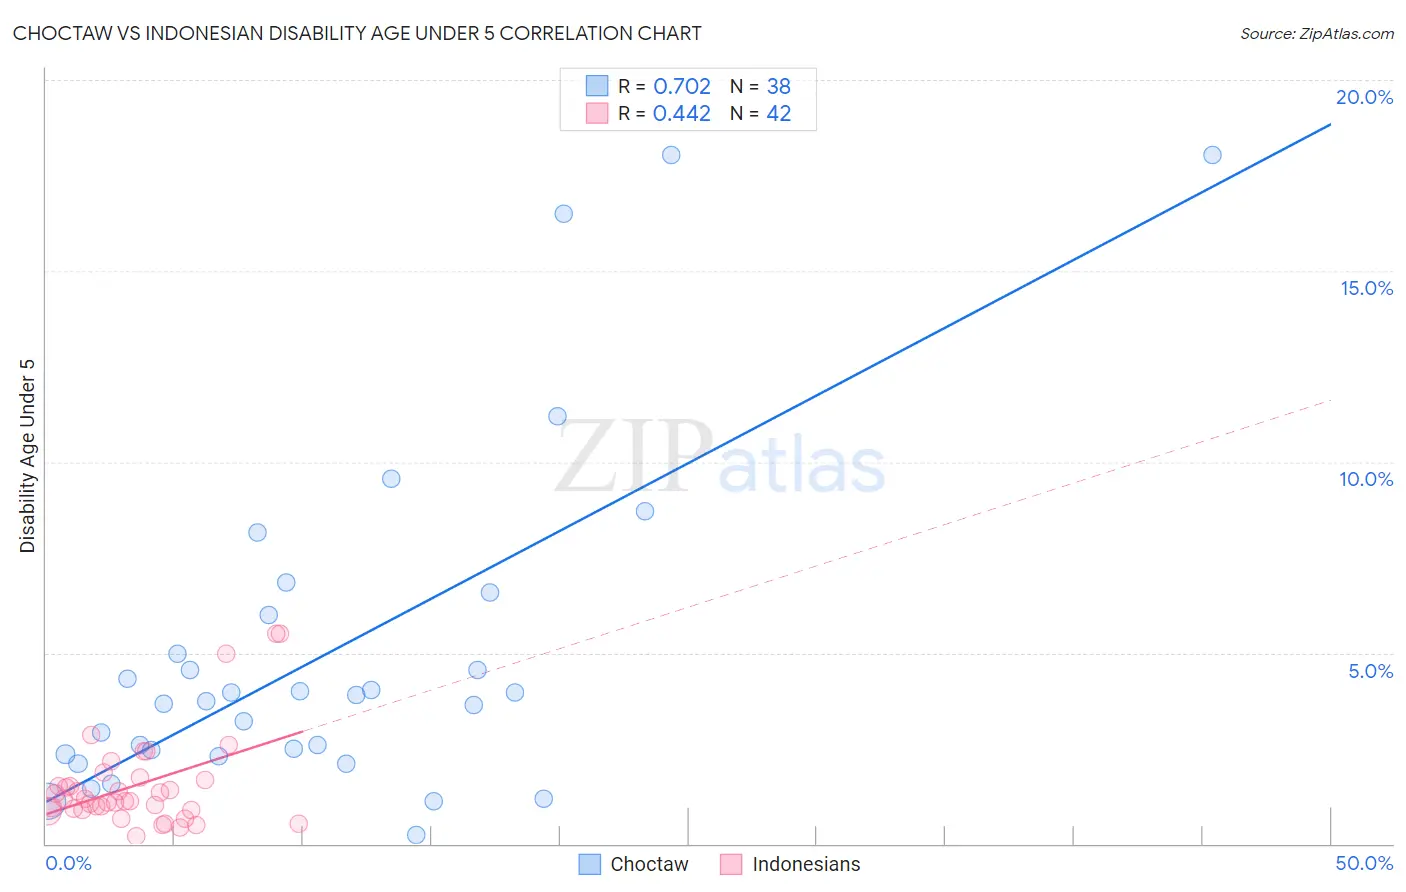
Choctaw vs Indonesian Disability Age Under 5 Correlation Chart
The statistical analysis conducted on geographies consisting of 165,165,816 people shows a strong positive correlation between the proportion of Choctaw and percentage of population with a disability under the age of 5 in the United States with a correlation coefficient (R) of 0.702 and weighted average of 1.9%. Similarly, the statistical analysis conducted on geographies consisting of 116,670,957 people shows a moderate positive correlation between the proportion of Indonesians and percentage of population with a disability under the age of 5 in the United States with a correlation coefficient (R) of 0.442 and weighted average of 1.2%, a difference of 62.7%.
Disability Age Under 5 Correlation Summary
| Measurement | Choctaw | Indonesian |
| Minimum | 0.24% | 0.21% |
| Maximum | 18.0% | 5.5% |
| Range | 17.8% | 5.3% |
| Mean | 5.0% | 1.5% |
| Median | 3.8% | 1.1% |
| Interquartile 25% (IQ1) | 2.3% | 0.90% |
| Interquartile 75% (IQ3) | 6.0% | 1.7% |
| Interquartile Range (IQR) | 3.6% | 0.76% |
| Standard Deviation (Sample) | 4.4% | 1.2% |
| Standard Deviation (Population) | 4.4% | 1.2% |
Similar Demographics by Disability Age Under 5
Demographics Similar to Choctaw by Disability Age Under 5
In terms of disability age under 5, the demographic groups most similar to Choctaw are French Canadian (1.9%, a difference of 0.30%), Houma (1.9%, a difference of 0.32%), Chippewa (1.9%, a difference of 0.36%), American (1.9%, a difference of 0.80%), and Osage (1.8%, a difference of 2.5%).
| Demographics | Rating | Rank | Disability Age Under 5 |
| Chickasaw | 0.0 /100 | #323 | Tragic 1.7% |
| Cherokee | 0.0 /100 | #324 | Tragic 1.8% |
| Immigrants | Portugal | 0.0 /100 | #325 | Tragic 1.8% |
| Sioux | 0.0 /100 | #326 | Tragic 1.8% |
| Osage | 0.0 /100 | #327 | Tragic 1.8% |
| Americans | 0.0 /100 | #328 | Tragic 1.9% |
| Houma | 0.0 /100 | #329 | Tragic 1.9% |
| Choctaw | 0.0 /100 | #330 | Tragic 1.9% |
| French Canadians | 0.0 /100 | #331 | Tragic 1.9% |
| Chippewa | 0.0 /100 | #332 | Tragic 1.9% |
| Dutch West Indians | 0.0 /100 | #333 | Tragic 1.9% |
| Natives/Alaskans | 0.0 /100 | #334 | Tragic 1.9% |
| Pennsylvania Germans | 0.0 /100 | #335 | Tragic 1.9% |
| Paraguayans | 0.0 /100 | #336 | Tragic 2.0% |
| Apache | 0.0 /100 | #337 | Tragic 2.0% |
Demographics Similar to Indonesians by Disability Age Under 5
In terms of disability age under 5, the demographic groups most similar to Indonesians are Immigrants from Morocco (1.2%, a difference of 0.070%), Immigrants from Nicaragua (1.2%, a difference of 0.070%), Immigrants from Uganda (1.1%, a difference of 0.12%), Immigrants from South Africa (1.2%, a difference of 0.19%), and Nicaraguan (1.1%, a difference of 0.24%).
| Demographics | Rating | Rank | Disability Age Under 5 |
| Immigrants | Iraq | 96.5 /100 | #97 | Exceptional 1.1% |
| Immigrants | South Eastern Asia | 96.5 /100 | #98 | Exceptional 1.1% |
| Dominicans | 96.3 /100 | #99 | Exceptional 1.1% |
| Nicaraguans | 96.3 /100 | #100 | Exceptional 1.1% |
| Immigrants | Uganda | 96.1 /100 | #101 | Exceptional 1.1% |
| Immigrants | Morocco | 96.0 /100 | #102 | Exceptional 1.2% |
| Immigrants | Nicaragua | 96.0 /100 | #103 | Exceptional 1.2% |
| Indonesians | 95.9 /100 | #104 | Exceptional 1.2% |
| Immigrants | South Africa | 95.6 /100 | #105 | Exceptional 1.2% |
| Cambodians | 95.4 /100 | #106 | Exceptional 1.2% |
| Immigrants | West Indies | 95.3 /100 | #107 | Exceptional 1.2% |
| Iraqis | 95.1 /100 | #108 | Exceptional 1.2% |
| Immigrants | Panama | 95.0 /100 | #109 | Exceptional 1.2% |
| Immigrants | Lebanon | 95.0 /100 | #110 | Exceptional 1.2% |
| Senegalese | 94.6 /100 | #111 | Exceptional 1.2% |