Choctaw 2 or more Vehicles in Household
COMPARE
Choctaw
Select to Compare
2 or more Vehicles in Household
Choctaw 2 or more Vehicles in Household
59.3%
2+ VEHICLES AVAILABLE
99.9/ 100
METRIC RATING
50th/ 347
METRIC RANK
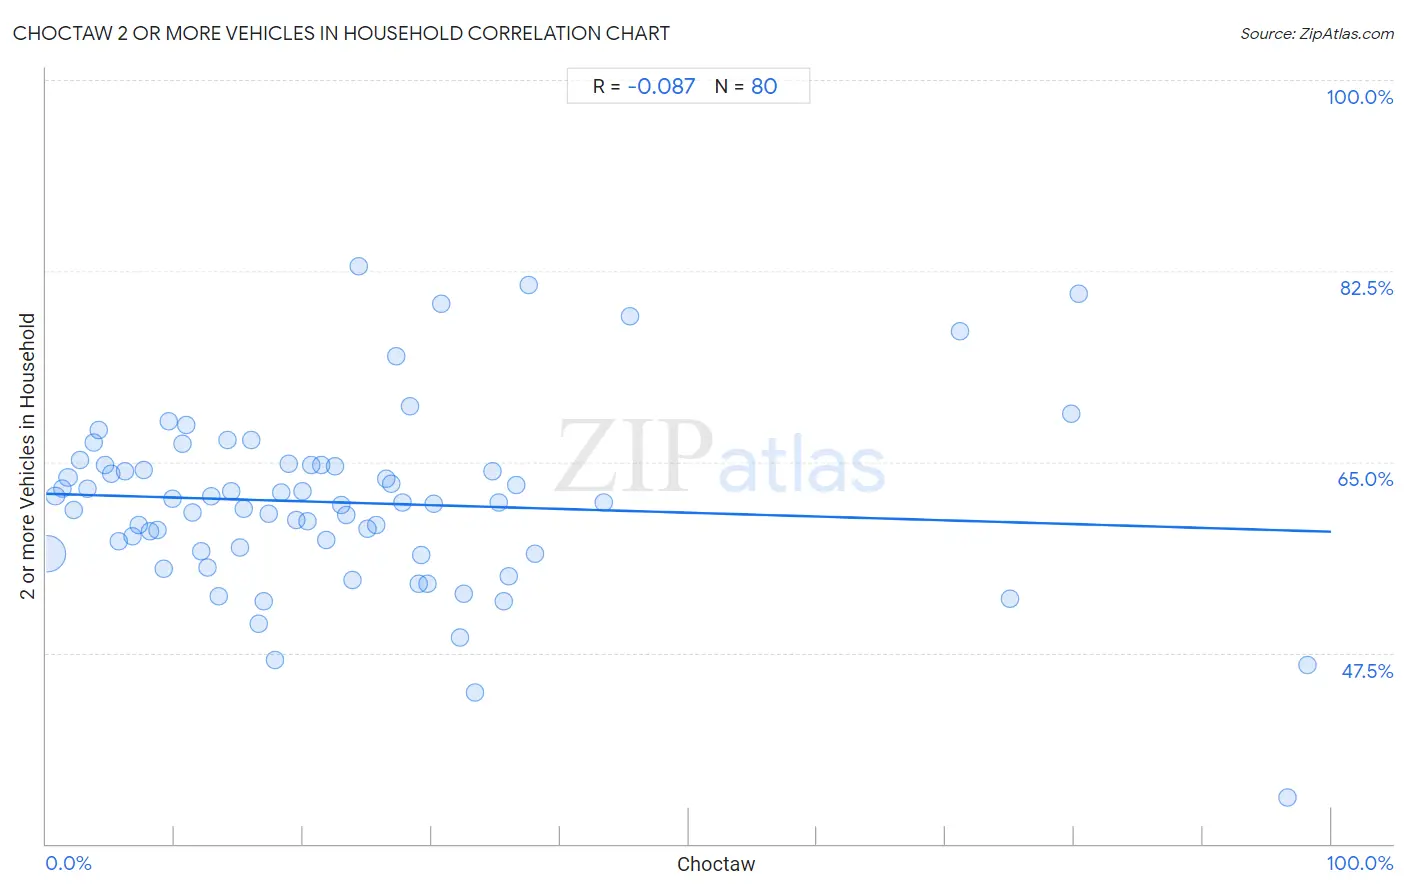
Choctaw 2 or more Vehicles in Household Correlation Chart
The statistical analysis conducted on geographies consisting of 269,636,757 people shows a slight negative correlation between the proportion of Choctaw and percentage of households with 2 or more vehicles available in the United States with a correlation coefficient (R) of -0.087 and weighted average of 59.3%. On average, for every 1% (one percent) increase in Choctaw within a typical geography, there is a decrease of 0.035% in percentage of households with 2 or more vehicles available.
It is essential to understand that the correlation between the percentage of Choctaw and percentage of households with 2 or more vehicles available does not imply a direct cause-and-effect relationship. It remains uncertain whether the presence of Choctaw influences an upward or downward trend in the level of percentage of households with 2 or more vehicles available within an area, or if Choctaw simply ended up residing in those areas with higher or lower levels of percentage of households with 2 or more vehicles available due to other factors.
Demographics Similar to Choctaw by 2 or more Vehicles in Household
In terms of 2 or more vehicles in household, the demographic groups most similar to Choctaw are Belgian (59.3%, a difference of 0.010%), Immigrants from India (59.3%, a difference of 0.040%), Yaqui (59.3%, a difference of 0.060%), Spaniard (59.2%, a difference of 0.14%), and Immigrants from Laos (59.2%, a difference of 0.14%).
| Demographics | Rating | Rank | 2 or more Vehicles in Household |
| Czechoslovakians | 100.0 /100 | #43 | Exceptional 59.8% |
| French | 100.0 /100 | #44 | Exceptional 59.8% |
| Immigrants from Taiwan | 100.0 /100 | #45 | Exceptional 59.7% |
| Immigrants from South Eastern Asia | 100.0 /100 | #46 | Exceptional 59.6% |
| Yaqui | 99.9 /100 | #47 | Exceptional 59.3% |
| Immigrants from India | 99.9 /100 | #48 | Exceptional 59.3% |
| Belgians | 99.9 /100 | #49 | Exceptional 59.3% |
| Choctaw | 99.9 /100 | #50 | Exceptional 59.3% |
| Spaniards | 99.9 /100 | #51 | Exceptional 59.2% |
| Immigrants from Laos | 99.9 /100 | #52 | Exceptional 59.2% |
| Celtics | 99.9 /100 | #53 | Exceptional 59.2% |
| Bhutanese | 99.9 /100 | #54 | Exceptional 59.1% |
| Luxembourgers | 99.9 /100 | #55 | Exceptional 59.1% |
| Chickasaw | 99.9 /100 | #56 | Exceptional 59.0% |
| Afghans | 99.9 /100 | #57 | Exceptional 59.0% |
Choctaw 2 or more Vehicles in Household Correlation Summary
| Measurement | Choctaw Data | 2 or more Vehicles in Household Data |
| Minimum | 0.081% | 34.2% |
| Maximum | 98.1% | 83.0% |
| Range | 98.1% | 48.7% |
| Mean | 23.6% | 61.3% |
| Median | 19.7% | 61.3% |
| Interquartile 25% (IQ1) | 9.7% | 56.7% |
| Interquartile 75% (IQ3) | 29.9% | 64.7% |
| Interquartile Range (IQR) | 20.2% | 8.0% |
| Standard Deviation (Sample) | 20.6% | 8.3% |
| Standard Deviation (Population) | 20.5% | 8.2% |
Correlation Details
| Choctaw Percentile | Sample Size | 2 or more Vehicles in Household |
[ 0.0% - 0.5% ] 0.081% | 256,194,192 | 56.6% |
[ 0.5% - 1.0% ] 0.70% | 6,494,652 | 61.9% |
[ 1.0% - 1.5% ] 1.22% | 3,039,283 | 62.5% |
[ 1.5% - 2.0% ] 1.70% | 1,678,875 | 63.6% |
[ 2.0% - 2.5% ] 2.17% | 573,691 | 60.5% |
[ 2.5% - 3.0% ] 2.60% | 421,467 | 65.2% |
[ 3.0% - 3.5% ] 3.18% | 217,548 | 62.6% |
[ 3.5% - 4.0% ] 3.67% | 159,503 | 66.8% |
[ 4.0% - 4.5% ] 4.08% | 104,413 | 67.9% |
[ 4.5% - 5.0% ] 4.56% | 45,713 | 64.7% |
[ 5.0% - 5.5% ] 5.10% | 44,110 | 63.9% |
[ 5.5% - 6.0% ] 5.62% | 34,881 | 57.7% |
[ 6.0% - 6.5% ] 6.13% | 22,808 | 64.1% |
[ 6.5% - 7.0% ] 6.70% | 96,691 | 58.2% |
[ 7.0% - 7.5% ] 7.18% | 43,154 | 59.2% |
[ 7.5% - 8.0% ] 7.59% | 24,160 | 64.3% |
[ 8.0% - 8.5% ] 8.09% | 14,201 | 58.6% |
[ 8.5% - 9.0% ] 8.61% | 26,968 | 58.7% |
[ 9.0% - 9.5% ] 9.16% | 3,787 | 55.2% |
[ 9.5% - 10.0% ] 9.54% | 10,404 | 68.7% |
[ 9.5% - 10.0% ] 9.87% | 28,765 | 61.6% |
[ 10.5% - 11.0% ] 10.58% | 13,724 | 66.6% |
[ 10.5% - 11.0% ] 10.93% | 4,472 | 68.4% |
[ 11.0% - 11.5% ] 11.41% | 16,242 | 60.4% |
[ 12.0% - 12.5% ] 12.09% | 65,987 | 56.8% |
[ 12.5% - 13.0% ] 12.58% | 11,673 | 55.3% |
[ 12.5% - 13.0% ] 12.87% | 4,826 | 61.8% |
[ 13.0% - 13.5% ] 13.41% | 5,758 | 52.6% |
[ 14.0% - 14.5% ] 14.08% | 6,406 | 67.0% |
[ 14.0% - 14.5% ] 14.38% | 29,855 | 62.3% |
[ 15.0% - 15.5% ] 15.06% | 25,206 | 57.1% |
[ 15.0% - 15.5% ] 15.37% | 1,574 | 60.7% |
[ 15.5% - 16.0% ] 15.95% | 4,665 | 67.0% |
[ 16.5% - 17.0% ] 16.55% | 18,037 | 50.2% |
[ 16.5% - 17.0% ] 16.89% | 14,782 | 52.3% |
[ 17.0% - 17.5% ] 17.35% | 7,872 | 60.3% |
[ 17.5% - 18.0% ] 17.78% | 9,509 | 46.9% |
[ 18.0% - 18.5% ] 18.28% | 9,254 | 62.2% |
[ 18.5% - 19.0% ] 18.83% | 531 | 64.8% |
[ 19.0% - 19.5% ] 19.45% | 45,587 | 59.6% |
[ 19.5% - 20.0% ] 19.93% | 3,869 | 62.4% |
[ 20.0% - 20.5% ] 20.36% | 7,885 | 59.6% |
[ 20.5% - 21.0% ] 20.65% | 3,002 | 64.7% |
[ 21.0% - 21.5% ] 21.45% | 1,478 | 64.7% |
[ 21.5% - 22.0% ] 21.75% | 11,047 | 57.9% |
[ 22.0% - 22.5% ] 22.49% | 867 | 64.6% |
[ 22.5% - 23.0% ] 22.95% | 4,021 | 61.0% |
[ 23.0% - 23.5% ] 23.37% | 2,045 | 60.1% |
[ 23.5% - 24.0% ] 23.84% | 453 | 54.1% |
[ 24.0% - 24.5% ] 24.32% | 2,344 | 83.0% |
[ 25.0% - 25.5% ] 25.01% | 3,327 | 58.9% |
[ 25.5% - 26.0% ] 25.68% | 296 | 59.3% |
[ 26.0% - 26.5% ] 26.46% | 223 | 63.4% |
[ 26.5% - 27.0% ] 26.83% | 2,602 | 62.9% |
[ 27.0% - 27.5% ] 27.23% | 1,998 | 74.7% |
[ 27.5% - 28.0% ] 27.75% | 2,115 | 61.2% |
[ 28.0% - 28.5% ] 28.32% | 1,077 | 70.2% |
[ 28.5% - 29.0% ] 28.95% | 38 | 53.8% |
[ 29.0% - 29.5% ] 29.15% | 1,187 | 56.5% |
[ 29.5% - 30.0% ] 29.70% | 101 | 53.8% |
[ 30.0% - 30.5% ] 30.18% | 1,196 | 61.2% |
[ 30.5% - 31.0% ] 30.77% | 234 | 79.5% |
[ 32.0% - 32.5% ] 32.21% | 447 | 48.9% |
[ 32.5% - 33.0% ] 32.53% | 621 | 53.0% |
[ 33.0% - 33.5% ] 33.33% | 99 | 43.9% |
[ 34.5% - 35.0% ] 34.75% | 141 | 64.2% |
[ 35.0% - 35.5% ] 35.21% | 71 | 61.3% |
[ 35.5% - 36.0% ] 35.58% | 579 | 52.3% |
[ 36.0% - 36.5% ] 36.03% | 136 | 54.5% |
[ 36.5% - 37.0% ] 36.54% | 156 | 62.9% |
[ 37.0% - 37.5% ] 37.50% | 40 | 81.2% |
[ 37.5% - 38.0% ] 38.00% | 350 | 56.6% |
[ 43.0% - 43.5% ] 43.42% | 76 | 61.3% |
[ 45.0% - 45.5% ] 45.40% | 1,240 | 78.4% |
[ 71.0% - 71.5% ] 71.11% | 90 | 76.9% |
[ 75.0% - 75.5% ] 75.03% | 4,298 | 52.4% |
[ 79.5% - 80.0% ] 79.76% | 573 | 69.4% |
[ 80.0% - 80.5% ] 80.35% | 514 | 80.4% |
[ 96.5% - 97.0% ] 96.55% | 319 | 34.2% |
[ 98.0% - 98.5% ] 98.14% | 376 | 46.4% |