Choctaw Unemployment Among Women with Children Ages 6 to 17 years

COMPARE

Choctaw
Race
Ancestry
AfghanAfricanAlaska NativeAlaskan AthabascanAlbanianAleutAlsatianAmericanApacheArabArapahoArgentineanArmenianAssyrian/Chaldean/SyriacAustralianAustrianBahamianBangladeshiBarbadianBasqueBelgianBelizeanBermudanBhutaneseBlackfeetBolivianBrazilianBritishBritish West IndianBulgarianBurmeseCajunCambodianCanadianCape VerdeanCarpatho RusynCelticCentral AmericanCentral American IndianCherokeeCheyenneChickasawChileanChineseChippewaChoctawColombianColvilleComancheCosta RicanCreeCreekCroatianCrowCubanCypriotCzechCzechoslovakianDanishDelawareDominicanDutchDutch West IndianEastern EuropeanEcuadorianEgyptianEnglishEstonianEthiopianEuropeanFijianFilipinoFinnishFrenchFrench American IndianFrench CanadianGermanGerman RussianGhanaianGreekGuamanian/ChamorroGuatemalanGuyaneseHaitianHmongHonduranHopiHoumaHungarianIcelanderIndian (Asian)IndonesianInupiatIranianIraqiIrishIroquoisIsraeliItalianJamaicanJapaneseJordanianKenyanKiowaKoreanLaotianLatvianLebaneseLiberianLithuanianLumbeeLuxembourgerMacedonianMalaysianMalteseMarshalleseMenomineeMexicanMexican American IndianMongolianMoroccanNative HawaiianNavajoNepaleseNew ZealanderNicaraguanNigerianNorthern EuropeanNorwegianOkinawanOsageOttawaPaiutePakistaniPalestinianPanamanianParaguayanPennsylvania GermanPeruvianPimaPolishPortuguesePotawatomiPuebloPuerto RicanPuget Sound SalishRomanianRussianSalvadoranSamoanScandinavianScotch-IrishScottishSeminoleSenegaleseSerbianShoshoneSierra LeoneanSiouxSlavicSlovakSloveneSomaliSouth AfricanSouth AmericanSouth American IndianSoviet UnionSpaniardSpanishSpanish AmericanSpanish American IndianSri LankanSubsaharan AfricanSudaneseSwedishSwissSyrianTaiwaneseThaiTlingit-HaidaTohono O'OdhamTonganTrinidadian and TobagonianTsimshianTurkishU.S. Virgin IslanderUgandanUkrainianUruguayanUteVenezuelanVietnameseWelshWest IndianYakamaYaquiYugoslavianYumanYup'ikZimbabwean
Immigration
NonimmigrantsImmigrantsAfghanistanAfricaAlbaniaArgentinaArmeniaAsiaAustraliaAustriaBahamasBangladeshBarbadosBelarusBelgiumBelizeBoliviaBosnia and HerzegovinaBrazilBulgariaBurma/MyanmarCabo VerdeCambodiaCameroonCanadaCaribbeanCentral AmericaChileChinaColombiaCongoCosta RicaCroatiaCubaCzechoslovakiaDenmarkDominicaDominican RepublicEastern AfricaEastern AsiaEastern EuropeEcuadorEgyptEl SalvadorEnglandEritreaEthiopiaEuropeFijiFranceGermanyGhanaGreeceGrenadaGuatemalaGuyanaHaitiHondurasHong KongHungaryIndiaIndonesiaIranIraqIrelandIsraelItalyJamaicaJapanJordanKazakhstanKenyaKoreaKuwaitLaosLatin AmericaLatviaLebanonLiberiaLithuaniaMalaysiaMexicoMicronesiaMiddle AfricaMoldovaMoroccoNepalNetherlandsNicaraguaNigeriaNorth AmericaNorth MacedoniaNorthern AfricaNorthern EuropeNorwayOceaniaPakistanPanamaPeruPhilippinesPolandPortugalRomaniaRussiaSaudi ArabiaScotlandSenegalSerbiaSierra LeoneSingaporeSomaliaSouth AfricaSouth AmericaSouth Central AsiaSouth Eastern AsiaSouthern EuropeSpainSri LankaSt. Vincent and the GrenadinesSudanSwedenSwitzerlandSyriaTaiwanThailandTrinidad and TobagoTurkeyUgandaUkraineUruguayUzbekistanVenezuelaVietnamWest IndiesWestern AfricaWestern AsiaWestern EuropeYemenZaireZimbabweAzores
Select to Compare
Race
Ancestry
AfghanAfricanAlaska NativeAlaskan AthabascanAlbanianAleutAlsatianAmericanApacheArabArapahoArgentineanArmenianAssyrian/Chaldean/SyriacAustralianAustrianBahamianBangladeshiBarbadianBasqueBelgianBelizeanBermudanBhutaneseBlackfeetBolivianBrazilianBritishBritish West IndianBulgarianBurmeseCajunCambodianCanadianCape VerdeanCarpatho RusynCelticCentral AmericanCentral American IndianCherokeeCheyenneChickasawChileanChineseChippewaColombianColvilleComancheCosta RicanCreeCreekCroatianCrowCubanCypriotCzechCzechoslovakianDanishDelawareDominicanDutchDutch West IndianEastern EuropeanEcuadorianEgyptianEnglishEstonianEthiopianEuropeanFijianFilipinoFinnishFrenchFrench American IndianFrench CanadianGermanGerman RussianGhanaianGreekGuamanian/ChamorroGuatemalanGuyaneseHaitianHmongHonduranHopiHoumaHungarianIcelanderIndian (Asian)IndonesianInupiatIranianIraqiIrishIroquoisIsraeliItalianJamaicanJapaneseJordanianKenyanKiowaKoreanLaotianLatvianLebaneseLiberianLithuanianLumbeeLuxembourgerMacedonianMalaysianMalteseMarshalleseMenomineeMexicanMexican American IndianMongolianMoroccanNative HawaiianNavajoNepaleseNew ZealanderNicaraguanNigerianNorthern EuropeanNorwegianOkinawanOsageOttawaPaiutePakistaniPalestinianPanamanianParaguayanPennsylvania GermanPeruvianPimaPolishPortuguesePotawatomiPuebloPuerto RicanPuget Sound SalishRomanianRussianSalvadoranSamoanScandinavianScotch-IrishScottishSeminoleSenegaleseSerbianShoshoneSierra LeoneanSiouxSlavicSlovakSloveneSomaliSouth AfricanSouth AmericanSouth American IndianSoviet UnionSpaniardSpanishSpanish AmericanSpanish American IndianSri LankanSubsaharan AfricanSudaneseSwedishSwissSyrianTaiwaneseThaiTlingit-HaidaTohono O'OdhamTonganTrinidadian and TobagonianTsimshianTurkishU.S. Virgin IslanderUgandanUkrainianUruguayanUteVenezuelanVietnameseWelshWest IndianYakamaYaquiYugoslavianYumanYup'ikZimbabwean
Immigration
NonimmigrantsImmigrantsAfghanistanAfricaAlbaniaArgentinaArmeniaAsiaAustraliaAustriaBahamasBangladeshBarbadosBelarusBelgiumBelizeBoliviaBosnia and HerzegovinaBrazilBulgariaBurma/MyanmarCabo VerdeCambodiaCameroonCanadaCaribbeanCentral AmericaChileChinaColombiaCongoCosta RicaCroatiaCubaCzechoslovakiaDenmarkDominicaDominican RepublicEastern AfricaEastern AsiaEastern EuropeEcuadorEgyptEl SalvadorEnglandEritreaEthiopiaEuropeFijiFranceGermanyGhanaGreeceGrenadaGuatemalaGuyanaHaitiHondurasHong KongHungaryIndiaIndonesiaIranIraqIrelandIsraelItalyJamaicaJapanJordanKazakhstanKenyaKoreaKuwaitLaosLatin AmericaLatviaLebanonLiberiaLithuaniaMalaysiaMexicoMicronesiaMiddle AfricaMoldovaMoroccoNepalNetherlandsNicaraguaNigeriaNorth AmericaNorth MacedoniaNorthern AfricaNorthern EuropeNorwayOceaniaPakistanPanamaPeruPhilippinesPolandPortugalRomaniaRussiaSaudi ArabiaScotlandSenegalSerbiaSierra LeoneSingaporeSomaliaSouth AfricaSouth AmericaSouth Central AsiaSouth Eastern AsiaSouthern EuropeSpainSri LankaSt. Vincent and the GrenadinesSudanSwedenSwitzerlandSyriaTaiwanThailandTrinidad and TobagoTurkeyUgandaUkraineUruguayUzbekistanVenezuelaVietnamWest IndiesWestern AfricaWestern AsiaWestern EuropeYemenZaireZimbabweAzores
Unemployment Among Women with Children Ages 6 to 17 years
Income
Poverty
Unemployment
Labor Participation
Family Structure
Vehicle Availability
Education Level
Disability

Choctaw Unemployment Among Women with Children Ages 6 to 17 years
Tragic

9.9%
UNEMPLOYMENT | WOMEN W/ CHILDREN 6 TO 17
0.0/ 100
METRIC RATING
286th/ 347
METRIC RANK

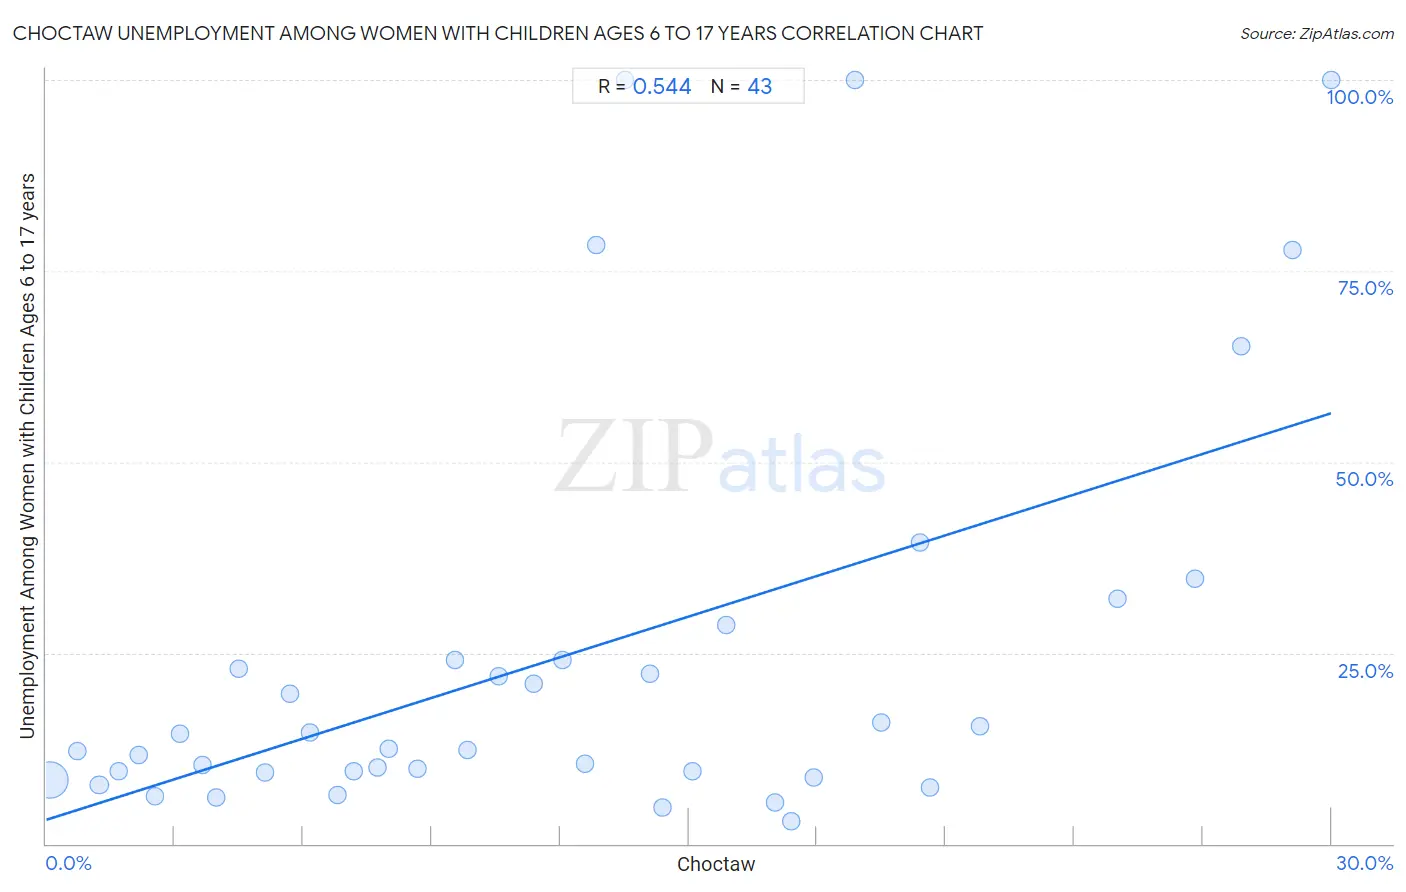
Choctaw Unemployment Among Women with Children Ages 6 to 17 years Correlation Chart

The statistical analysis conducted on geographies consisting of 208,938,346 people shows a substantial positive correlation between the proportion of Choctaw and unemployment rate among women with children between the ages 6 and 17 in the United States with a correlation coefficient (R) of 0.544 and weighted average of 9.9%. On average, for every 1% (one percent) increase in Choctaw within a typical geography, there is an increase of 1.8% in unemployment rate among women with children between the ages 6 and 17.
Choctaw Unemployment Among Women with Children Ages 6 to 17 years
It is essential to understand that the correlation between the percentage of Choctaw and unemployment rate among women with children between the ages 6 and 17 does not imply a direct cause-and-effect relationship. It remains uncertain whether the presence of Choctaw influences an upward or downward trend in the level of unemployment rate among women with children between the ages 6 and 17 within an area, or if Choctaw simply ended up residing in those areas with higher or lower levels of unemployment rate among women with children between the ages 6 and 17 due to other factors.

Demographics Similar to Choctaw by Unemployment Among Women with Children Ages 6 to 17 years

In terms of unemployment among women with children ages 6 to 17 years, the demographic groups most similar to Choctaw are Sierra Leonean (9.9%, a difference of 0.050%), Hispanic or Latino (9.9%, a difference of 0.12%), Shoshone (10.0%, a difference of 0.29%), Yakama (9.9%, a difference of 0.43%), and Central American Indian (9.9%, a difference of 0.58%).
DemographicsRating | RankUnemployment Among Women with Children Ages 6 to 17 years
Scotch-Irish
0.1
/100
|
#279
Tragic
9.7%
Seminole
0.1
/100
|
#280
Tragic
9.7%
Jamaicans
0.0
/100
|
#281
Tragic
9.8%
Slovaks
0.0
/100
|
#282
Tragic
9.8%
Central American Indians
0.0
/100
|
#283
Tragic
9.9%
Yakama
0.0
/100
|
#284
Tragic
9.9%
Hispanics or Latinos
0.0
/100
|
#285
Tragic
9.9%
Choctaw
0.0
/100
|
#286
Tragic
9.9%
Sierra Leoneans
0.0
/100
|
#287
Tragic
9.9%
Shoshone
0.0
/100
|
#288
Tragic
10.0%
Hondurans
0.0
/100
|
#289
Tragic
10.0%
Sub-Saharan Africans
0.0
/100
|
#290
Tragic
10.0%
Nonimmigrants
0.0
/100
|
#291
Tragic
10.0%
Carpatho Rusyns
0.0
/100
|
#292
Tragic
10.0%
Haitians
0.0
/100
|
#293
Tragic
10.0%

Choctaw Unemployment Among Women with Children Ages 6 to 17 years Correlation Summary

MeasurementChoctaw DataUnemployment Among Women with Children Ages 6 to 17 years Data
Minimum0.074%2.9%
Maximum30.0%100.0%
Range29.9%97.1%
Mean12.2%24.7%
Median11.4%12.5%
Interquartile 25% (IQ1)5.1%9.3%
Interquartile 75% (IQ3)17.9%24.1%
Interquartile Range (IQR)12.8%14.7%
Standard Deviation (Sample)8.3%27.1%
Standard Deviation (Population)8.2%26.8%

Correlation Details

Choctaw PercentileSample SizeUnemployment Among Women with Children Ages 6 to 17 years
[
0.0%
-
0.5%
]
0.074%
201,674,1598.3%
[
0.5%
-
1.0%
]
0.73%
3,455,99012.1%
[
1.0%
-
1.5%
]
1.24%
1,824,9387.7%
[
1.5%
-
2.0%
]
1.69%
887,0099.5%
[
2.0%
-
2.5%
]
2.15%
317,47111.6%
[
2.5%
-
3.0%
]
2.55%
267,6296.2%
[
3.0%
-
3.5%
]
3.13%
106,51714.5%
[
3.5%
-
4.0%
]
3.65%
62,35110.4%
[
3.5%
-
4.0%
]
3.97%
31,1216.0%
[
4.0%
-
4.5%
]
4.50%
18,16222.9%
[
5.0%
-
5.5%
]
5.11%
10,7289.3%
[
5.5%
-
6.0%
]
5.68%
1,91819.6%
[
6.0%
-
6.5%
]
6.16%
8,51114.6%
[
6.5%
-
7.0%
]
6.81%
36,3246.4%
[
7.0%
-
7.5%
]
7.19%
26,0419.5%
[
7.5%
-
8.0%
]
7.74%
8,73110.0%
[
8.0%
-
8.5%
]
8.00%
91212.5%
[
8.5%
-
9.0%
]
8.65%
6,7149.8%
[
9.5%
-
10.0%
]
9.54%
1,12224.1%
[
9.5%
-
10.0%
]
9.85%
9,19112.3%
[
10.5%
-
11.0%
]
10.56%
9,07321.9%
[
11.0%
-
11.5%
]
11.39%
13,88521.0%
[
12.0%
-
12.5%
]
12.05%
50,25724.1%
[
12.5%
-
13.0%
]
12.57%
3,82010.5%
[
12.5%
-
13.0%
]
12.83%
3,00178.4%
[
13.0%
-
13.5%
]
13.50%
363100.0%
[
14.0%
-
14.5%
]
14.10%
46822.2%
[
14.0%
-
14.5%
]
14.39%
26,1584.8%
[
15.0%
-
15.5%
]
15.08%
21,3299.6%
[
15.5%
-
16.0%
]
15.88%
51028.6%
[
17.0%
-
17.5%
]
17.02%
3,3905.4%
[
17.0%
-
17.5%
]
17.39%
5,6012.9%
[
17.5%
-
18.0%
]
17.92%
1,9988.6%
[
18.5%
-
19.0%
]
18.88%
143100.0%
[
19.0%
-
19.5%
]
19.49%
31,29215.9%
[
20.0%
-
20.5%
]
20.39%
1,92739.4%
[
20.5%
-
21.0%
]
20.63%
1,5227.4%
[
21.5%
-
22.0%
]
21.79%
43615.4%
[
25.0%
-
25.5%
]
25.01%
3,32732.0%
[
26.5%
-
27.0%
]
26.83%
2,60234.6%
[
27.5%
-
28.0%
]
27.89%
1,01165.2%
[
29.0%
-
29.5%
]
29.09%
57477.8%
[
30.0%
-
30.5%
]
30.00%
120100.0%