Princeton, WV Map & Demographics
Princeton Map
Princeton Overview
$24,735
PER CAPITA INCOME
$51,646
AVG FAMILY INCOME
$41,782
AVG HOUSEHOLD INCOME
38.4%
WAGE / INCOME GAP [ % ]
61.6¢/ $1
WAGE / INCOME GAP [ $ ]
0.41
INEQUALITY / GINI INDEX
5,833
TOTAL POPULATION
2,880
MALE POPULATION
2,953
FEMALE POPULATION
97.53
MALES / 100 FEMALES
102.53
FEMALES / 100 MALES
44.3
MEDIAN AGE
2.8
AVG FAMILY SIZE
2.2
AVG HOUSEHOLD SIZE
2,555
LABOR FORCE [ PEOPLE ]
52.5%
PERCENT IN LABOR FORCE
5.2%
UNEMPLOYMENT RATE
Princeton Area Codes
Income in Princeton
Income Overview in Princeton
Per Capita Income in Princeton is $24,735, while median incomes of families and households are $51,646 and $41,782 respectively.
| Characteristic | Number | Measure |
| Per Capita Income | 5,833 | $24,735 |
| Median Family Income | 1,577 | $51,646 |
| Mean Family Income | 1,577 | $63,457 |
| Median Household Income | 2,680 | $41,782 |
| Mean Household Income | 2,680 | $52,749 |
| Income Deficit | 1,577 | $0 |
| Wage / Income Gap (%) | 5,833 | 38.40% |
| Wage / Income Gap ($) | 5,833 | 61.60¢ per $1 |
| Gini / Inequality Index | 5,833 | 0.41 |
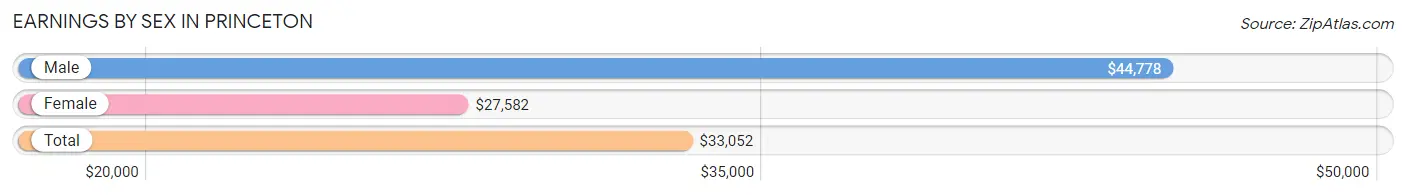
Earnings by Sex in Princeton
Average Earnings in Princeton are $33,052, $44,778 for men and $27,582 for women, a difference of 38.4%.
| Sex | Number | Average Earnings |
| Male | 1,281 (48.8%) | $44,778 |
| Female | 1,343 (51.2%) | $27,582 |
| Total | 2,624 (100.0%) | $33,052 |
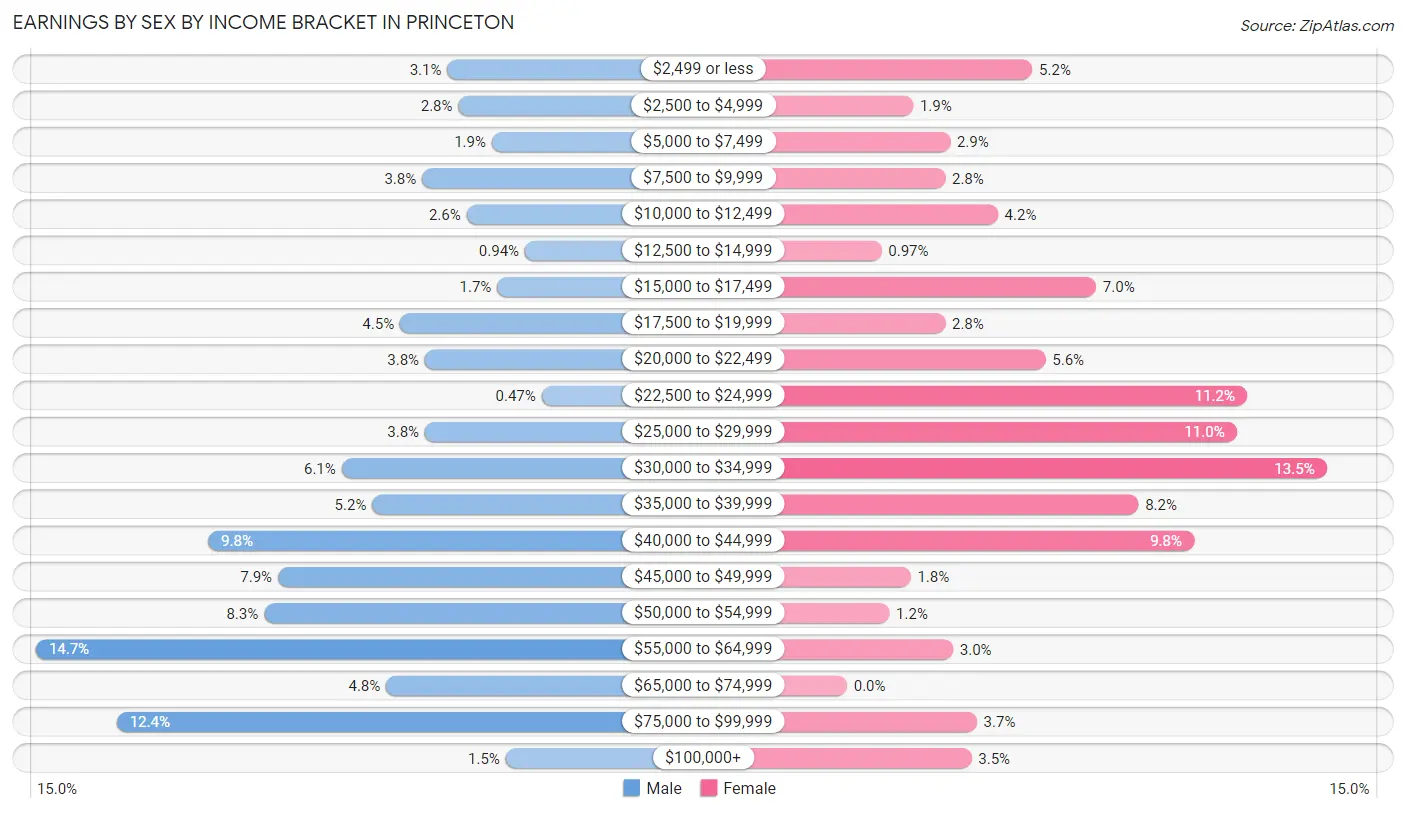
Earnings by Sex by Income Bracket in Princeton
The most common earnings brackets in Princeton are $55,000 to $64,999 for men (188 | 14.7%) and $30,000 to $34,999 for women (181 | 13.5%).
| Income | Male | Female |
| $2,499 or less | 40 (3.1%) | 70 (5.2%) |
| $2,500 to $4,999 | 36 (2.8%) | 25 (1.9%) |
| $5,000 to $7,499 | 24 (1.9%) | 39 (2.9%) |
| $7,500 to $9,999 | 49 (3.8%) | 37 (2.8%) |
| $10,000 to $12,499 | 33 (2.6%) | 57 (4.2%) |
| $12,500 to $14,999 | 12 (0.9%) | 13 (1.0%) |
| $15,000 to $17,499 | 22 (1.7%) | 94 (7.0%) |
| $17,500 to $19,999 | 57 (4.4%) | 37 (2.8%) |
| $20,000 to $22,499 | 48 (3.7%) | 75 (5.6%) |
| $22,500 to $24,999 | 6 (0.5%) | 151 (11.2%) |
| $25,000 to $29,999 | 48 (3.7%) | 147 (11.0%) |
| $30,000 to $34,999 | 78 (6.1%) | 181 (13.5%) |
| $35,000 to $39,999 | 67 (5.2%) | 110 (8.2%) |
| $40,000 to $44,999 | 126 (9.8%) | 131 (9.8%) |
| $45,000 to $49,999 | 101 (7.9%) | 24 (1.8%) |
| $50,000 to $54,999 | 106 (8.3%) | 16 (1.2%) |
| $55,000 to $64,999 | 188 (14.7%) | 40 (3.0%) |
| $65,000 to $74,999 | 62 (4.8%) | 0 (0.0%) |
| $75,000 to $99,999 | 159 (12.4%) | 49 (3.6%) |
| $100,000+ | 19 (1.5%) | 47 (3.5%) |
| Total | 1,281 (100.0%) | 1,343 (100.0%) |
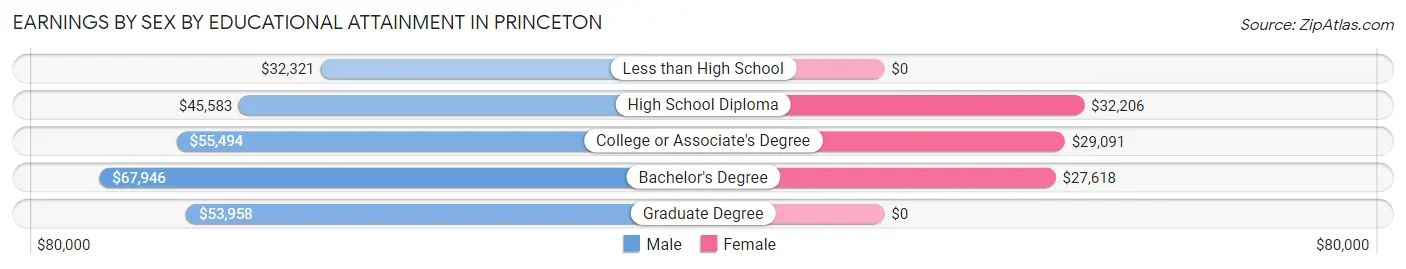
Earnings by Sex by Educational Attainment in Princeton
Average earnings in Princeton are $46,991 for men and $30,238 for women, a difference of 35.6%. Men with an educational attainment of bachelor's degree enjoy the highest average annual earnings of $67,946, while those with less than high school education earn the least with $32,321. Women with an educational attainment of high school diploma earn the most with the average annual earnings of $32,206, while those with bachelor's degree education have the smallest earnings of $27,618.
| Educational Attainment | Male Income | Female Income |
| Less than High School | $32,321 | $0 |
| High School Diploma | $45,583 | $32,206 |
| College or Associate's Degree | $55,494 | $29,091 |
| Bachelor's Degree | $67,946 | $27,618 |
| Graduate Degree | $53,958 | $0 |
| Total | $46,991 | $30,238 |
Family Income in Princeton
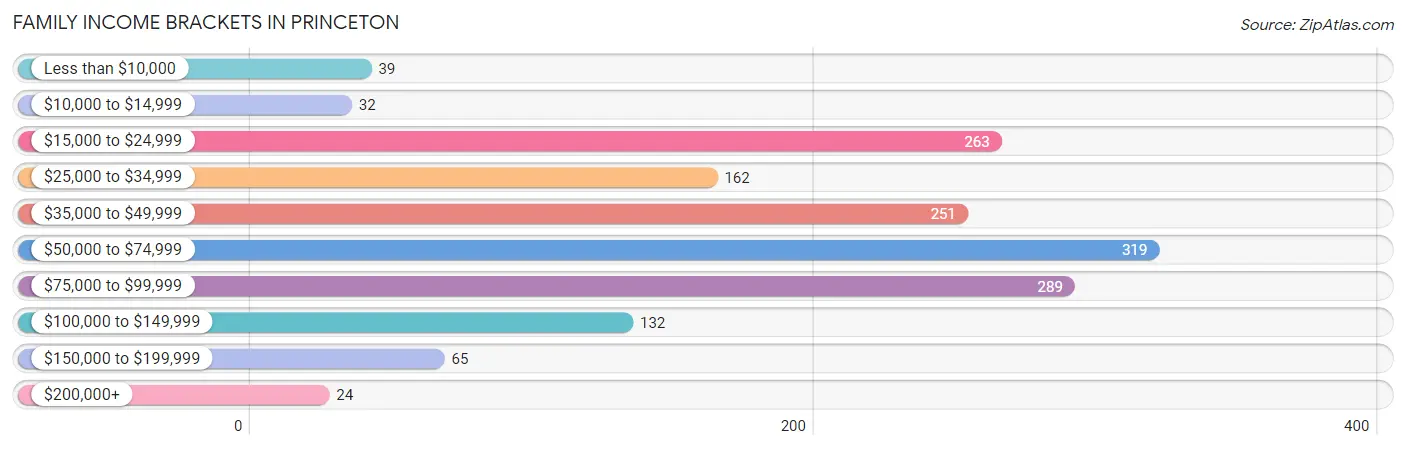
Family Income Brackets in Princeton
According to the Princeton family income data, there are 319 families falling into the $50,000 to $74,999 income range, which is the most common income bracket and makes up 20.2% of all families. Conversely, the $200,000+ income bracket is the least frequent group with only 24 families (1.5%) belonging to this category.
| Income Bracket | # Families | % Families |
| Less than $10,000 | 39 | 2.5% |
| $10,000 to $14,999 | 32 | 2.0% |
| $15,000 to $24,999 | 263 | 16.7% |
| $25,000 to $34,999 | 162 | 10.3% |
| $35,000 to $49,999 | 251 | 15.9% |
| $50,000 to $74,999 | 319 | 20.2% |
| $75,000 to $99,999 | 289 | 18.3% |
| $100,000 to $149,999 | 132 | 8.4% |
| $150,000 to $199,999 | 65 | 4.1% |
| $200,000+ | 24 | 1.5% |
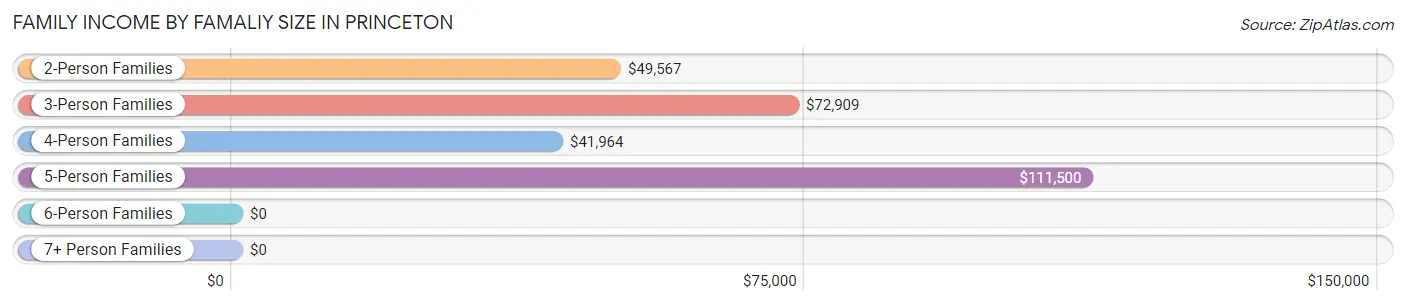
Family Income by Famaliy Size in Princeton
5-person families (108 | 6.9%) account for the highest median family income in Princeton with $111,500 per family, while 2-person families (917 | 58.2%) have the highest median income of $24,784 per family member.
| Income Bracket | # Families | Median Income |
| 2-Person Families | 917 (58.2%) | $49,567 |
| 3-Person Families | 293 (18.6%) | $72,909 |
| 4-Person Families | 235 (14.9%) | $41,964 |
| 5-Person Families | 108 (6.9%) | $111,500 |
| 6-Person Families | 4 (0.3%) | $0 |
| 7+ Person Families | 20 (1.3%) | $0 |
| Total | 1,577 (100.0%) | $51,646 |
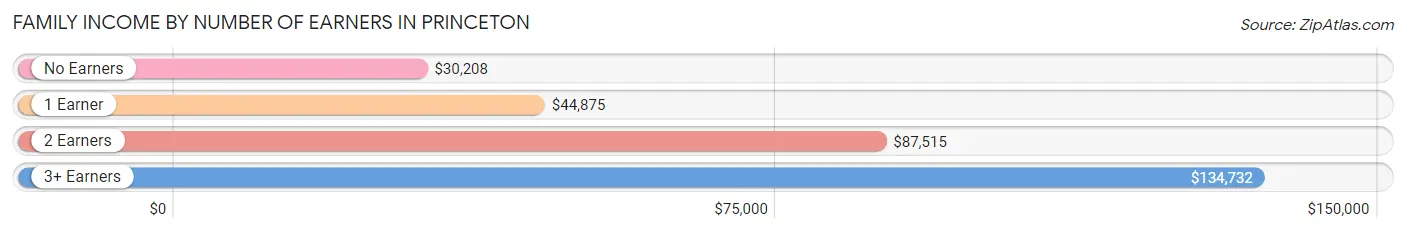
Family Income by Number of Earners in Princeton
The median family income in Princeton is $51,646, with families comprising 3+ earners (103) having the highest median family income of $134,732, while families with no earners (414) have the lowest median family income of $30,208, accounting for 6.5% and 26.3% of families, respectively.
| Number of Earners | # Families | Median Income |
| No Earners | 414 (26.3%) | $30,208 |
| 1 Earner | 591 (37.5%) | $44,875 |
| 2 Earners | 469 (29.7%) | $87,515 |
| 3+ Earners | 103 (6.5%) | $134,732 |
| Total | 1,577 (100.0%) | $51,646 |
Household Income in Princeton
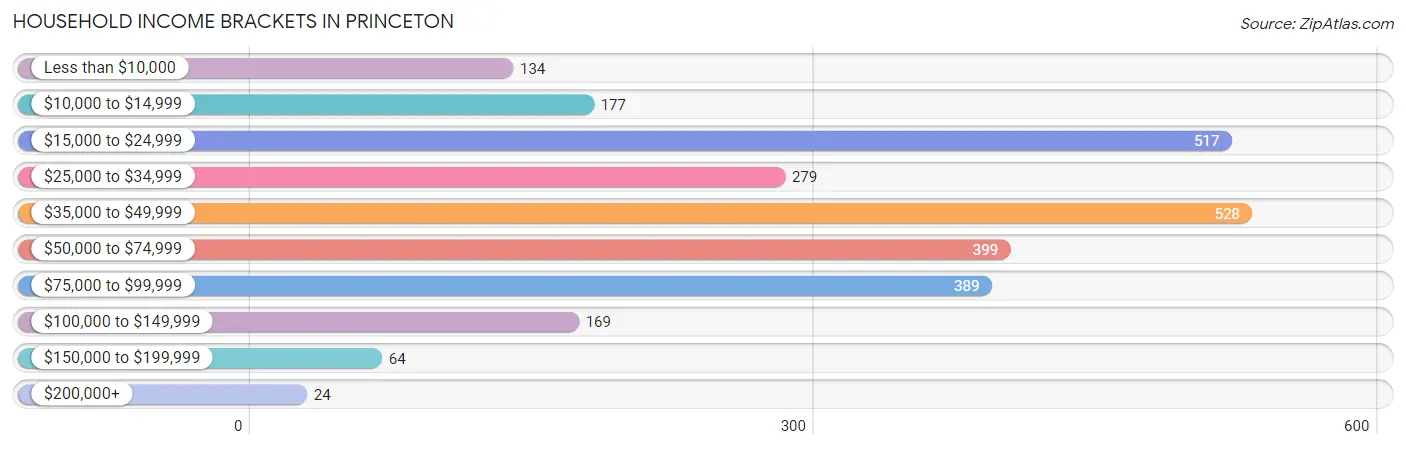
Household Income Brackets in Princeton
With 528 households falling in the category, the $35,000 to $49,999 income range is the most frequent in Princeton, accounting for 19.7% of all households. In contrast, only 24 households (0.9%) fall into the $200,000+ income bracket, making it the least populous group.
| Income Bracket | # Households | % Households |
| Less than $10,000 | 134 | 5.0% |
| $10,000 to $14,999 | 177 | 6.6% |
| $15,000 to $24,999 | 517 | 19.3% |
| $25,000 to $34,999 | 279 | 10.4% |
| $35,000 to $49,999 | 528 | 19.7% |
| $50,000 to $74,999 | 399 | 14.9% |
| $75,000 to $99,999 | 389 | 14.5% |
| $100,000 to $149,999 | 169 | 6.3% |
| $150,000 to $199,999 | 64 | 2.4% |
| $200,000+ | 24 | 0.9% |
Household Income by Householder Age in Princeton
The median household income in Princeton is $41,782, with the highest median household income of $58,542 found in the 45 to 64 years age bracket for the primary householder. A total of 727 households (27.1%) fall into this category. Meanwhile, the 15 to 24 years age bracket for the primary householder has the lowest median household income of $0, with 96 households (3.6%) in this group.
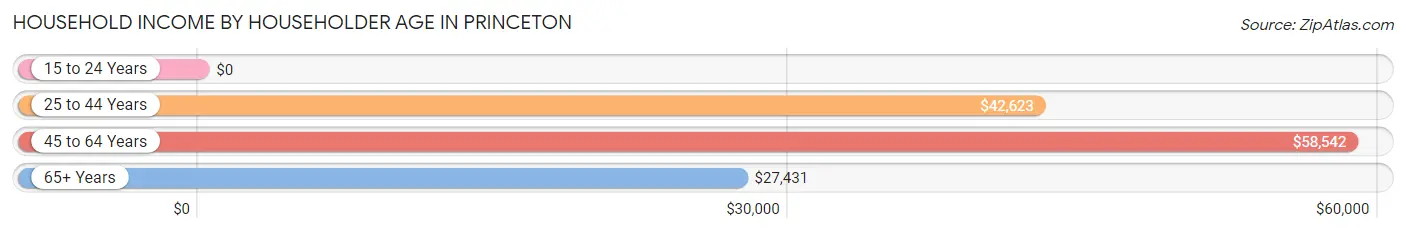
| Income Bracket | # Households | Median Income |
| 15 to 24 Years | 96 (3.6%) | $0 |
| 25 to 44 Years | 895 (33.4%) | $42,623 |
| 45 to 64 Years | 727 (27.1%) | $58,542 |
| 65+ Years | 962 (35.9%) | $27,431 |
| Total | 2,680 (100.0%) | $41,782 |
Poverty in Princeton
Income Below Poverty by Sex and Age in Princeton
With 15.1% poverty level for males and 22.5% for females among the residents of Princeton, 5 year old males and 12 to 14 year old females are the most vulnerable to poverty, with 20 males (100.0%) and 41 females (51.9%) in their respective age groups living below the poverty level.
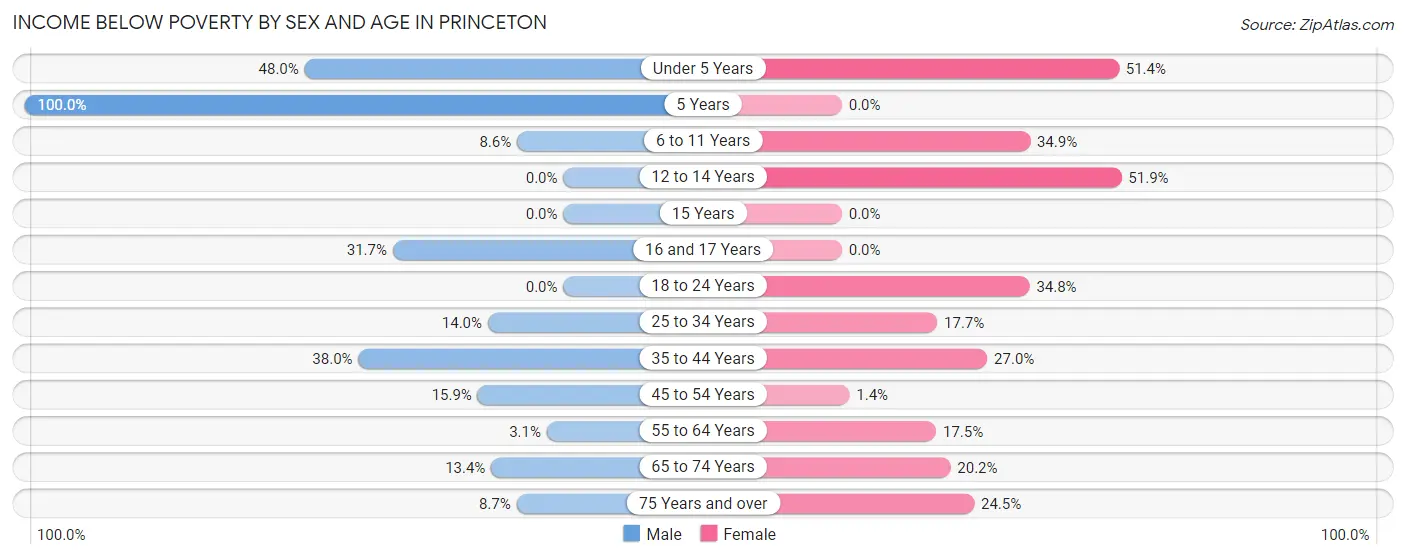
| Age Bracket | Male | Female |
| Under 5 Years | 73 (48.0%) | 91 (51.4%) |
| 5 Years | 20 (100.0%) | 0 (0.0%) |
| 6 to 11 Years | 28 (8.6%) | 51 (34.9%) |
| 12 to 14 Years | 0 (0.0%) | 41 (51.9%) |
| 15 Years | 0 (0.0%) | 0 (0.0%) |
| 16 and 17 Years | 25 (31.7%) | 0 (0.0%) |
| 18 to 24 Years | 0 (0.0%) | 93 (34.8%) |
| 25 to 34 Years | 58 (14.0%) | 81 (17.7%) |
| 35 to 44 Years | 70 (38.0%) | 102 (27.0%) |
| 45 to 54 Years | 62 (15.9%) | 6 (1.4%) |
| 55 to 64 Years | 9 (3.1%) | 49 (17.5%) |
| 65 to 74 Years | 58 (13.4%) | 82 (20.2%) |
| 75 Years and over | 31 (8.7%) | 67 (24.5%) |
| Total | 434 (15.1%) | 663 (22.5%) |
Income Above Poverty by Sex and Age in Princeton
According to the poverty statistics in Princeton, males aged 12 to 14 years and females aged 15 years are the age groups that are most secure financially, with 100.0% of males and 100.0% of females in these age groups living above the poverty line.
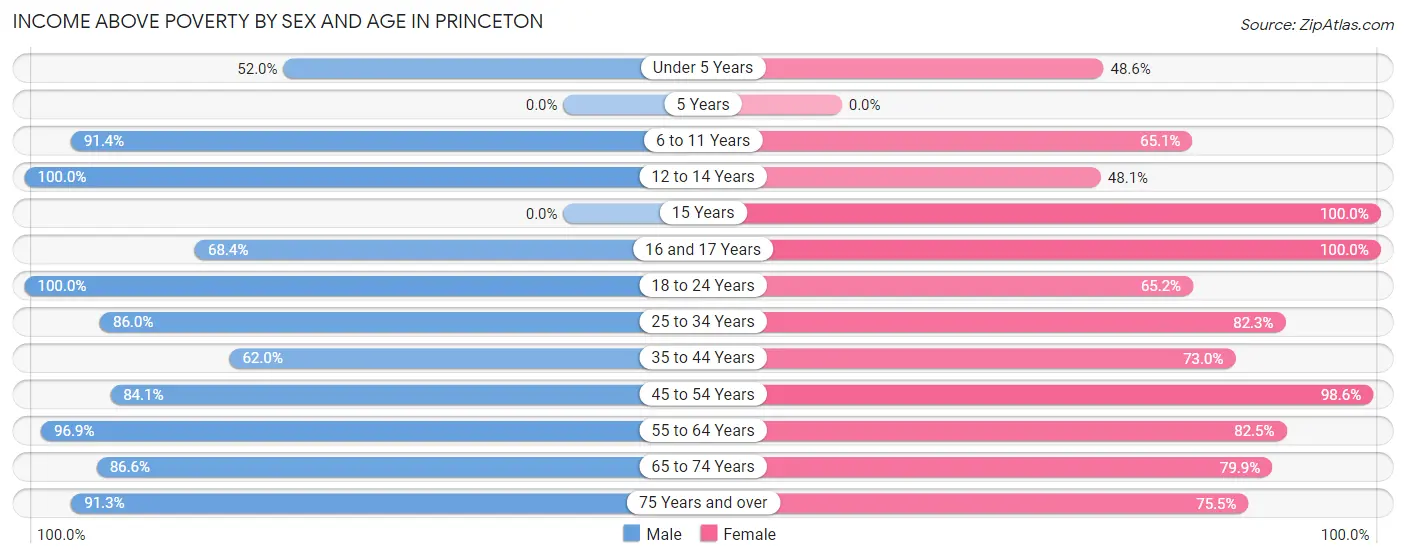
| Age Bracket | Male | Female |
| Under 5 Years | 79 (52.0%) | 86 (48.6%) |
| 5 Years | 0 (0.0%) | 0 (0.0%) |
| 6 to 11 Years | 298 (91.4%) | 95 (65.1%) |
| 12 to 14 Years | 7 (100.0%) | 38 (48.1%) |
| 15 Years | 0 (0.0%) | 40 (100.0%) |
| 16 and 17 Years | 54 (68.3%) | 13 (100.0%) |
| 18 to 24 Years | 212 (100.0%) | 174 (65.2%) |
| 25 to 34 Years | 356 (86.0%) | 377 (82.3%) |
| 35 to 44 Years | 114 (62.0%) | 276 (73.0%) |
| 45 to 54 Years | 328 (84.1%) | 421 (98.6%) |
| 55 to 64 Years | 284 (96.9%) | 231 (82.5%) |
| 65 to 74 Years | 375 (86.6%) | 325 (79.8%) |
| 75 Years and over | 326 (91.3%) | 206 (75.5%) |
| Total | 2,433 (84.9%) | 2,282 (77.5%) |
Income Below Poverty Among Married-Couple Families in Princeton
The poverty statistics for married-couple families in Princeton show that 10.4% or 99 of the total 948 families live below the poverty line. Families with 1 or 2 children have the highest poverty rate of 25.5%, comprising of 76 families. On the other hand, families with 3 or 4 children have the lowest poverty rate of 0.0%, which includes 0 families.
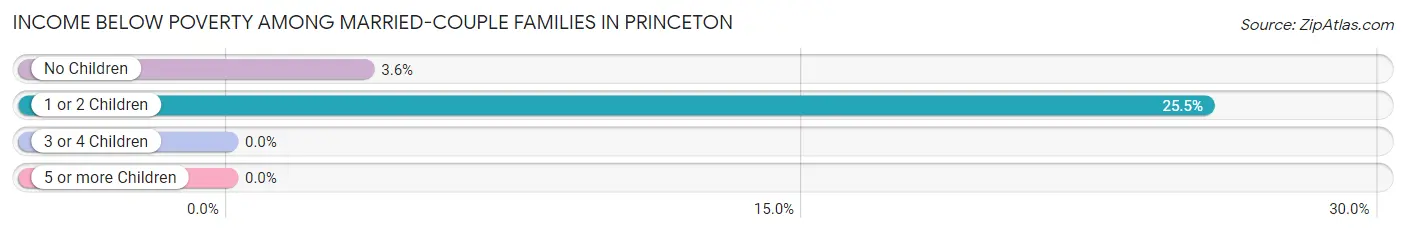
| Children | Above Poverty | Below Poverty |
| No Children | 623 (96.4%) | 23 (3.6%) |
| 1 or 2 Children | 222 (74.5%) | 76 (25.5%) |
| 3 or 4 Children | 4 (100.0%) | 0 (0.0%) |
| 5 or more Children | 0 (0.0%) | 0 (0.0%) |
| Total | 849 (89.6%) | 99 (10.4%) |
Income Below Poverty Among Single-Parent Households in Princeton
According to the poverty data in Princeton, 17.6% or 36 single-father households and 17.0% or 72 single-mother households are living below the poverty line. Among single-father households, those with 3 or 4 children have the highest poverty rate, with 20 households (100.0%) experiencing poverty. Likewise, among single-mother households, those with no children have the highest poverty rate, with 32 households (23.7%) falling below the poverty line.
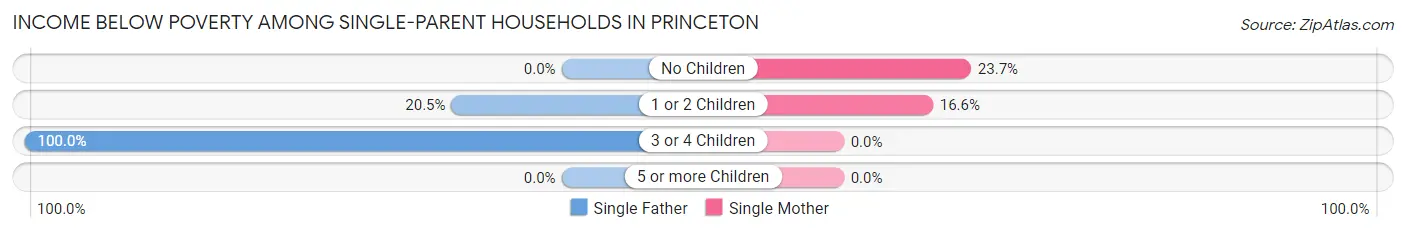
| Children | Single Father | Single Mother |
| No Children | 0 (0.0%) | 32 (23.7%) |
| 1 or 2 Children | 16 (20.5%) | 40 (16.6%) |
| 3 or 4 Children | 20 (100.0%) | 0 (0.0%) |
| 5 or more Children | 0 (0.0%) | 0 (0.0%) |
| Total | 36 (17.6%) | 72 (17.0%) |
Income Below Poverty Among Married-Couple vs Single-Parent Households in Princeton
The poverty data for Princeton shows that 99 of the married-couple family households (10.4%) and 108 of the single-parent households (17.2%) are living below the poverty level. Within the married-couple family households, those with 1 or 2 children have the highest poverty rate, with 76 households (25.5%) falling below the poverty line. Among the single-parent households, those with 3 or 4 children have the highest poverty rate, with 20 household (29.4%) living below poverty.
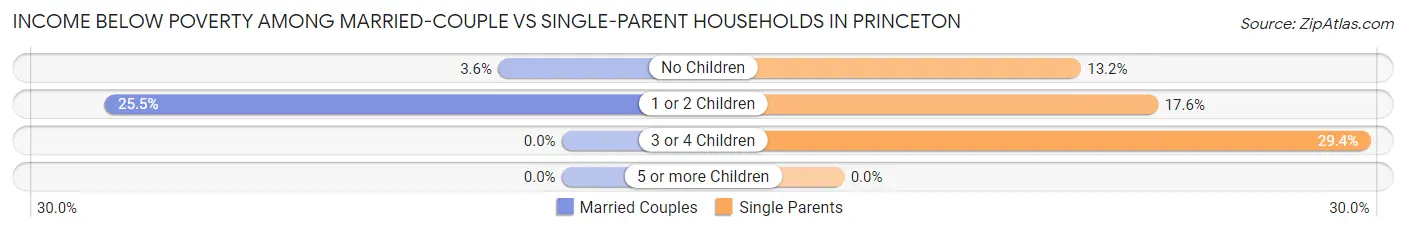
| Children | Married-Couple Families | Single-Parent Households |
| No Children | 23 (3.6%) | 32 (13.2%) |
| 1 or 2 Children | 76 (25.5%) | 56 (17.5%) |
| 3 or 4 Children | 0 (0.0%) | 20 (29.4%) |
| 5 or more Children | 0 (0.0%) | 0 (0.0%) |
| Total | 99 (10.4%) | 108 (17.2%) |
Race in Princeton
The most populous races in Princeton are White / Caucasian (5,244 | 89.9%), Black / African American (364 | 6.2%), and Two or more Races (196 | 3.4%).
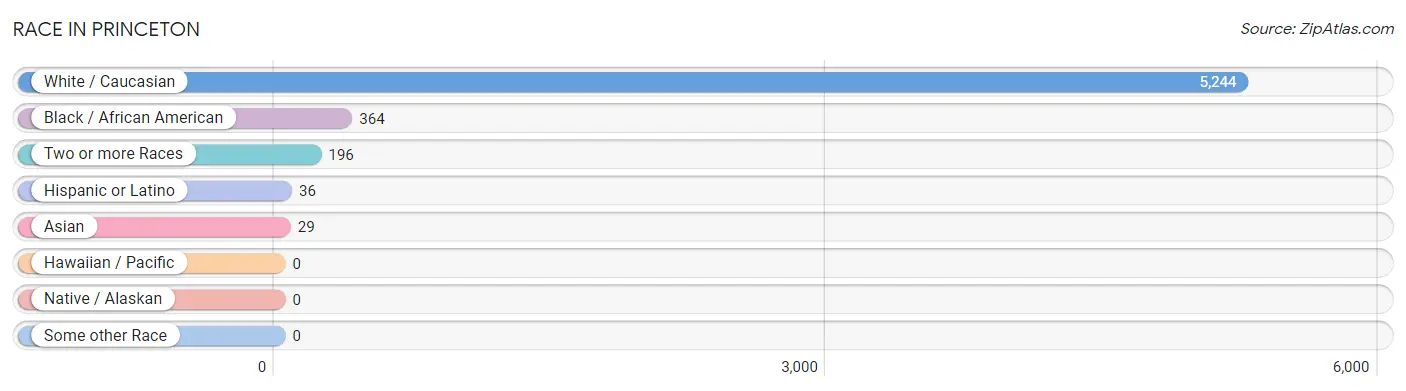
| Race | # Population | % Population |
| Asian | 29 | 0.5% |
| Black / African American | 364 | 6.2% |
| Hawaiian / Pacific | 0 | 0.0% |
| Hispanic or Latino | 36 | 0.6% |
| Native / Alaskan | 0 | 0.0% |
| White / Caucasian | 5,244 | 89.9% |
| Two or more Races | 196 | 3.4% |
| Some other Race | 0 | 0.0% |
| Total | 5,833 | 100.0% |
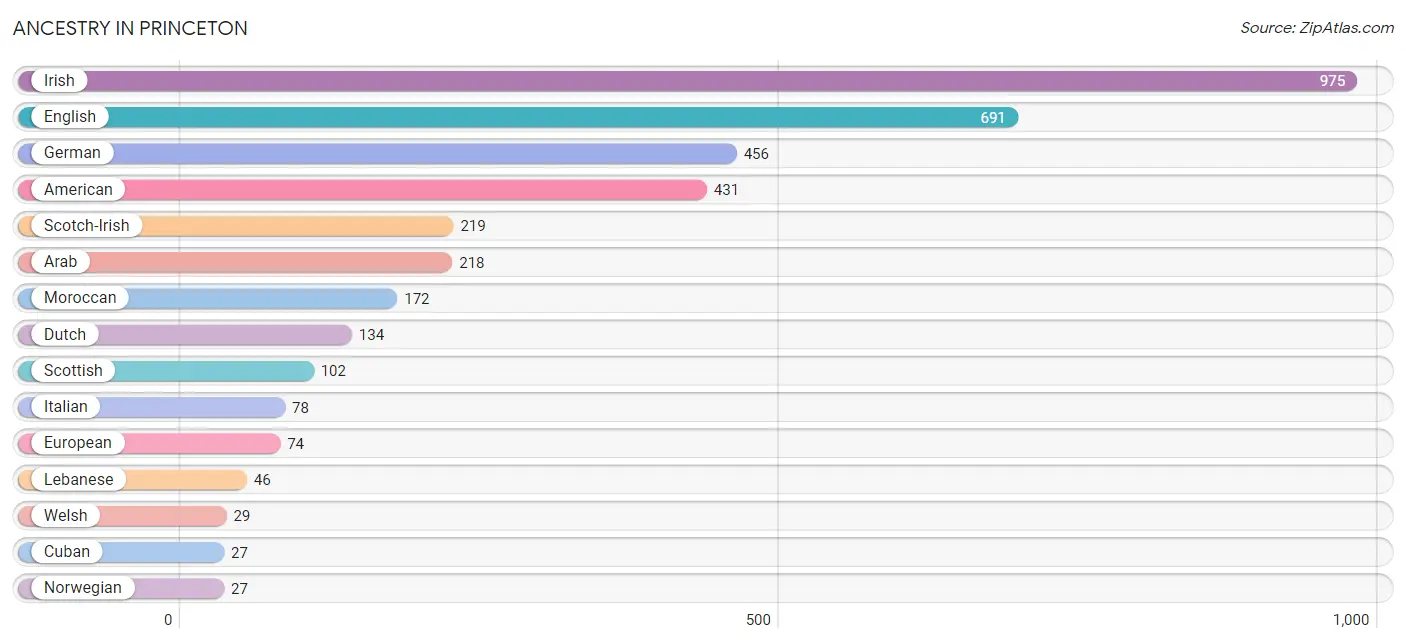
Ancestry in Princeton
The most populous ancestries reported in Princeton are Irish (975 | 16.7%), English (691 | 11.8%), German (456 | 7.8%), American (431 | 7.4%), and Scotch-Irish (219 | 3.7%), together accounting for 47.5% of all Princeton residents.
| Ancestry | # Population | % Population |
| American | 431 | 7.4% |
| Arab | 218 | 3.7% |
| Bhutanese | 24 | 0.4% |
| British | 18 | 0.3% |
| Croatian | 6 | 0.1% |
| Cuban | 27 | 0.5% |
| Czech | 6 | 0.1% |
| Dutch | 134 | 2.3% |
| Eastern European | 19 | 0.3% |
| English | 691 | 11.8% |
| European | 74 | 1.3% |
| French | 15 | 0.3% |
| German | 456 | 7.8% |
| Greek | 6 | 0.1% |
| Hungarian | 13 | 0.2% |
| Indian (Asian) | 25 | 0.4% |
| Irish | 975 | 16.7% |
| Italian | 78 | 1.3% |
| Korean | 18 | 0.3% |
| Lebanese | 46 | 0.8% |
| Moroccan | 172 | 2.9% |
| Norwegian | 27 | 0.5% |
| Polish | 25 | 0.4% |
| Romanian | 6 | 0.1% |
| Scandinavian | 10 | 0.2% |
| Scotch-Irish | 219 | 3.7% |
| Scottish | 102 | 1.8% |
| Spaniard | 9 | 0.2% |
| Welsh | 29 | 0.5% | View All 29 Rows |
Immigrants in Princeton
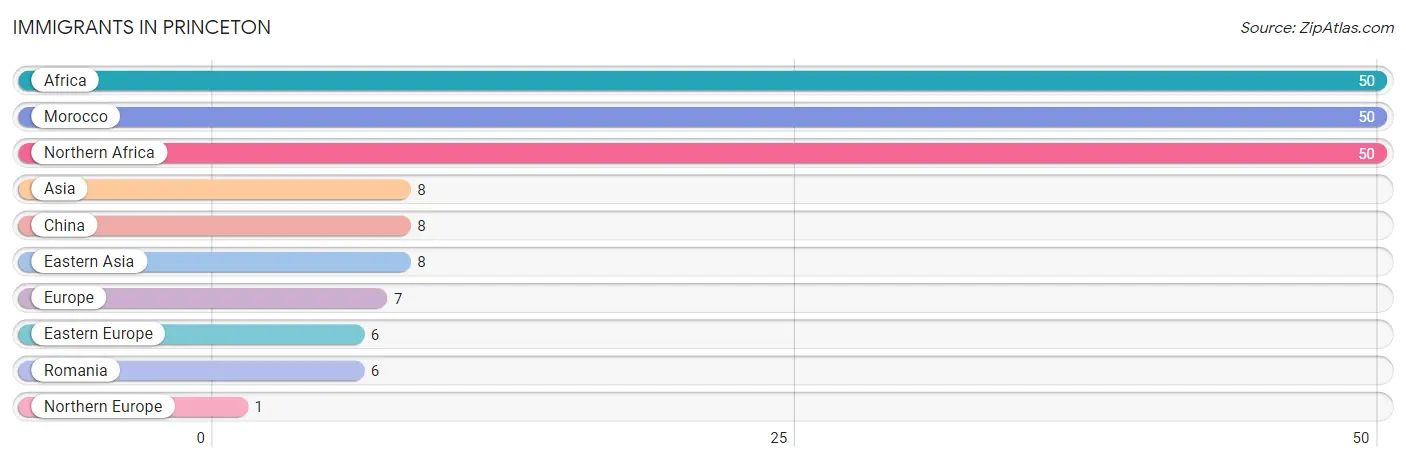
The most numerous immigrant groups reported in Princeton came from Africa (50 | 0.9%), Morocco (50 | 0.9%), Northern Africa (50 | 0.9%), Asia (8 | 0.1%), and China (8 | 0.1%), together accounting for 2.9% of all Princeton residents.
| Immigration Origin | # Population | % Population |
| Africa | 50 | 0.9% |
| Asia | 8 | 0.1% |
| China | 8 | 0.1% |
| Eastern Asia | 8 | 0.1% |
| Eastern Europe | 6 | 0.1% |
| Europe | 7 | 0.1% |
| Morocco | 50 | 0.9% |
| Northern Africa | 50 | 0.9% |
| Northern Europe | 1 | 0.0% |
| Romania | 6 | 0.1% | View All 10 Rows |
Sex and Age in Princeton
Sex and Age in Princeton
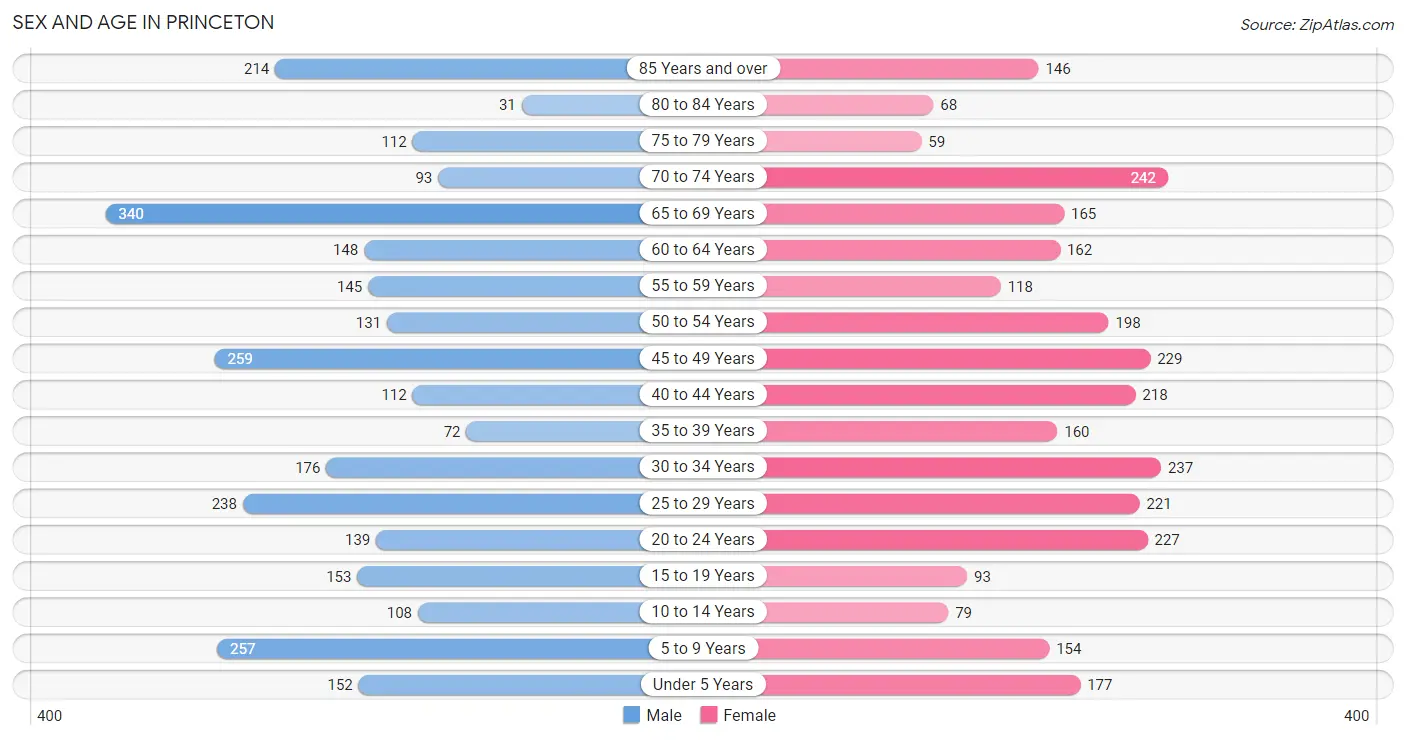
The most populous age groups in Princeton are 65 to 69 Years (340 | 11.8%) for men and 70 to 74 Years (242 | 8.2%) for women.
| Age Bracket | Male | Female |
| Under 5 Years | 152 (5.3%) | 177 (6.0%) |
| 5 to 9 Years | 257 (8.9%) | 154 (5.2%) |
| 10 to 14 Years | 108 (3.7%) | 79 (2.7%) |
| 15 to 19 Years | 153 (5.3%) | 93 (3.2%) |
| 20 to 24 Years | 139 (4.8%) | 227 (7.7%) |
| 25 to 29 Years | 238 (8.3%) | 221 (7.5%) |
| 30 to 34 Years | 176 (6.1%) | 237 (8.0%) |
| 35 to 39 Years | 72 (2.5%) | 160 (5.4%) |
| 40 to 44 Years | 112 (3.9%) | 218 (7.4%) |
| 45 to 49 Years | 259 (9.0%) | 229 (7.7%) |
| 50 to 54 Years | 131 (4.5%) | 198 (6.7%) |
| 55 to 59 Years | 145 (5.0%) | 118 (4.0%) |
| 60 to 64 Years | 148 (5.1%) | 162 (5.5%) |
| 65 to 69 Years | 340 (11.8%) | 165 (5.6%) |
| 70 to 74 Years | 93 (3.2%) | 242 (8.2%) |
| 75 to 79 Years | 112 (3.9%) | 59 (2.0%) |
| 80 to 84 Years | 31 (1.1%) | 68 (2.3%) |
| 85 Years and over | 214 (7.4%) | 146 (4.9%) |
| Total | 2,880 (100.0%) | 2,953 (100.0%) |
Families and Households in Princeton
Median Family Size in Princeton
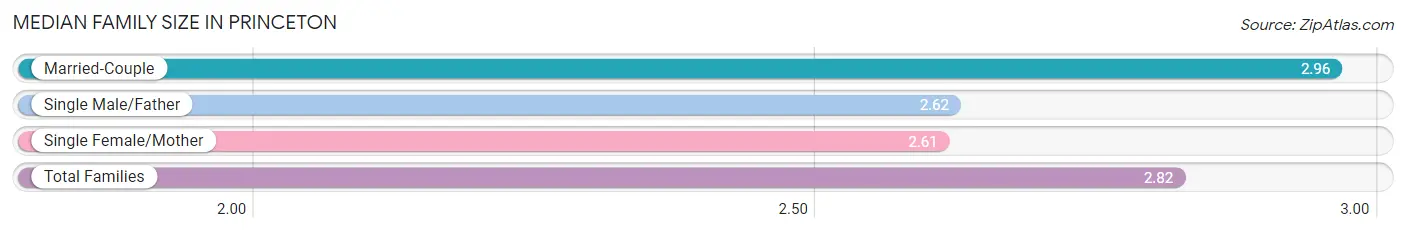
The median family size in Princeton is 2.82 persons per family, with married-couple families (948 | 60.1%) accounting for the largest median family size of 2.96 persons per family. On the other hand, single female/mother families (424 | 26.9%) represent the smallest median family size with 2.61 persons per family.
| Family Type | # Families | Family Size |
| Married-Couple | 948 (60.1%) | 2.96 |
| Single Male/Father | 205 (13.0%) | 2.62 |
| Single Female/Mother | 424 (26.9%) | 2.61 |
| Total Families | 1,577 (100.0%) | 2.82 |
Median Household Size in Princeton
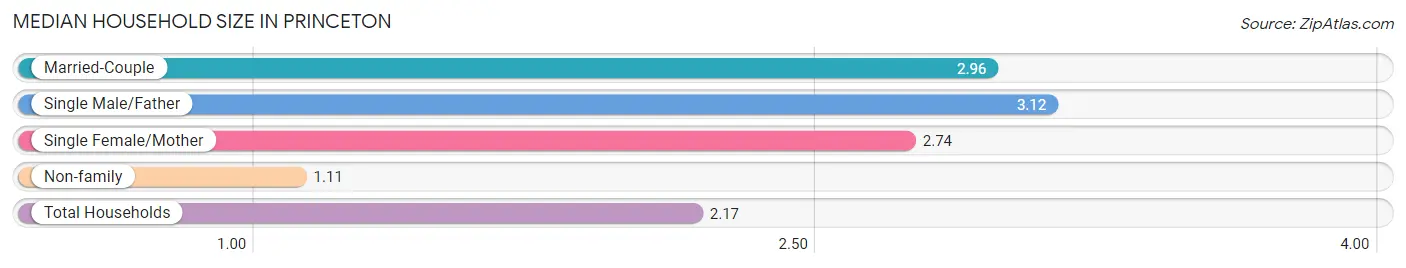
The median household size in Princeton is 2.17 persons per household, with single male/father households (205 | 7.6%) accounting for the largest median household size of 3.12 persons per household. non-family households (1,103 | 41.2%) represent the smallest median household size with 1.11 persons per household.
| Household Type | # Households | Household Size |
| Married-Couple | 948 (35.4%) | 2.96 |
| Single Male/Father | 205 (7.6%) | 3.12 |
| Single Female/Mother | 424 (15.8%) | 2.74 |
| Non-family | 1,103 (41.2%) | 1.11 |
| Total Households | 2,680 (100.0%) | 2.17 |
Household Size by Marriage Status in Princeton
Out of a total of 2,680 households in Princeton, 1,577 (58.8%) are family households, while 1,103 (41.2%) are nonfamily households. The most numerous type of family households are 2-person households, comprising 804, and the most common type of nonfamily households are 1-person households, comprising 1,021.
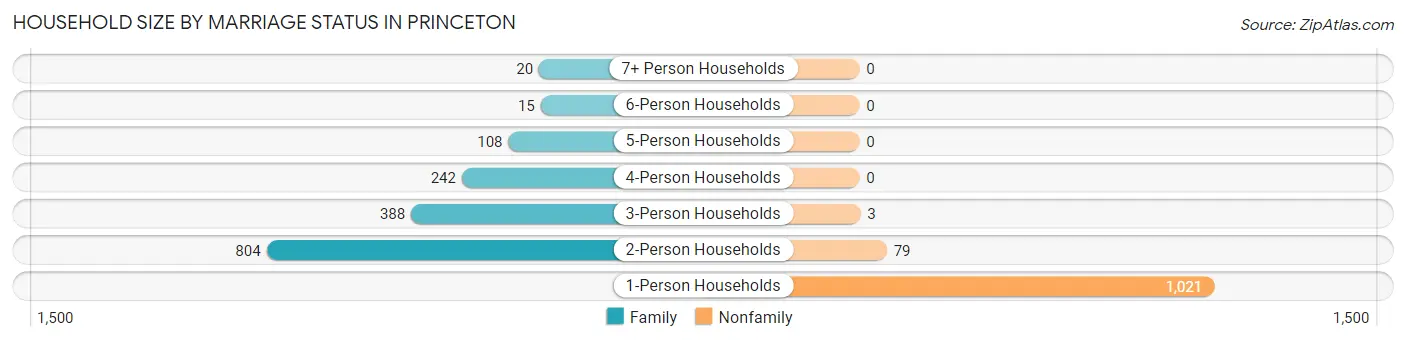
| Household Size | Family Households | Nonfamily Households |
| 1-Person Households | - | 1,021 (38.1%) |
| 2-Person Households | 804 (30.0%) | 79 (2.9%) |
| 3-Person Households | 388 (14.5%) | 3 (0.1%) |
| 4-Person Households | 242 (9.0%) | 0 (0.0%) |
| 5-Person Households | 108 (4.0%) | 0 (0.0%) |
| 6-Person Households | 15 (0.6%) | 0 (0.0%) |
| 7+ Person Households | 20 (0.7%) | 0 (0.0%) |
| Total | 1,577 (58.8%) | 1,103 (41.2%) |
Female Fertility in Princeton
Fertility by Age in Princeton
Average fertility rate in Princeton is 12.0 births per 1,000 women. Women in the age bracket of 20 to 34 years have the highest fertility rate with 13.0 births per 1,000 women. Women in the age bracket of 20 to 34 years acount for 52.9% of all women with births.
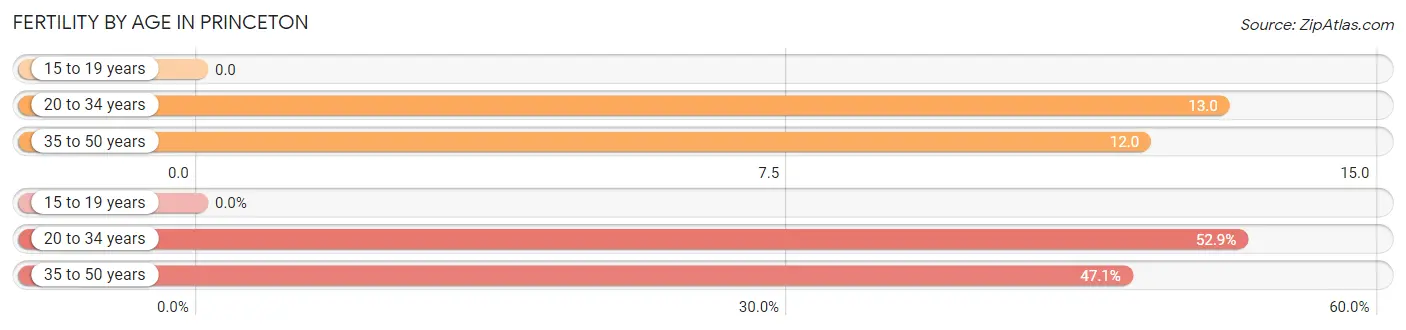
| Age Bracket | Women with Births | Births / 1,000 Women |
| 15 to 19 years | 0 (0.0%) | 0.0 |
| 20 to 34 years | 9 (52.9%) | 13.0 |
| 35 to 50 years | 8 (47.1%) | 12.0 |
| Total | 17 (100.0%) | 12.0 |
Fertility by Age by Marriage Status in Princeton
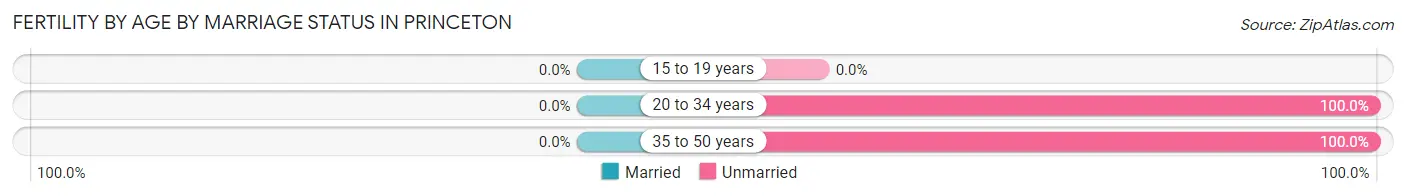
| Age Bracket | Married | Unmarried |
| 15 to 19 years | 0 (0.0%) | 0 (0.0%) |
| 20 to 34 years | 0 (0.0%) | 9 (100.0%) |
| 35 to 50 years | 0 (0.0%) | 8 (100.0%) |
| Total | 0 (0.0%) | 17 (100.0%) |
Fertility by Education in Princeton
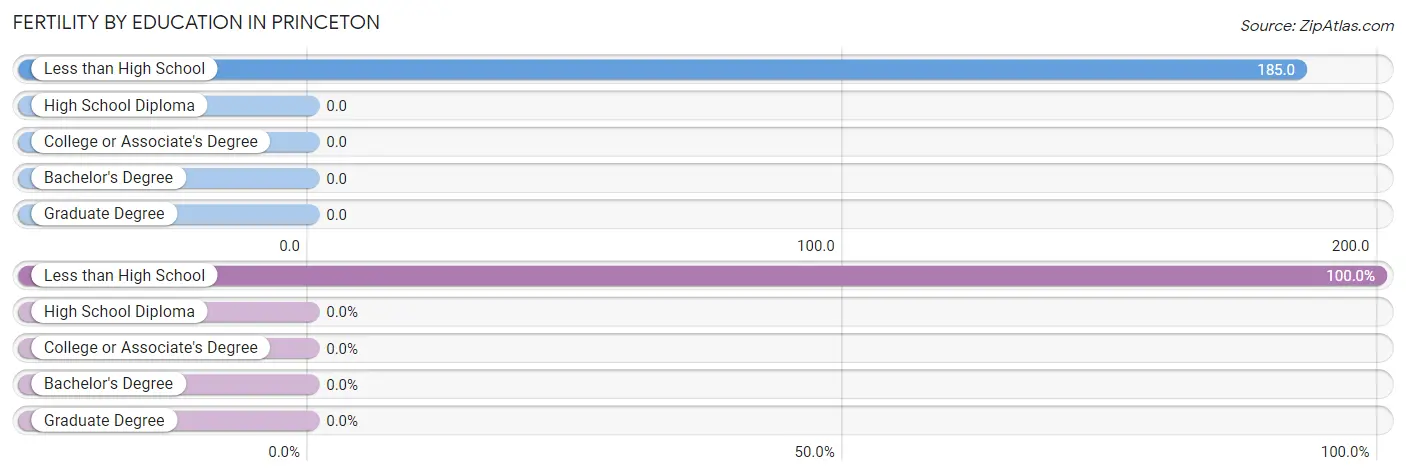
| Educational Attainment | Women with Births | Births / 1,000 Women |
| Less than High School | 17 (100.0%) | 185.0 |
| High School Diploma | 0 (0.0%) | 0.0 |
| College or Associate's Degree | 0 (0.0%) | 0.0 |
| Bachelor's Degree | 0 (0.0%) | 0.0 |
| Graduate Degree | 0 (0.0%) | 0.0 |
| Total | 17 (100.0%) | 12.0 |
Fertility by Education by Marriage Status in Princeton
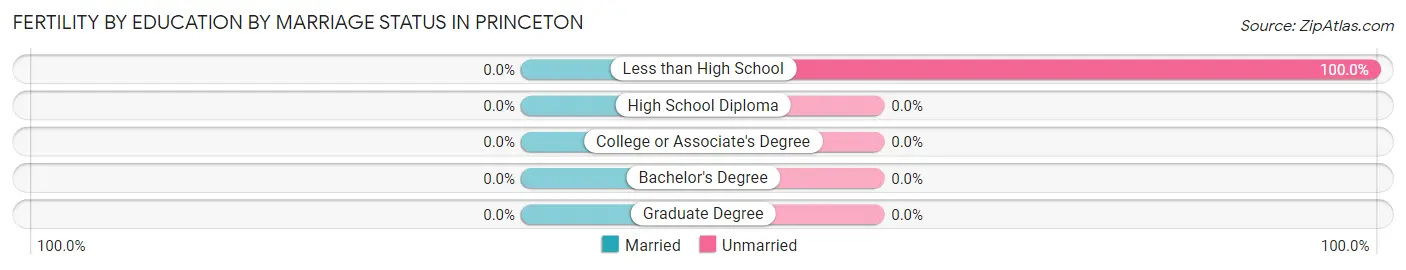
| Educational Attainment | Married | Unmarried |
| Less than High School | 0 (0.0%) | 17 (100.0%) |
| High School Diploma | 0 (0.0%) | 0 (0.0%) |
| College or Associate's Degree | 0 (0.0%) | 0 (0.0%) |
| Bachelor's Degree | 0 (0.0%) | 0 (0.0%) |
| Graduate Degree | 0 (0.0%) | 0 (0.0%) |
| Total | 0 (0.0%) | 17 (100.0%) |
Employment Characteristics in Princeton
Employment by Class of Employer in Princeton
Among the 2,390 employed individuals in Princeton, private company employees (1,672 | 70.0%), state government employees (196 | 8.2%), and local government employees (155 | 6.5%) make up the most common classes of employment.
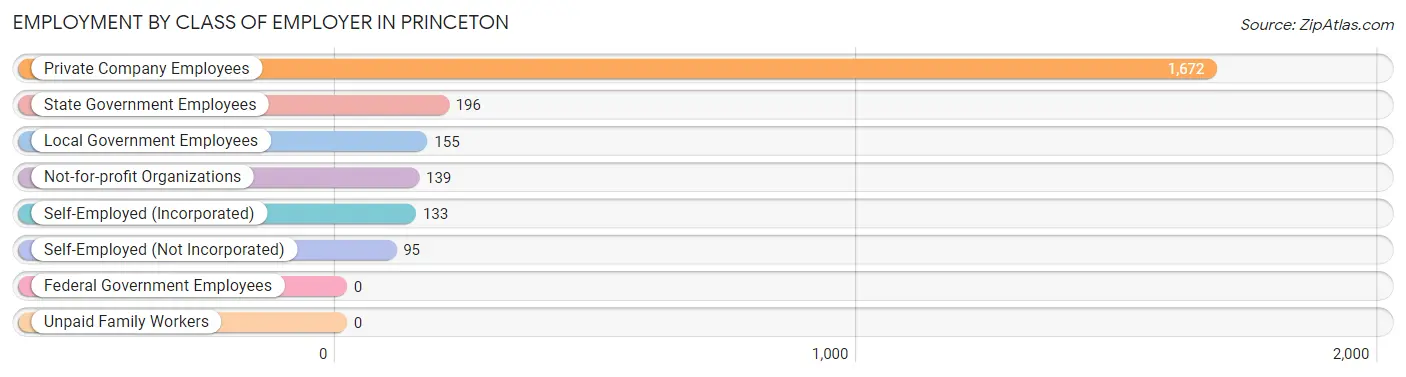
| Employer Class | # Employees | % Employees |
| Private Company Employees | 1,672 | 70.0% |
| Self-Employed (Incorporated) | 133 | 5.6% |
| Self-Employed (Not Incorporated) | 95 | 4.0% |
| Not-for-profit Organizations | 139 | 5.8% |
| Local Government Employees | 155 | 6.5% |
| State Government Employees | 196 | 8.2% |
| Federal Government Employees | 0 | 0.0% |
| Unpaid Family Workers | 0 | 0.0% |
| Total | 2,390 | 100.0% |
Employment Status by Age in Princeton
According to the labor force statistics for Princeton, out of the total population over 16 years of age (4,866), 52.5% or 2,555 individuals are in the labor force, with 5.2% or 133 of them unemployed. The age group with the highest labor force participation rate is 20 to 24 years, with 86.1% or 315 individuals in the labor force. Within the labor force, the 16 to 19 years age range has the highest percentage of unemployed individuals, with 28.8% or 21 of them being unemployed.
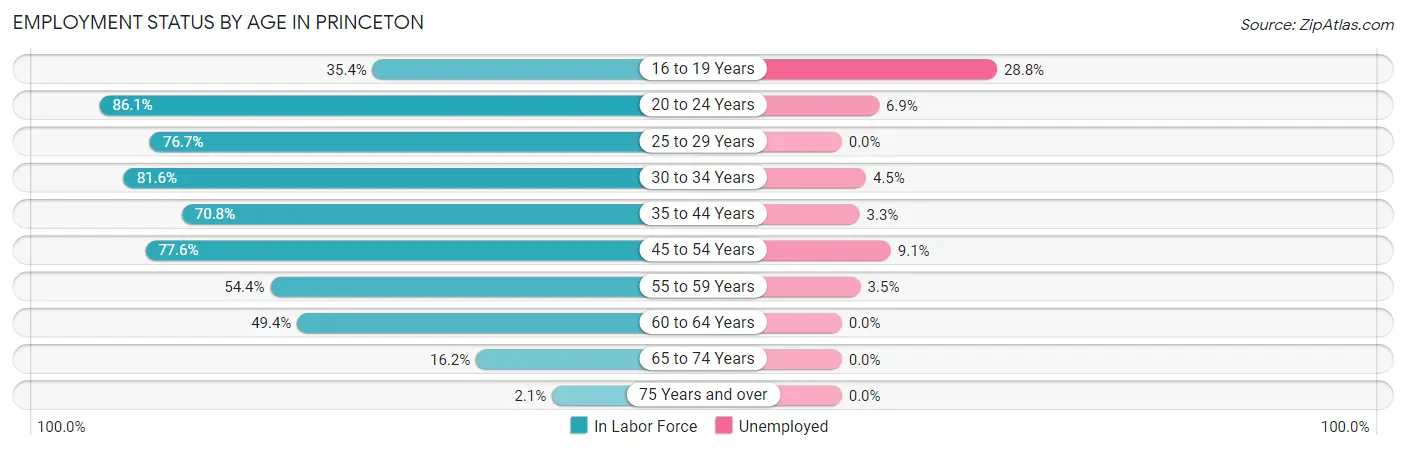
| Age Bracket | In Labor Force | Unemployed |
| 16 to 19 Years | 73 (35.4%) | 21 (28.8%) |
| 20 to 24 Years | 315 (86.1%) | 22 (6.9%) |
| 25 to 29 Years | 352 (76.7%) | 0 (0.0%) |
| 30 to 34 Years | 337 (81.6%) | 15 (4.5%) |
| 35 to 44 Years | 398 (70.8%) | 13 (3.3%) |
| 45 to 54 Years | 634 (77.6%) | 58 (9.1%) |
| 55 to 59 Years | 143 (54.4%) | 5 (3.5%) |
| 60 to 64 Years | 153 (49.4%) | 0 (0.0%) |
| 65 to 74 Years | 136 (16.2%) | 0 (0.0%) |
| 75 Years and over | 13 (2.1%) | 0 (0.0%) |
| Total | 2,555 (52.5%) | 133 (5.2%) |
Employment Status by Educational Attainment in Princeton
According to labor force statistics for Princeton, 71.4% of individuals (2,016) out of the total population between 25 and 64 years of age (2,824) are in the labor force, with 4.5% or 91 of them being unemployed. The group with the highest labor force participation rate are those with the educational attainment of bachelor's degree or higher, with 84.7% or 472 individuals in the labor force. Within the labor force, individuals with less than high school education have the highest percentage of unemployment, with 11.3% or 13 of them being unemployed.
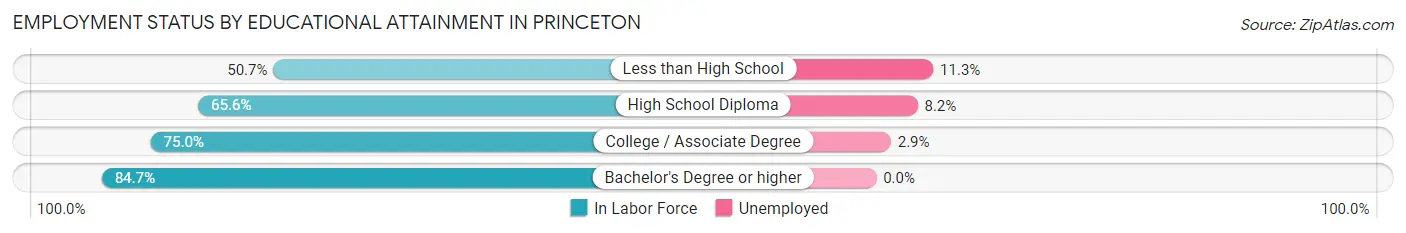
| Educational Attainment | In Labor Force | Unemployed |
| Less than High School | 115 (50.7%) | 26 (11.3%) |
| High School Diploma | 698 (65.6%) | 87 (8.2%) |
| College / Associate Degree | 732 (75.0%) | 28 (2.9%) |
| Bachelor's Degree or higher | 472 (84.7%) | 0 (0.0%) |
| Total | 2,016 (71.4%) | 127 (4.5%) |
Employment Occupations by Sex in Princeton
Management, Business, Science and Arts Occupations
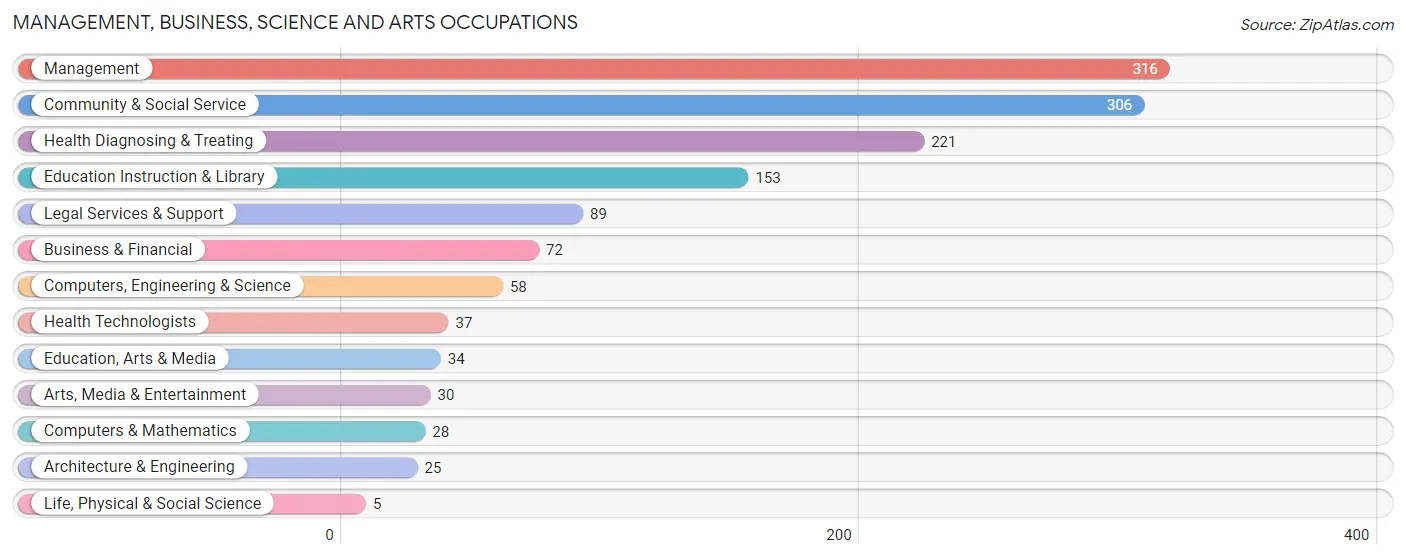
The most common Management, Business, Science and Arts occupations in Princeton are Management (316 | 13.1%), Community & Social Service (306 | 12.7%), Health Diagnosing & Treating (221 | 9.2%), Education Instruction & Library (153 | 6.4%), and Legal Services & Support (89 | 3.7%).
Management, Business, Science and Arts Occupations by Sex
Within the Management, Business, Science and Arts occupations in Princeton, the most male-oriented occupations are Computers, Engineering & Science (100.0%), Computers & Mathematics (100.0%), and Architecture & Engineering (100.0%), while the most female-oriented occupations are Health Technologists (100.0%), Health Diagnosing & Treating (95.5%), and Education, Arts & Media (85.3%).
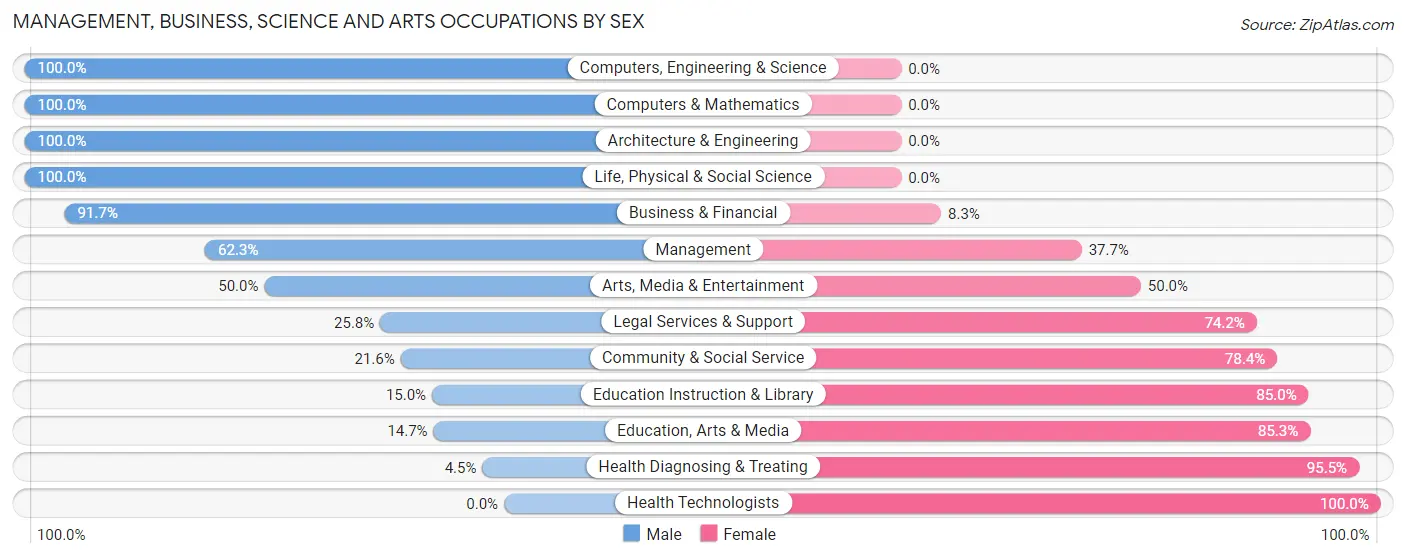
| Occupation | Male | Female |
| Management | 197 (62.3%) | 119 (37.7%) |
| Business & Financial | 66 (91.7%) | 6 (8.3%) |
| Computers, Engineering & Science | 58 (100.0%) | 0 (0.0%) |
| Computers & Mathematics | 28 (100.0%) | 0 (0.0%) |
| Architecture & Engineering | 25 (100.0%) | 0 (0.0%) |
| Life, Physical & Social Science | 5 (100.0%) | 0 (0.0%) |
| Community & Social Service | 66 (21.6%) | 240 (78.4%) |
| Education, Arts & Media | 5 (14.7%) | 29 (85.3%) |
| Legal Services & Support | 23 (25.8%) | 66 (74.2%) |
| Education Instruction & Library | 23 (15.0%) | 130 (85.0%) |
| Arts, Media & Entertainment | 15 (50.0%) | 15 (50.0%) |
| Health Diagnosing & Treating | 10 (4.5%) | 211 (95.5%) |
| Health Technologists | 0 (0.0%) | 37 (100.0%) |
| Total (Category) | 397 (40.8%) | 576 (59.2%) |
| Total (Overall) | 1,152 (47.8%) | 1,258 (52.2%) |
Services Occupations
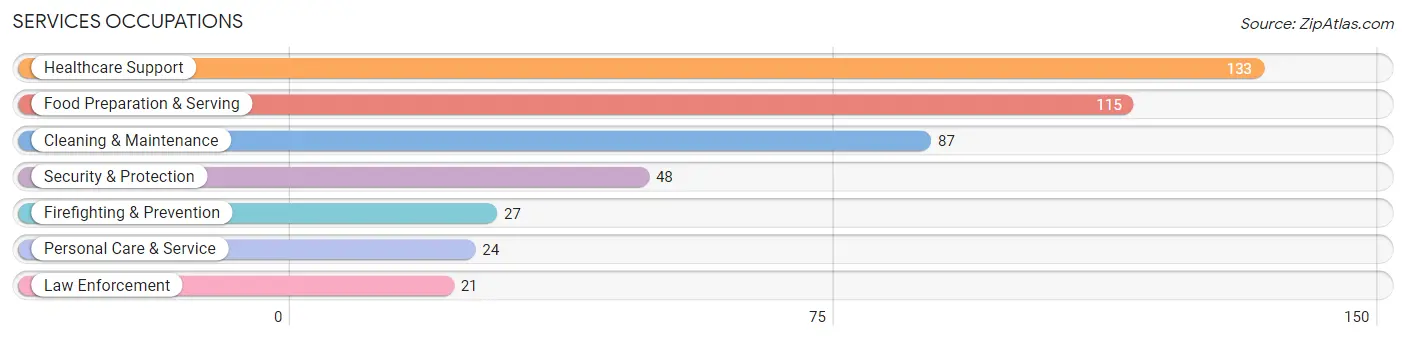
The most common Services occupations in Princeton are Healthcare Support (133 | 5.5%), Food Preparation & Serving (115 | 4.8%), Cleaning & Maintenance (87 | 3.6%), Security & Protection (48 | 2.0%), and Firefighting & Prevention (27 | 1.1%).
Services Occupations by Sex
Within the Services occupations in Princeton, the most male-oriented occupations are Firefighting & Prevention (100.0%), Security & Protection (81.2%), and Personal Care & Service (70.8%), while the most female-oriented occupations are Food Preparation & Serving (100.0%), Healthcare Support (73.7%), and Cleaning & Maintenance (63.2%).
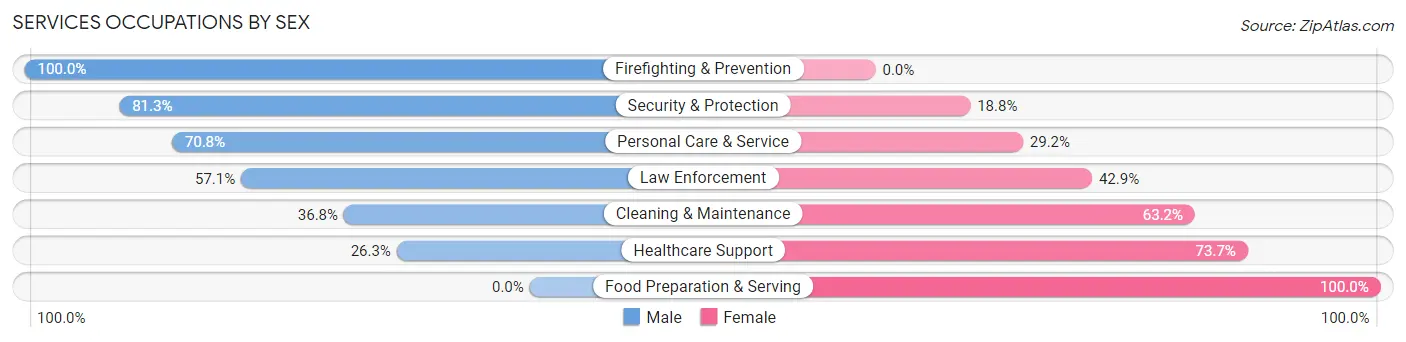
| Occupation | Male | Female |
| Healthcare Support | 35 (26.3%) | 98 (73.7%) |
| Security & Protection | 39 (81.2%) | 9 (18.8%) |
| Firefighting & Prevention | 27 (100.0%) | 0 (0.0%) |
| Law Enforcement | 12 (57.1%) | 9 (42.9%) |
| Food Preparation & Serving | 0 (0.0%) | 115 (100.0%) |
| Cleaning & Maintenance | 32 (36.8%) | 55 (63.2%) |
| Personal Care & Service | 17 (70.8%) | 7 (29.2%) |
| Total (Category) | 123 (30.2%) | 284 (69.8%) |
| Total (Overall) | 1,152 (47.8%) | 1,258 (52.2%) |
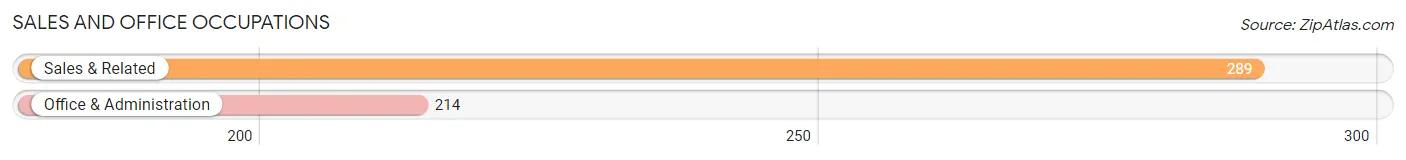
Sales and Office Occupations
The most common Sales and Office occupations in Princeton are Sales & Related (289 | 12.0%), and Office & Administration (214 | 8.9%).
Sales and Office Occupations by Sex
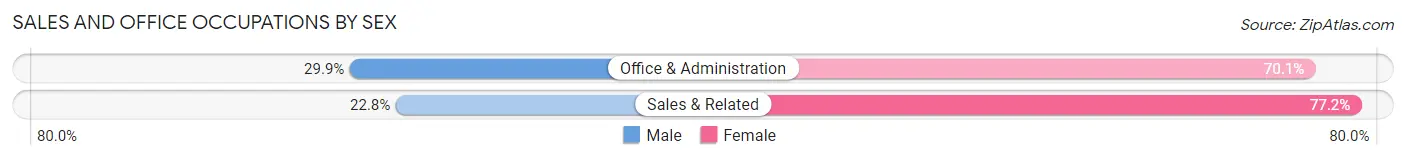
| Occupation | Male | Female |
| Sales & Related | 66 (22.8%) | 223 (77.2%) |
| Office & Administration | 64 (29.9%) | 150 (70.1%) |
| Total (Category) | 130 (25.8%) | 373 (74.2%) |
| Total (Overall) | 1,152 (47.8%) | 1,258 (52.2%) |
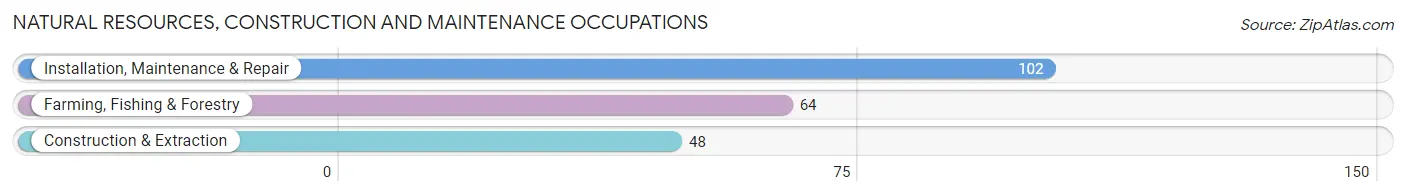
Natural Resources, Construction and Maintenance Occupations
The most common Natural Resources, Construction and Maintenance occupations in Princeton are Installation, Maintenance & Repair (102 | 4.2%), Farming, Fishing & Forestry (64 | 2.7%), and Construction & Extraction (48 | 2.0%).
Natural Resources, Construction and Maintenance Occupations by Sex
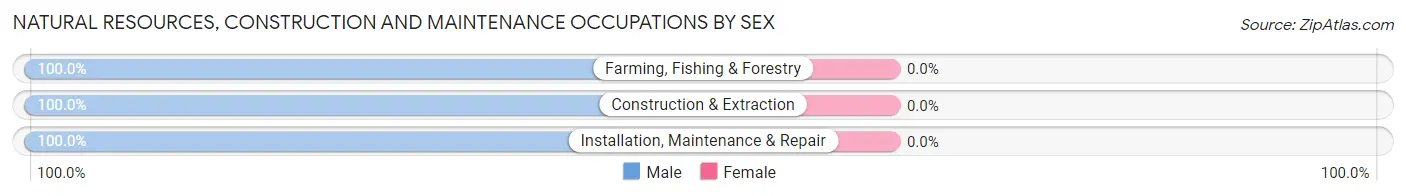
| Occupation | Male | Female |
| Farming, Fishing & Forestry | 64 (100.0%) | 0 (0.0%) |
| Construction & Extraction | 48 (100.0%) | 0 (0.0%) |
| Installation, Maintenance & Repair | 102 (100.0%) | 0 (0.0%) |
| Total (Category) | 214 (100.0%) | 0 (0.0%) |
| Total (Overall) | 1,152 (47.8%) | 1,258 (52.2%) |
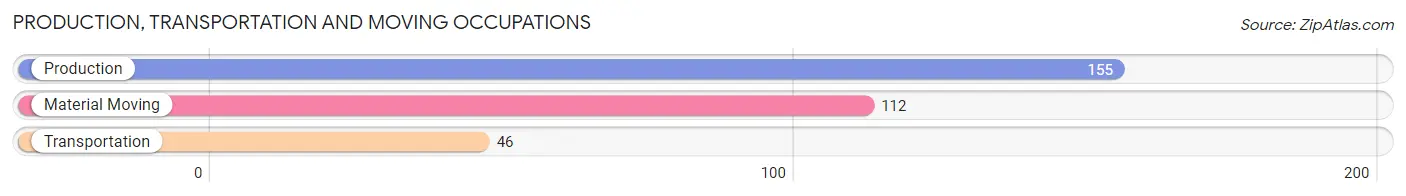
Production, Transportation and Moving Occupations
The most common Production, Transportation and Moving occupations in Princeton are Production (155 | 6.4%), Material Moving (112 | 4.6%), and Transportation (46 | 1.9%).
Production, Transportation and Moving Occupations by Sex
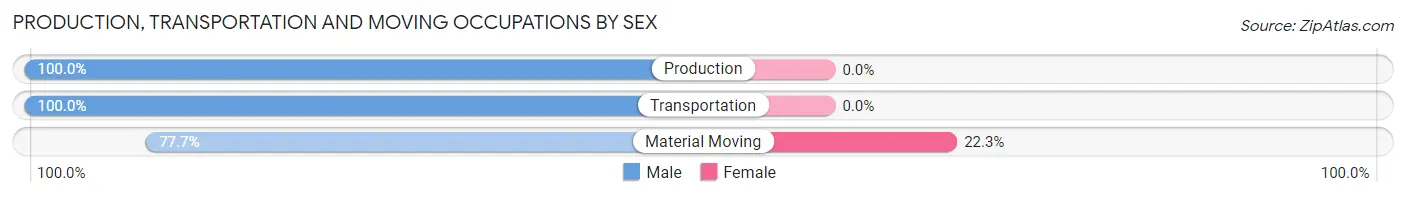
| Occupation | Male | Female |
| Production | 155 (100.0%) | 0 (0.0%) |
| Transportation | 46 (100.0%) | 0 (0.0%) |
| Material Moving | 87 (77.7%) | 25 (22.3%) |
| Total (Category) | 288 (92.0%) | 25 (8.0%) |
| Total (Overall) | 1,152 (47.8%) | 1,258 (52.2%) |
Employment Industries by Sex in Princeton
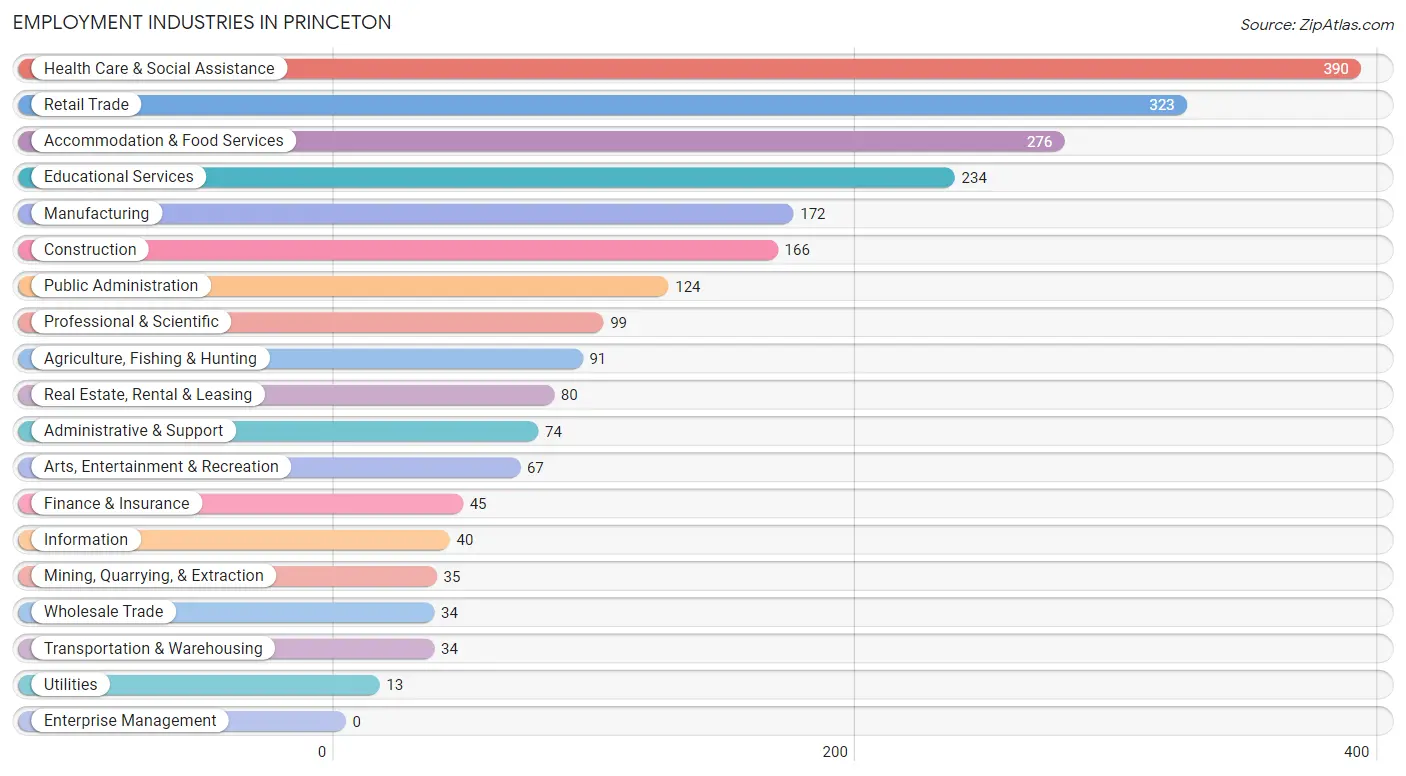
Employment Industries in Princeton
The major employment industries in Princeton include Health Care & Social Assistance (390 | 16.2%), Retail Trade (323 | 13.4%), Accommodation & Food Services (276 | 11.5%), Educational Services (234 | 9.7%), and Manufacturing (172 | 7.1%).
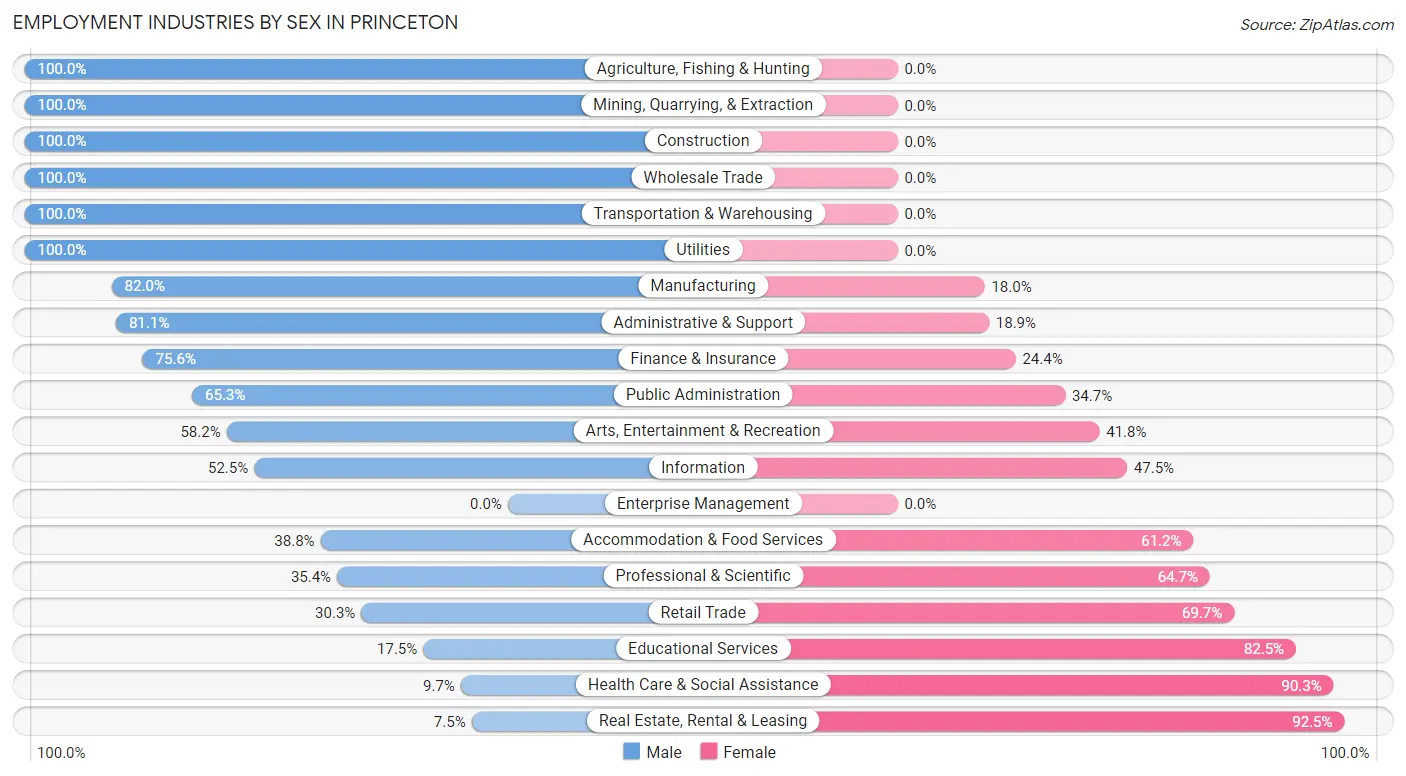
Employment Industries by Sex in Princeton
The Princeton industries that see more men than women are Agriculture, Fishing & Hunting (100.0%), Mining, Quarrying, & Extraction (100.0%), and Construction (100.0%), whereas the industries that tend to have a higher number of women are Real Estate, Rental & Leasing (92.5%), Health Care & Social Assistance (90.3%), and Educational Services (82.5%).
| Industry | Male | Female |
| Agriculture, Fishing & Hunting | 91 (100.0%) | 0 (0.0%) |
| Mining, Quarrying, & Extraction | 35 (100.0%) | 0 (0.0%) |
| Construction | 166 (100.0%) | 0 (0.0%) |
| Manufacturing | 141 (82.0%) | 31 (18.0%) |
| Wholesale Trade | 34 (100.0%) | 0 (0.0%) |
| Retail Trade | 98 (30.3%) | 225 (69.7%) |
| Transportation & Warehousing | 34 (100.0%) | 0 (0.0%) |
| Utilities | 13 (100.0%) | 0 (0.0%) |
| Information | 21 (52.5%) | 19 (47.5%) |
| Finance & Insurance | 34 (75.6%) | 11 (24.4%) |
| Real Estate, Rental & Leasing | 6 (7.5%) | 74 (92.5%) |
| Professional & Scientific | 35 (35.3%) | 64 (64.6%) |
| Enterprise Management | 0 (0.0%) | 0 (0.0%) |
| Administrative & Support | 60 (81.1%) | 14 (18.9%) |
| Educational Services | 41 (17.5%) | 193 (82.5%) |
| Health Care & Social Assistance | 38 (9.7%) | 352 (90.3%) |
| Arts, Entertainment & Recreation | 39 (58.2%) | 28 (41.8%) |
| Accommodation & Food Services | 107 (38.8%) | 169 (61.2%) |
| Public Administration | 81 (65.3%) | 43 (34.7%) |
| Total | 1,152 (47.8%) | 1,258 (52.2%) |
Education in Princeton
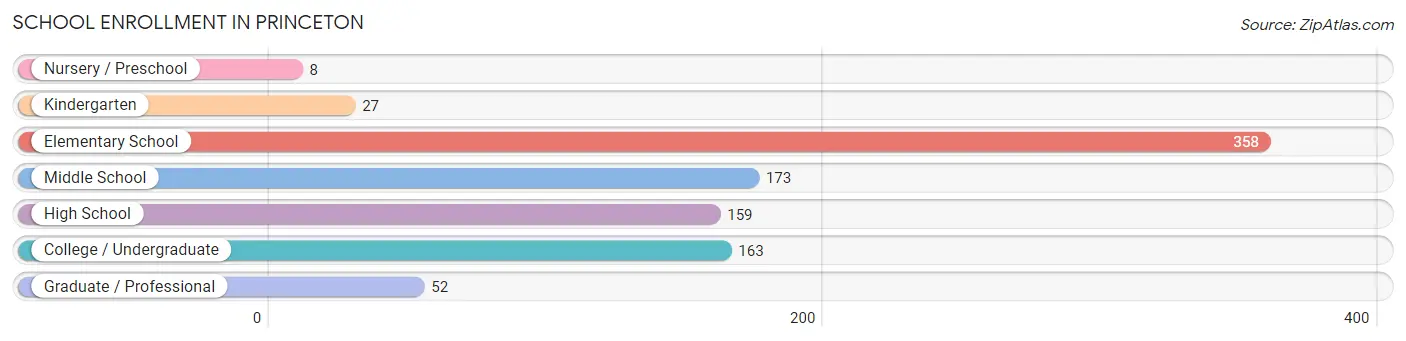
School Enrollment in Princeton
The most common levels of schooling among the 940 students in Princeton are elementary school (358 | 38.1%), middle school (173 | 18.4%), and college / undergraduate (163 | 17.3%).
| School Level | # Students | % Students |
| Nursery / Preschool | 8 | 0.9% |
| Kindergarten | 27 | 2.9% |
| Elementary School | 358 | 38.1% |
| Middle School | 173 | 18.4% |
| High School | 159 | 16.9% |
| College / Undergraduate | 163 | 17.3% |
| Graduate / Professional | 52 | 5.5% |
| Total | 940 | 100.0% |
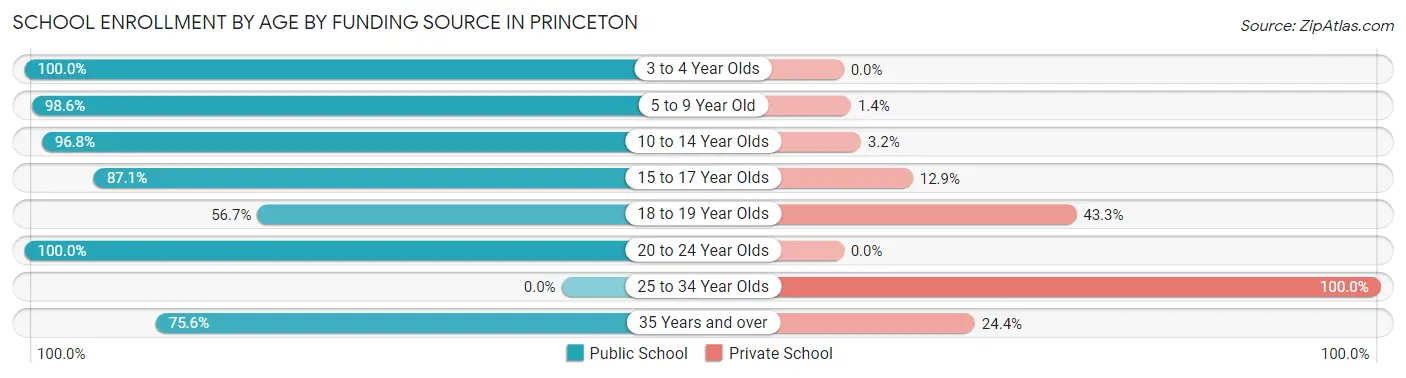
School Enrollment by Age by Funding Source in Princeton
Out of a total of 940 students who are enrolled in schools in Princeton, 82 (8.7%) attend a private institution, while the remaining 858 (91.3%) are enrolled in public schools. The age group of 25 to 34 year olds has the highest likelihood of being enrolled in private schools, with 17 (100.0% in the age bracket) enrolled. Conversely, the age group of 3 to 4 year olds has the lowest likelihood of being enrolled in a private school, with 8 (100.0% in the age bracket) attending a public institution.
| Age Bracket | Public School | Private School |
| 3 to 4 Year Olds | 8 (100.0%) | 0 (0.0%) |
| 5 to 9 Year Old | 364 (98.6%) | 5 (1.4%) |
| 10 to 14 Year Olds | 181 (96.8%) | 6 (3.2%) |
| 15 to 17 Year Olds | 115 (87.1%) | 17 (12.9%) |
| 18 to 19 Year Olds | 34 (56.7%) | 26 (43.3%) |
| 20 to 24 Year Olds | 122 (100.0%) | 0 (0.0%) |
| 25 to 34 Year Olds | 0 (0.0%) | 17 (100.0%) |
| 35 Years and over | 34 (75.6%) | 11 (24.4%) |
| Total | 858 (91.3%) | 82 (8.7%) |
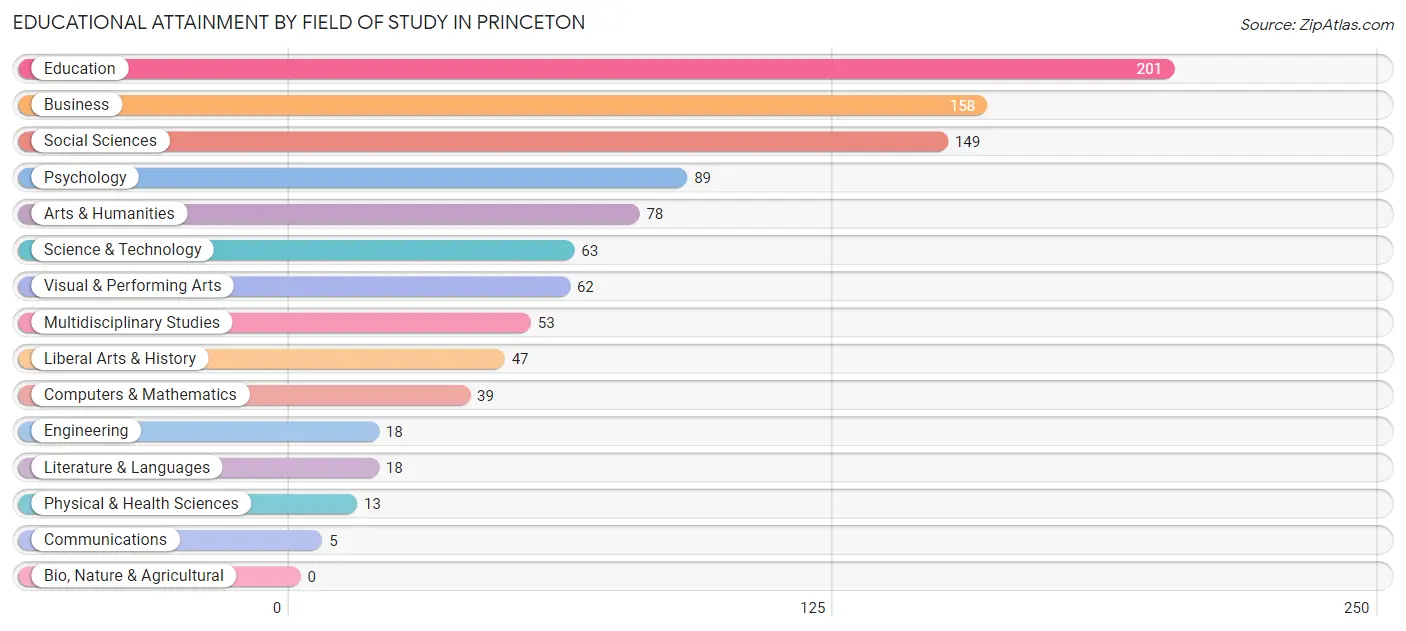
Educational Attainment by Field of Study in Princeton
Education (201 | 20.2%), business (158 | 15.9%), social sciences (149 | 15.0%), psychology (89 | 9.0%), and arts & humanities (78 | 7.9%) are the most common fields of study among 993 individuals in Princeton who have obtained a bachelor's degree or higher.
| Field of Study | # Graduates | % Graduates |
| Computers & Mathematics | 39 | 3.9% |
| Bio, Nature & Agricultural | 0 | 0.0% |
| Physical & Health Sciences | 13 | 1.3% |
| Psychology | 89 | 9.0% |
| Social Sciences | 149 | 15.0% |
| Engineering | 18 | 1.8% |
| Multidisciplinary Studies | 53 | 5.3% |
| Science & Technology | 63 | 6.3% |
| Business | 158 | 15.9% |
| Education | 201 | 20.2% |
| Literature & Languages | 18 | 1.8% |
| Liberal Arts & History | 47 | 4.7% |
| Visual & Performing Arts | 62 | 6.2% |
| Communications | 5 | 0.5% |
| Arts & Humanities | 78 | 7.9% |
| Total | 993 | 100.0% |
Transportation & Commute in Princeton
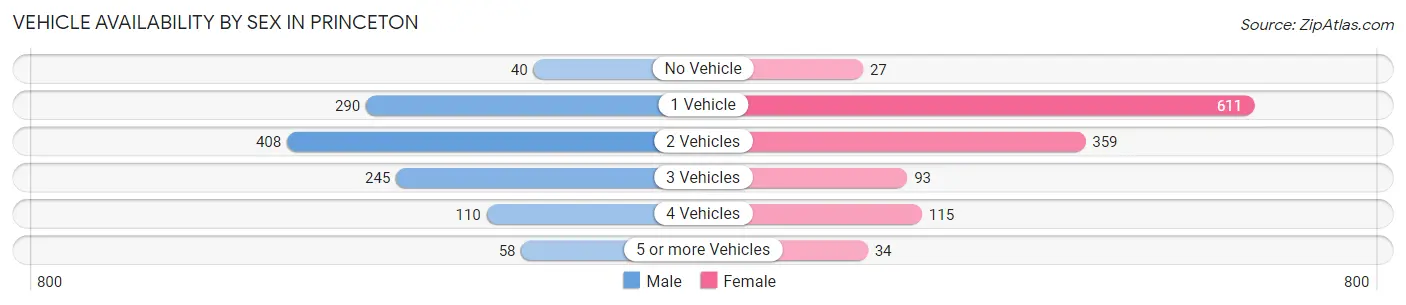
Vehicle Availability by Sex in Princeton
The most prevalent vehicle ownership categories in Princeton are males with 2 vehicles (408, accounting for 35.4%) and females with 2 vehicles (359, making up 32.9%).
| Vehicles Available | Male | Female |
| No Vehicle | 40 (3.5%) | 27 (2.2%) |
| 1 Vehicle | 290 (25.2%) | 611 (49.3%) |
| 2 Vehicles | 408 (35.4%) | 359 (29.0%) |
| 3 Vehicles | 245 (21.3%) | 93 (7.5%) |
| 4 Vehicles | 110 (9.6%) | 115 (9.3%) |
| 5 or more Vehicles | 58 (5.0%) | 34 (2.7%) |
| Total | 1,151 (100.0%) | 1,239 (100.0%) |
Commute Time in Princeton
The most frequently occuring commute durations in Princeton are 5 to 9 minutes (560 commuters, 25.3%), 10 to 14 minutes (355 commuters, 16.1%), and 20 to 24 minutes (275 commuters, 12.4%).
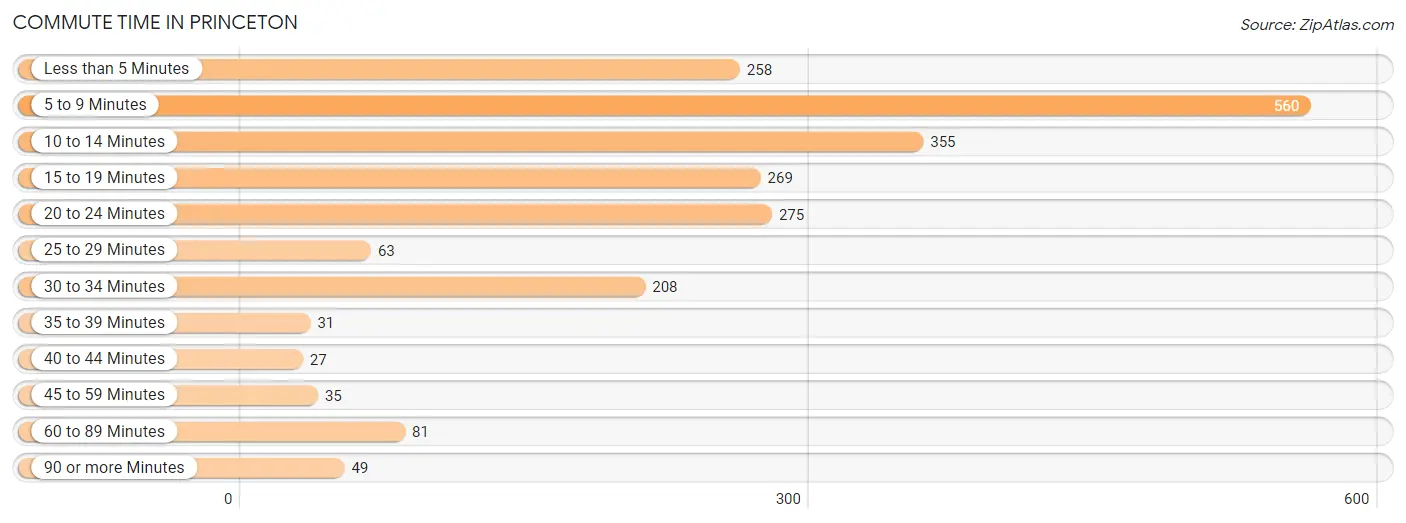
| Commute Time | # Commuters | % Commuters |
| Less than 5 Minutes | 258 | 11.7% |
| 5 to 9 Minutes | 560 | 25.3% |
| 10 to 14 Minutes | 355 | 16.1% |
| 15 to 19 Minutes | 269 | 12.2% |
| 20 to 24 Minutes | 275 | 12.4% |
| 25 to 29 Minutes | 63 | 2.9% |
| 30 to 34 Minutes | 208 | 9.4% |
| 35 to 39 Minutes | 31 | 1.4% |
| 40 to 44 Minutes | 27 | 1.2% |
| 45 to 59 Minutes | 35 | 1.6% |
| 60 to 89 Minutes | 81 | 3.7% |
| 90 or more Minutes | 49 | 2.2% |
Commute Time by Sex in Princeton
The most common commute times in Princeton are 20 to 24 minutes (198 commuters, 18.9%) for males and 5 to 9 minutes (367 commuters, 31.6%) for females.
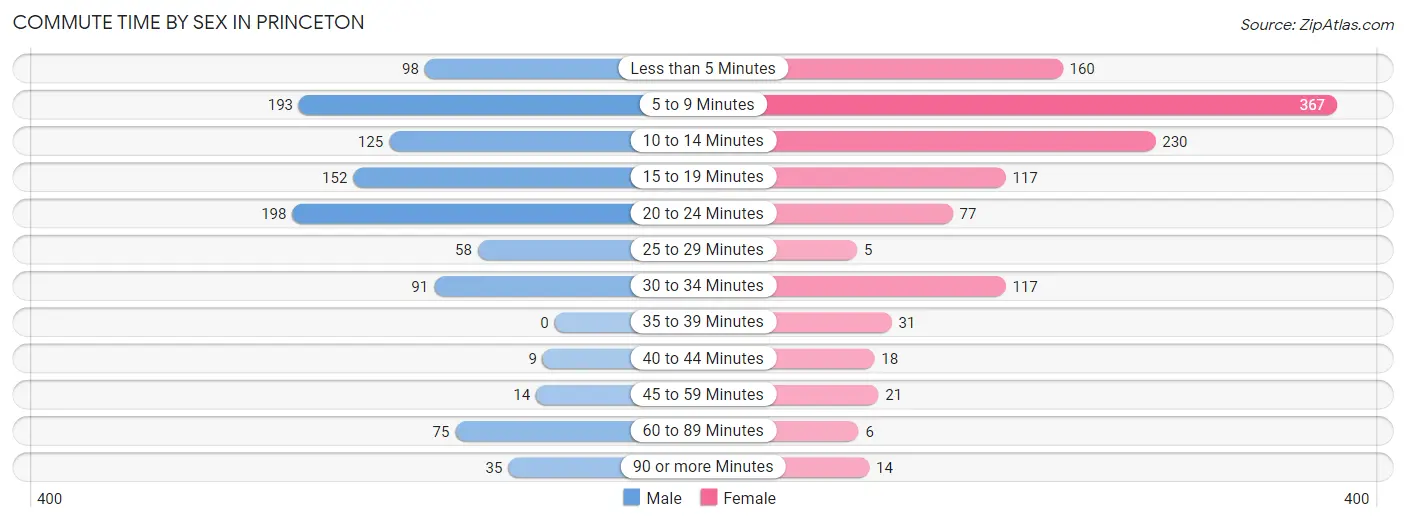
| Commute Time | Male | Female |
| Less than 5 Minutes | 98 (9.3%) | 160 (13.8%) |
| 5 to 9 Minutes | 193 (18.4%) | 367 (31.6%) |
| 10 to 14 Minutes | 125 (11.9%) | 230 (19.8%) |
| 15 to 19 Minutes | 152 (14.5%) | 117 (10.1%) |
| 20 to 24 Minutes | 198 (18.9%) | 77 (6.6%) |
| 25 to 29 Minutes | 58 (5.5%) | 5 (0.4%) |
| 30 to 34 Minutes | 91 (8.7%) | 117 (10.1%) |
| 35 to 39 Minutes | 0 (0.0%) | 31 (2.7%) |
| 40 to 44 Minutes | 9 (0.9%) | 18 (1.5%) |
| 45 to 59 Minutes | 14 (1.3%) | 21 (1.8%) |
| 60 to 89 Minutes | 75 (7.2%) | 6 (0.5%) |
| 90 or more Minutes | 35 (3.3%) | 14 (1.2%) |
Time of Departure to Work by Sex in Princeton
The most frequent times of departure to work in Princeton are 6:30 AM to 6:59 AM (187, 17.8%) for males and 7:30 AM to 7:59 AM (222, 19.1%) for females.
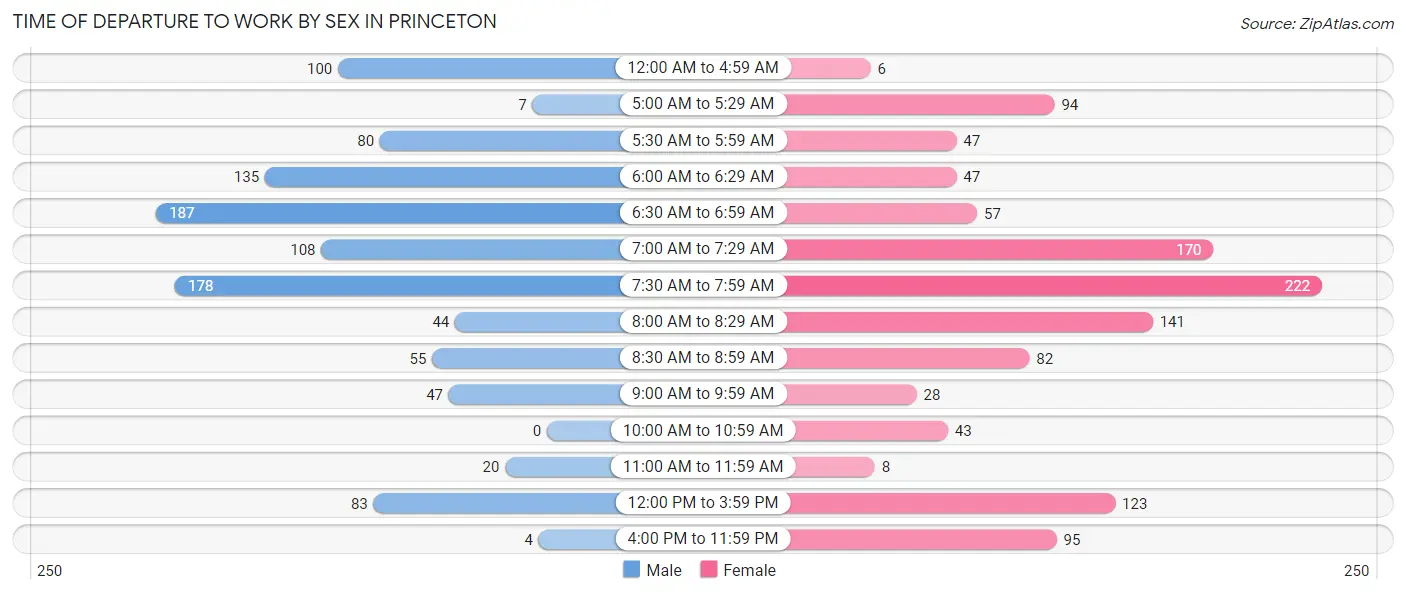
| Time of Departure | Male | Female |
| 12:00 AM to 4:59 AM | 100 (9.5%) | 6 (0.5%) |
| 5:00 AM to 5:29 AM | 7 (0.7%) | 94 (8.1%) |
| 5:30 AM to 5:59 AM | 80 (7.6%) | 47 (4.0%) |
| 6:00 AM to 6:29 AM | 135 (12.9%) | 47 (4.0%) |
| 6:30 AM to 6:59 AM | 187 (17.8%) | 57 (4.9%) |
| 7:00 AM to 7:29 AM | 108 (10.3%) | 170 (14.6%) |
| 7:30 AM to 7:59 AM | 178 (17.0%) | 222 (19.1%) |
| 8:00 AM to 8:29 AM | 44 (4.2%) | 141 (12.1%) |
| 8:30 AM to 8:59 AM | 55 (5.2%) | 82 (7.0%) |
| 9:00 AM to 9:59 AM | 47 (4.5%) | 28 (2.4%) |
| 10:00 AM to 10:59 AM | 0 (0.0%) | 43 (3.7%) |
| 11:00 AM to 11:59 AM | 20 (1.9%) | 8 (0.7%) |
| 12:00 PM to 3:59 PM | 83 (7.9%) | 123 (10.6%) |
| 4:00 PM to 11:59 PM | 4 (0.4%) | 95 (8.2%) |
| Total | 1,048 (100.0%) | 1,163 (100.0%) |
Housing Occupancy in Princeton
Occupancy by Ownership in Princeton
Of the total 2,680 dwellings in Princeton, owner-occupied units account for 1,415 (52.8%), while renter-occupied units make up 1,265 (47.2%).
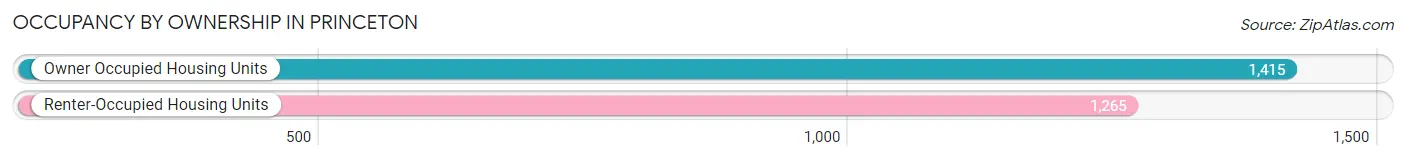
| Occupancy | # Housing Units | % Housing Units |
| Owner Occupied Housing Units | 1,415 | 52.8% |
| Renter-Occupied Housing Units | 1,265 | 47.2% |
| Total Occupied Housing Units | 2,680 | 100.0% |
Occupancy by Household Size in Princeton
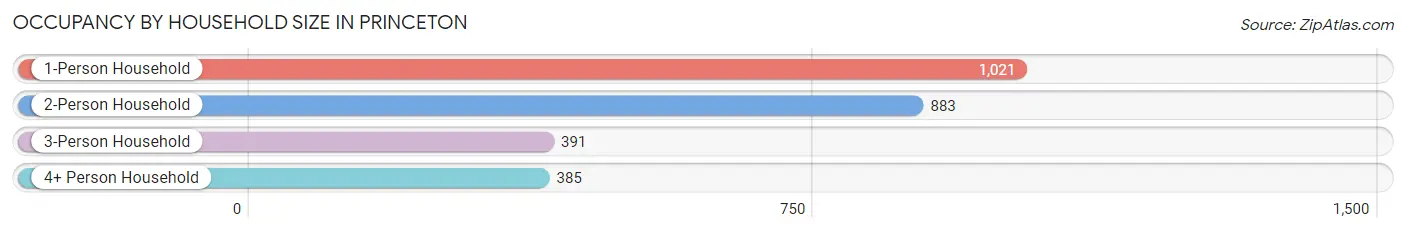
| Household Size | # Housing Units | % Housing Units |
| 1-Person Household | 1,021 | 38.1% |
| 2-Person Household | 883 | 33.0% |
| 3-Person Household | 391 | 14.6% |
| 4+ Person Household | 385 | 14.4% |
| Total Housing Units | 2,680 | 100.0% |
Occupancy by Ownership by Household Size in Princeton
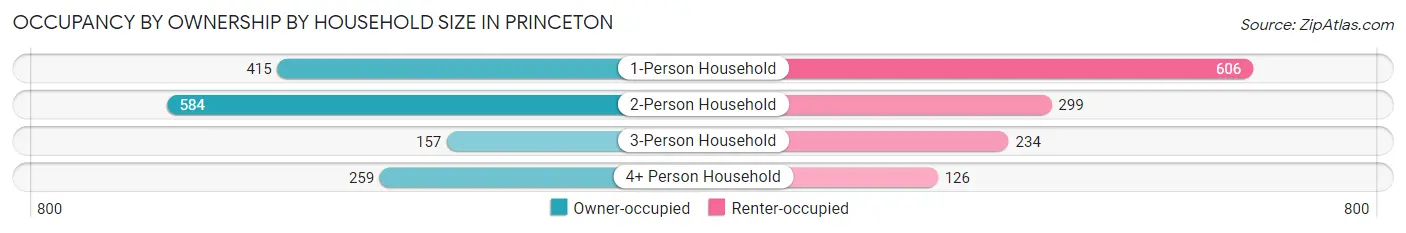
| Household Size | Owner-occupied | Renter-occupied |
| 1-Person Household | 415 (40.6%) | 606 (59.4%) |
| 2-Person Household | 584 (66.1%) | 299 (33.9%) |
| 3-Person Household | 157 (40.2%) | 234 (59.9%) |
| 4+ Person Household | 259 (67.3%) | 126 (32.7%) |
| Total Housing Units | 1,415 (52.8%) | 1,265 (47.2%) |
Occupancy by Educational Attainment in Princeton
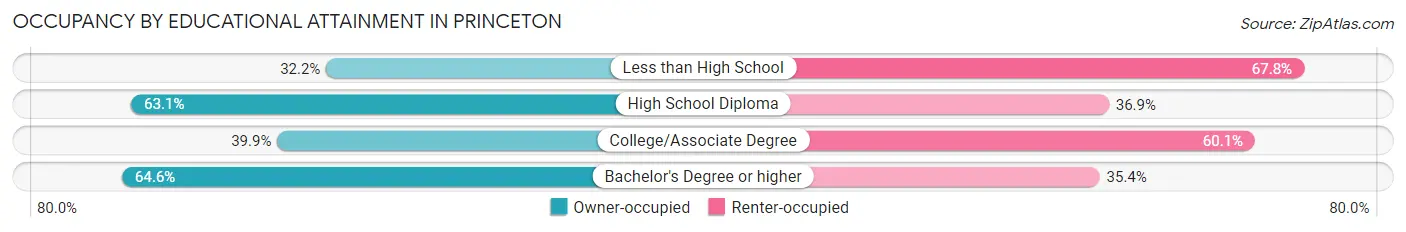
| Household Size | Owner-occupied | Renter-occupied |
| Less than High School | 82 (32.2%) | 173 (67.8%) |
| High School Diploma | 590 (63.1%) | 345 (36.9%) |
| College/Associate Degree | 355 (39.9%) | 534 (60.1%) |
| Bachelor's Degree or higher | 388 (64.6%) | 213 (35.4%) |
Occupancy by Age of Householder in Princeton
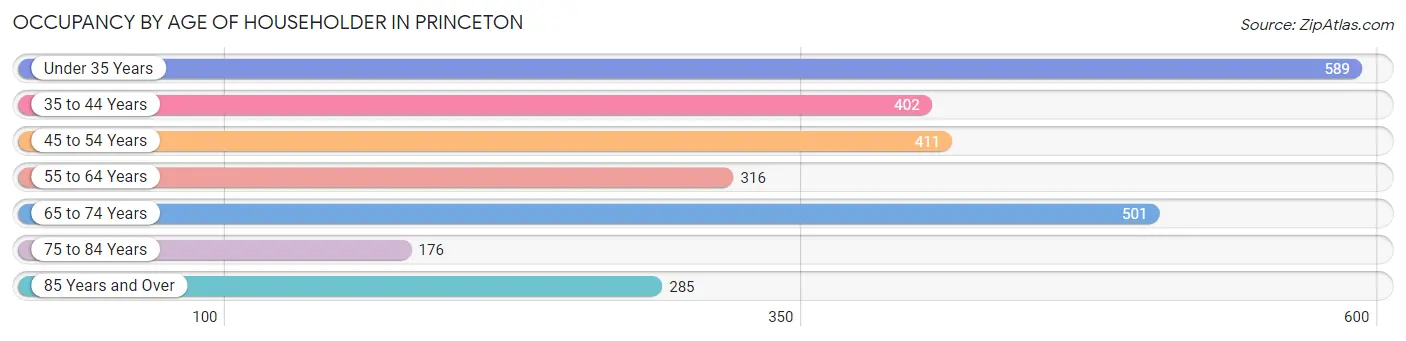
| Age Bracket | # Households | % Households |
| Under 35 Years | 589 | 22.0% |
| 35 to 44 Years | 402 | 15.0% |
| 45 to 54 Years | 411 | 15.3% |
| 55 to 64 Years | 316 | 11.8% |
| 65 to 74 Years | 501 | 18.7% |
| 75 to 84 Years | 176 | 6.6% |
| 85 Years and Over | 285 | 10.6% |
| Total | 2,680 | 100.0% |
Housing Finances in Princeton
Median Income by Occupancy in Princeton
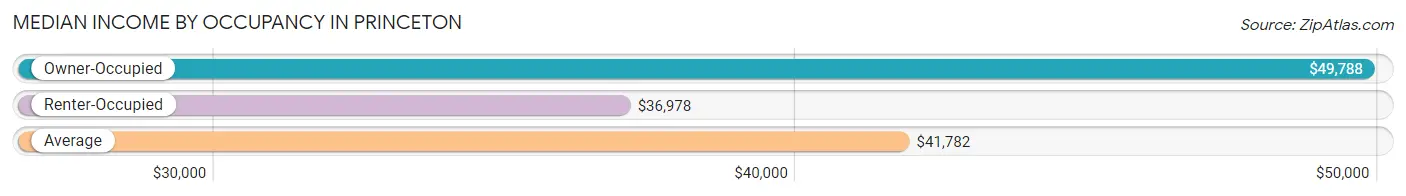
| Occupancy Type | # Households | Median Income |
| Owner-Occupied | 1,415 (52.8%) | $49,788 |
| Renter-Occupied | 1,265 (47.2%) | $36,978 |
| Average | 2,680 (100.0%) | $41,782 |
Occupancy by Householder Income Bracket in Princeton
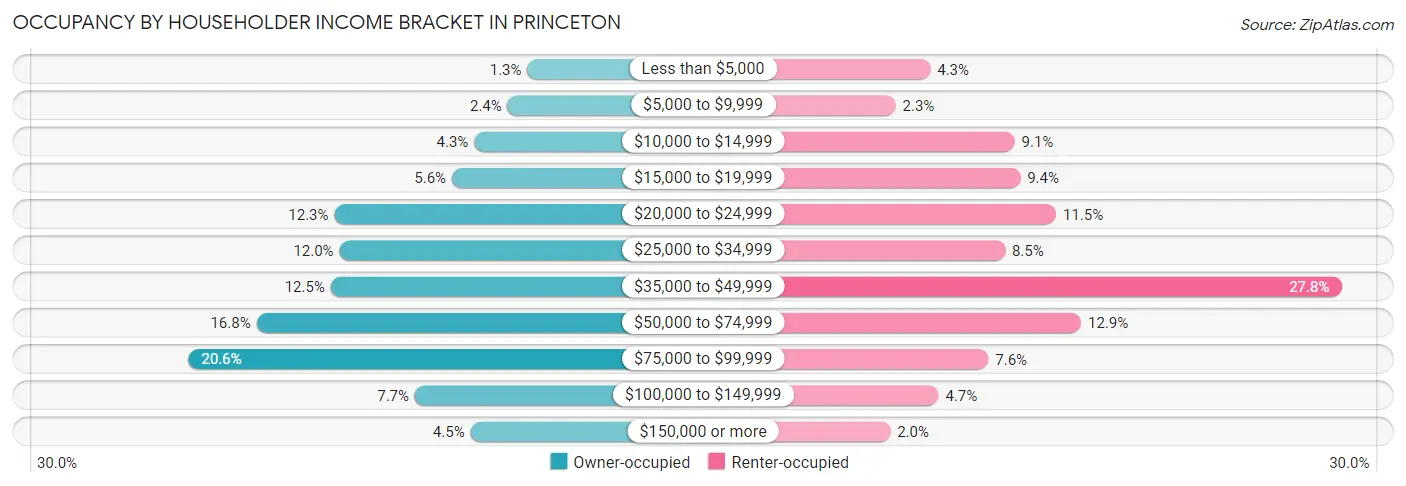
| Income Bracket | Owner-occupied | Renter-occupied |
| Less than $5,000 | 18 (1.3%) | 54 (4.3%) |
| $5,000 to $9,999 | 34 (2.4%) | 29 (2.3%) |
| $10,000 to $14,999 | 61 (4.3%) | 115 (9.1%) |
| $15,000 to $19,999 | 79 (5.6%) | 119 (9.4%) |
| $20,000 to $24,999 | 174 (12.3%) | 145 (11.5%) |
| $25,000 to $34,999 | 170 (12.0%) | 108 (8.5%) |
| $35,000 to $49,999 | 177 (12.5%) | 351 (27.8%) |
| $50,000 to $74,999 | 237 (16.8%) | 163 (12.9%) |
| $75,000 to $99,999 | 292 (20.6%) | 96 (7.6%) |
| $100,000 to $149,999 | 109 (7.7%) | 60 (4.7%) |
| $150,000 or more | 64 (4.5%) | 25 (2.0%) |
| Total | 1,415 (100.0%) | 1,265 (100.0%) |
Monthly Housing Cost Tiers in Princeton
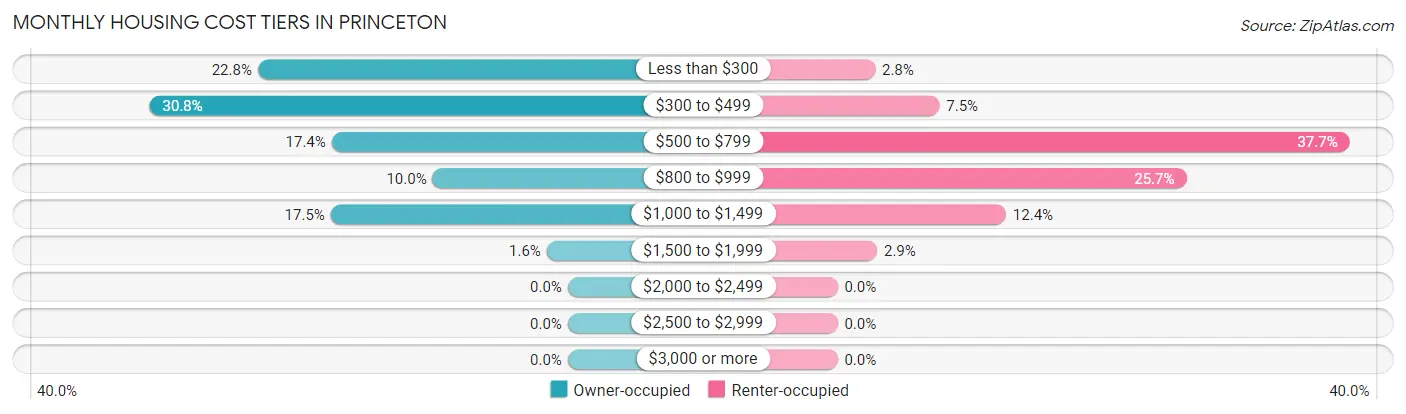
| Monthly Cost | Owner-occupied | Renter-occupied |
| Less than $300 | 323 (22.8%) | 35 (2.8%) |
| $300 to $499 | 436 (30.8%) | 95 (7.5%) |
| $500 to $799 | 246 (17.4%) | 477 (37.7%) |
| $800 to $999 | 141 (10.0%) | 325 (25.7%) |
| $1,000 to $1,499 | 247 (17.5%) | 157 (12.4%) |
| $1,500 to $1,999 | 22 (1.5%) | 37 (2.9%) |
| $2,000 to $2,499 | 0 (0.0%) | 0 (0.0%) |
| $2,500 to $2,999 | 0 (0.0%) | 0 (0.0%) |
| $3,000 or more | 0 (0.0%) | 0 (0.0%) |
| Total | 1,415 (100.0%) | 1,265 (100.0%) |
Physical Housing Characteristics in Princeton
Housing Structures in Princeton
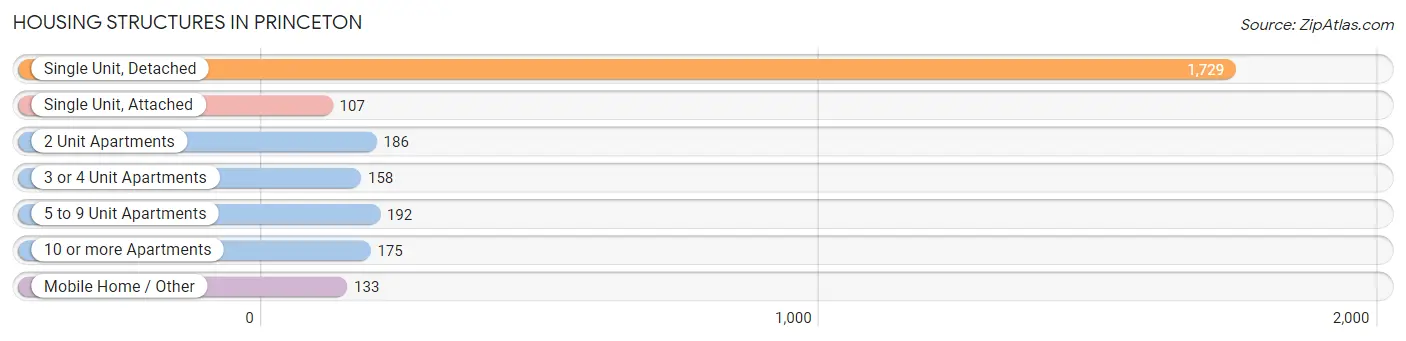
| Structure Type | # Housing Units | % Housing Units |
| Single Unit, Detached | 1,729 | 64.5% |
| Single Unit, Attached | 107 | 4.0% |
| 2 Unit Apartments | 186 | 6.9% |
| 3 or 4 Unit Apartments | 158 | 5.9% |
| 5 to 9 Unit Apartments | 192 | 7.2% |
| 10 or more Apartments | 175 | 6.5% |
| Mobile Home / Other | 133 | 5.0% |
| Total | 2,680 | 100.0% |
Housing Structures by Occupancy in Princeton
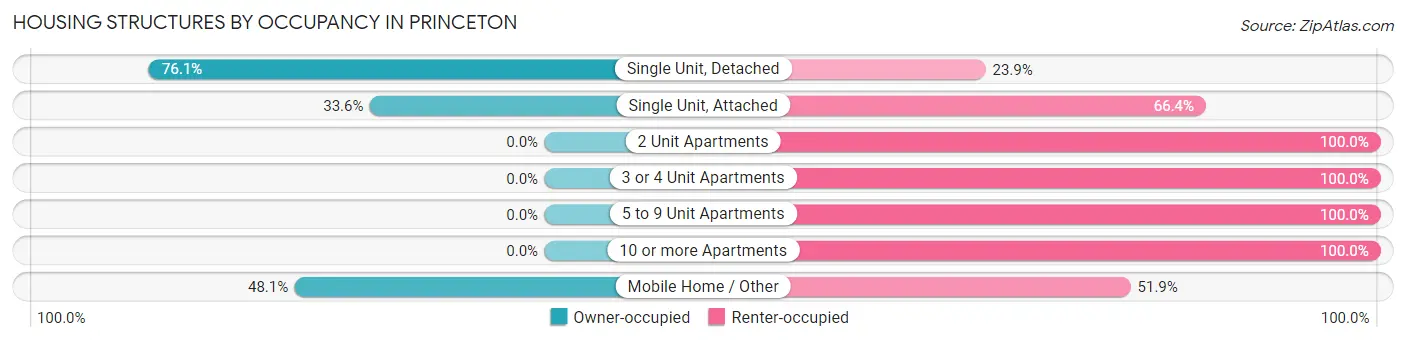
| Structure Type | Owner-occupied | Renter-occupied |
| Single Unit, Detached | 1,315 (76.1%) | 414 (23.9%) |
| Single Unit, Attached | 36 (33.6%) | 71 (66.4%) |
| 2 Unit Apartments | 0 (0.0%) | 186 (100.0%) |
| 3 or 4 Unit Apartments | 0 (0.0%) | 158 (100.0%) |
| 5 to 9 Unit Apartments | 0 (0.0%) | 192 (100.0%) |
| 10 or more Apartments | 0 (0.0%) | 175 (100.0%) |
| Mobile Home / Other | 64 (48.1%) | 69 (51.9%) |
| Total | 1,415 (52.8%) | 1,265 (47.2%) |
Housing Structures by Number of Rooms in Princeton
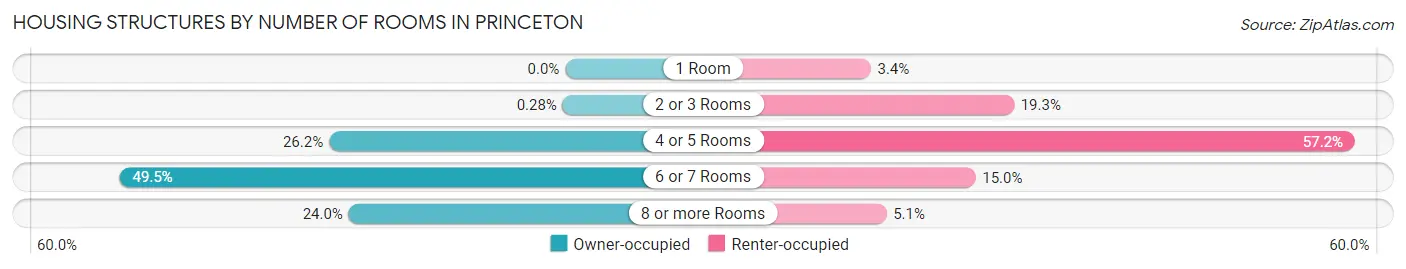
| Number of Rooms | Owner-occupied | Renter-occupied |
| 1 Room | 0 (0.0%) | 43 (3.4%) |
| 2 or 3 Rooms | 4 (0.3%) | 244 (19.3%) |
| 4 or 5 Rooms | 371 (26.2%) | 723 (57.2%) |
| 6 or 7 Rooms | 700 (49.5%) | 190 (15.0%) |
| 8 or more Rooms | 340 (24.0%) | 65 (5.1%) |
| Total | 1,415 (100.0%) | 1,265 (100.0%) |
Housing Structure by Heating Type in Princeton
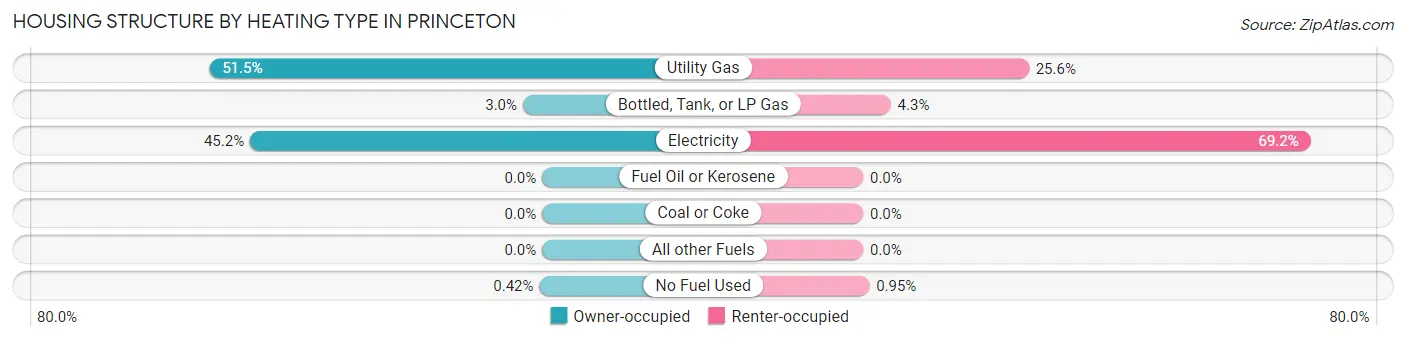
| Heating Type | Owner-occupied | Renter-occupied |
| Utility Gas | 728 (51.4%) | 324 (25.6%) |
| Bottled, Tank, or LP Gas | 42 (3.0%) | 54 (4.3%) |
| Electricity | 639 (45.2%) | 875 (69.2%) |
| Fuel Oil or Kerosene | 0 (0.0%) | 0 (0.0%) |
| Coal or Coke | 0 (0.0%) | 0 (0.0%) |
| All other Fuels | 0 (0.0%) | 0 (0.0%) |
| No Fuel Used | 6 (0.4%) | 12 (0.9%) |
| Total | 1,415 (100.0%) | 1,265 (100.0%) |
Household Vehicle Usage in Princeton
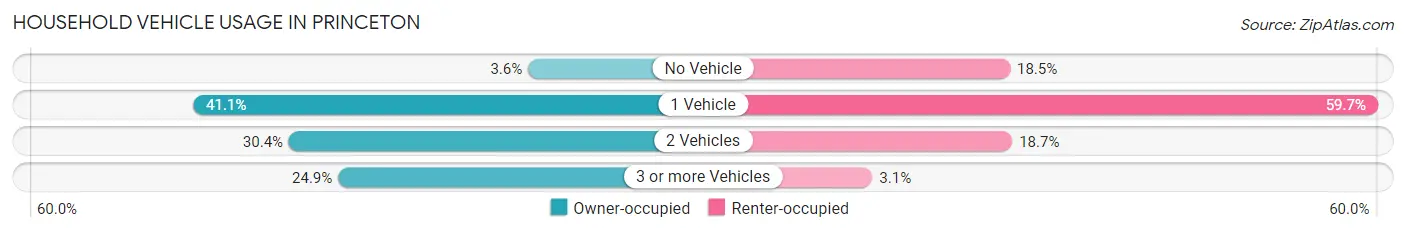
| Vehicles per Household | Owner-occupied | Renter-occupied |
| No Vehicle | 51 (3.6%) | 234 (18.5%) |
| 1 Vehicle | 582 (41.1%) | 755 (59.7%) |
| 2 Vehicles | 430 (30.4%) | 237 (18.7%) |
| 3 or more Vehicles | 352 (24.9%) | 39 (3.1%) |
| Total | 1,415 (100.0%) | 1,265 (100.0%) |
Real Estate & Mortgages in Princeton
Real Estate and Mortgage Overview in Princeton
| Characteristic | Without Mortgage | With Mortgage |
| Housing Units | 951 | 464 |
| Median Property Value | $152,600 | $89,600 |
| Median Household Income | $46,161 | $22 |
| Monthly Housing Costs | $394 | $0 |
| Real Estate Taxes | $601 | $30 |
Property Value by Mortgage Status in Princeton
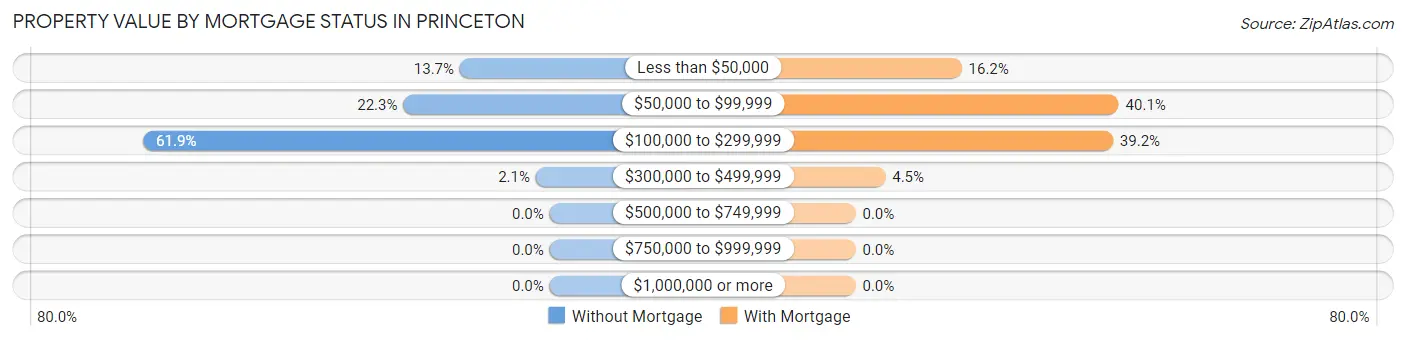
| Property Value | Without Mortgage | With Mortgage |
| Less than $50,000 | 130 (13.7%) | 75 (16.2%) |
| $50,000 to $99,999 | 212 (22.3%) | 186 (40.1%) |
| $100,000 to $299,999 | 589 (61.9%) | 182 (39.2%) |
| $300,000 to $499,999 | 20 (2.1%) | 21 (4.5%) |
| $500,000 to $749,999 | 0 (0.0%) | 0 (0.0%) |
| $750,000 to $999,999 | 0 (0.0%) | 0 (0.0%) |
| $1,000,000 or more | 0 (0.0%) | 0 (0.0%) |
| Total | 951 (100.0%) | 464 (100.0%) |
Household Income by Mortgage Status in Princeton
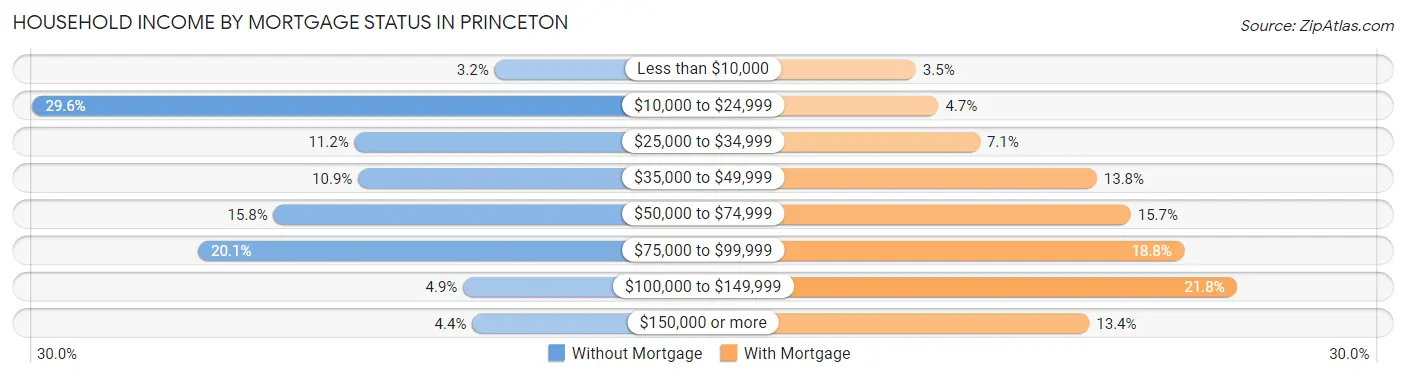
| Household Income | Without Mortgage | With Mortgage |
| Less than $10,000 | 30 (3.2%) | 16 (3.5%) |
| $10,000 to $24,999 | 281 (29.5%) | 22 (4.7%) |
| $25,000 to $34,999 | 106 (11.2%) | 33 (7.1%) |
| $35,000 to $49,999 | 104 (10.9%) | 64 (13.8%) |
| $50,000 to $74,999 | 150 (15.8%) | 73 (15.7%) |
| $75,000 to $99,999 | 191 (20.1%) | 87 (18.8%) |
| $100,000 to $149,999 | 47 (4.9%) | 101 (21.8%) |
| $150,000 or more | 42 (4.4%) | 62 (13.4%) |
| Total | 951 (100.0%) | 464 (100.0%) |
Property Value to Household Income Ratio in Princeton
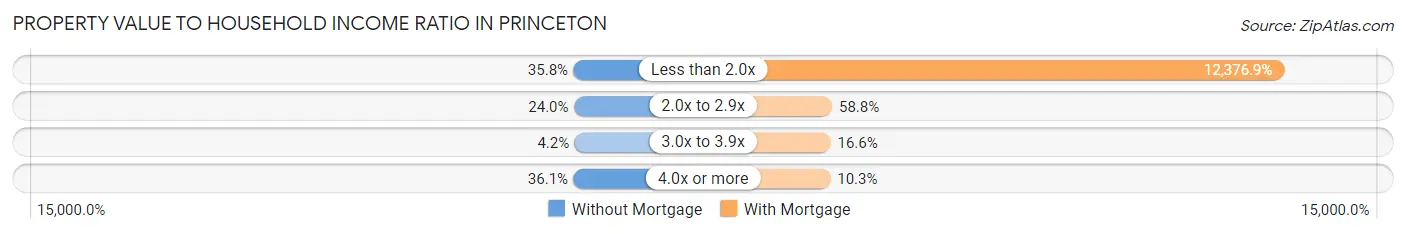
| Value-to-Income Ratio | Without Mortgage | With Mortgage |
| Less than 2.0x | 340 (35.7%) | 57,429 (12,376.9%) |
| 2.0x to 2.9x | 228 (24.0%) | 273 (58.8%) |
| 3.0x to 3.9x | 40 (4.2%) | 77 (16.6%) |
| 4.0x or more | 343 (36.1%) | 48 (10.3%) |
| Total | 951 (100.0%) | 464 (100.0%) |
Real Estate Taxes by Mortgage Status in Princeton
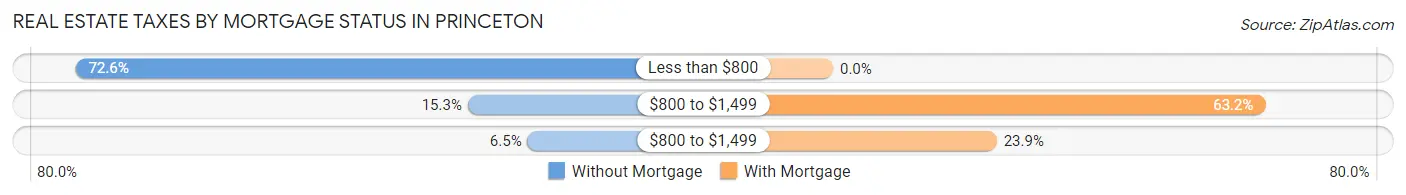
| Property Taxes | Without Mortgage | With Mortgage |
| Less than $800 | 690 (72.6%) | 0 (0.0%) |
| $800 to $1,499 | 145 (15.2%) | 293 (63.1%) |
| $800 to $1,499 | 62 (6.5%) | 111 (23.9%) |
| Total | 951 (100.0%) | 464 (100.0%) |
Health & Disability in Princeton
Health Insurance Coverage by Age in Princeton

| Age Bracket | With Coverage | Without Coverage |
| Under 6 Years | 312 (89.4%) | 37 (10.6%) |
| 6 to 18 Years | 744 (98.8%) | 9 (1.2%) |
| 19 to 25 Years | 387 (82.3%) | 83 (17.7%) |
| 26 to 34 Years | 705 (85.3%) | 122 (14.7%) |
| 35 to 44 Years | 525 (93.4%) | 37 (6.6%) |
| 45 to 54 Years | 786 (96.2%) | 31 (3.8%) |
| 55 to 64 Years | 539 (94.1%) | 34 (5.9%) |
| 65 to 74 Years | 840 (100.0%) | 0 (0.0%) |
| 75 Years and older | 630 (100.0%) | 0 (0.0%) |
| Total | 5,468 (93.9%) | 353 (6.1%) |
Health Insurance Coverage by Citizenship Status in Princeton
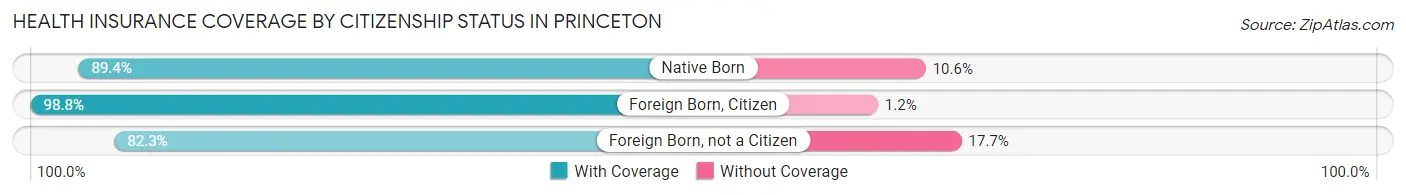
| Citizenship Status | With Coverage | Without Coverage |
| Native Born | 312 (89.4%) | 37 (10.6%) |
| Foreign Born, Citizen | 744 (98.8%) | 9 (1.2%) |
| Foreign Born, not a Citizen | 387 (82.3%) | 83 (17.7%) |
Health Insurance Coverage by Household Income in Princeton
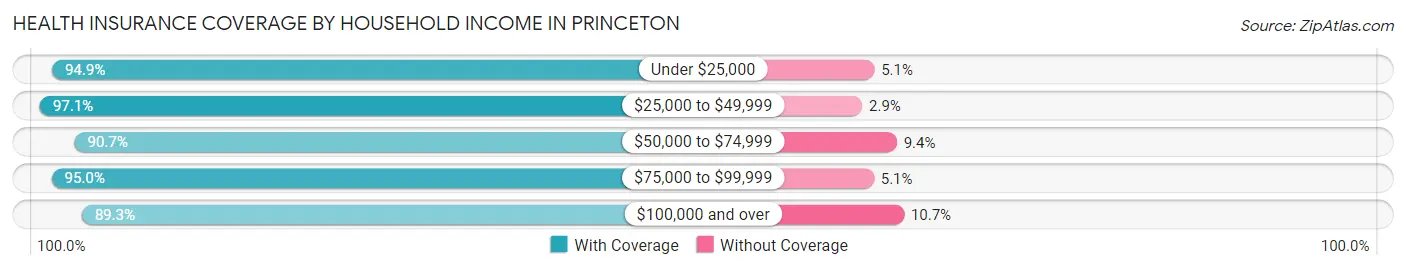
| Household Income | With Coverage | Without Coverage |
| Under $25,000 | 1,348 (94.9%) | 73 (5.1%) |
| $25,000 to $49,999 | 1,522 (97.1%) | 45 (2.9%) |
| $50,000 to $74,999 | 940 (90.6%) | 97 (9.3%) |
| $75,000 to $99,999 | 903 (95.0%) | 48 (5.1%) |
| $100,000 and over | 750 (89.3%) | 90 (10.7%) |
Public vs Private Health Insurance Coverage by Age in Princeton
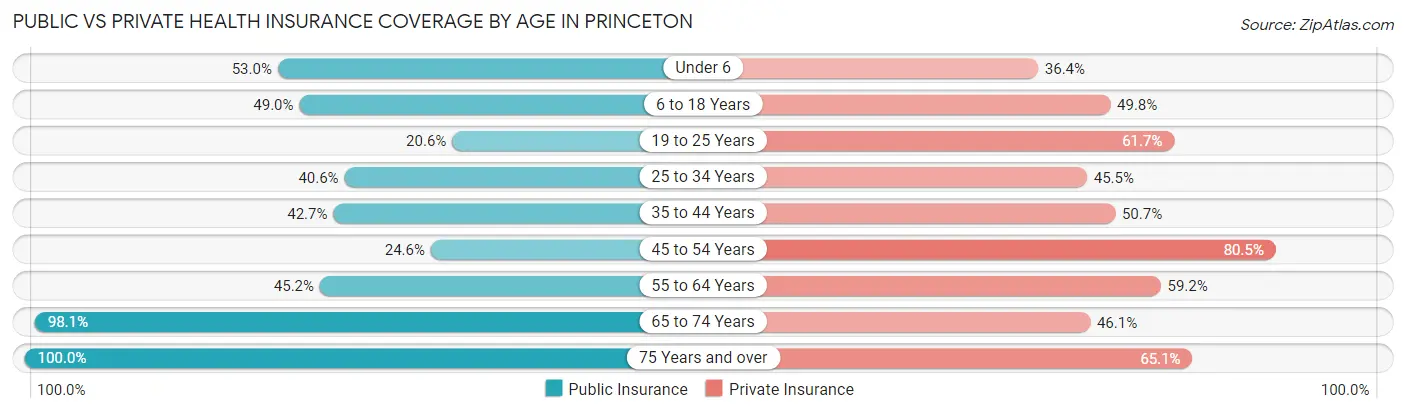
| Age Bracket | Public Insurance | Private Insurance |
| Under 6 | 185 (53.0%) | 127 (36.4%) |
| 6 to 18 Years | 369 (49.0%) | 375 (49.8%) |
| 19 to 25 Years | 97 (20.6%) | 290 (61.7%) |
| 25 to 34 Years | 336 (40.6%) | 376 (45.5%) |
| 35 to 44 Years | 240 (42.7%) | 285 (50.7%) |
| 45 to 54 Years | 201 (24.6%) | 658 (80.5%) |
| 55 to 64 Years | 259 (45.2%) | 339 (59.2%) |
| 65 to 74 Years | 824 (98.1%) | 387 (46.1%) |
| 75 Years and over | 630 (100.0%) | 410 (65.1%) |
| Total | 3,141 (54.0%) | 3,247 (55.8%) |
Disability Status by Sex by Age in Princeton
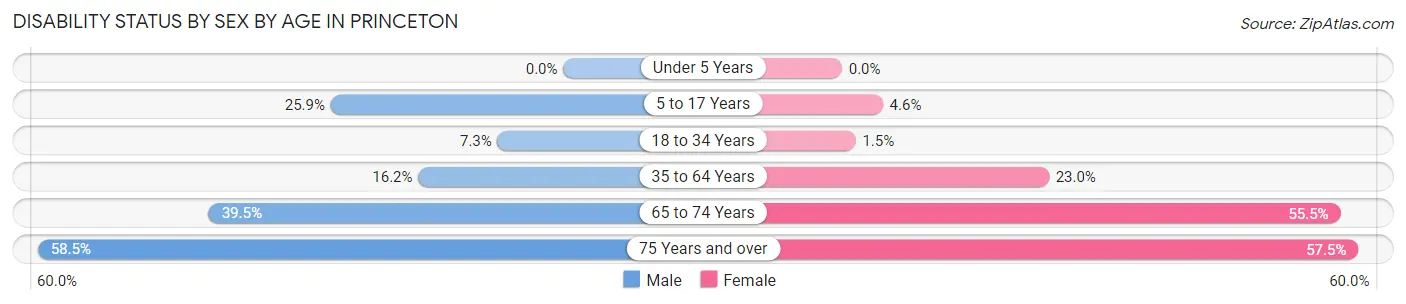
| Age Bracket | Male | Female |
| Under 5 Years | 0 (0.0%) | 0 (0.0%) |
| 5 to 17 Years | 115 (25.9%) | 13 (4.5%) |
| 18 to 34 Years | 45 (7.3%) | 11 (1.5%) |
| 35 to 64 Years | 140 (16.2%) | 250 (23.0%) |
| 65 to 74 Years | 171 (39.5%) | 226 (55.5%) |
| 75 Years and over | 209 (58.5%) | 157 (57.5%) |
Disability Class by Sex by Age in Princeton
Disability Class: Hearing Difficulty
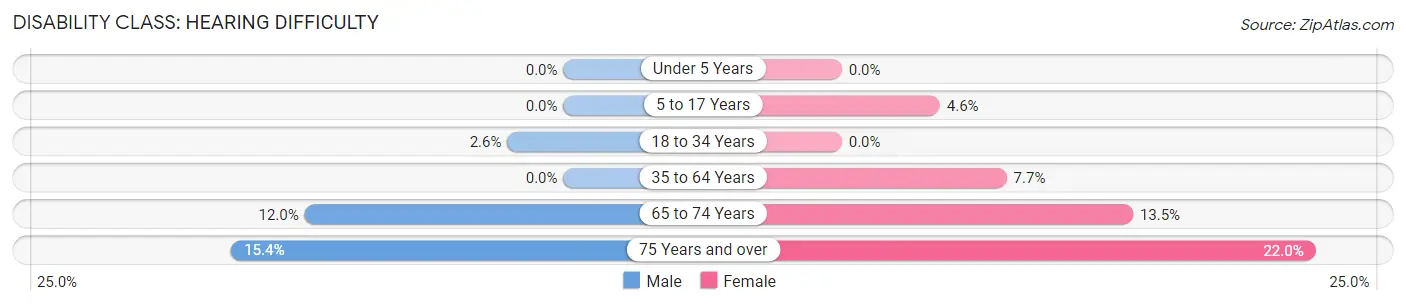
| Age Bracket | Male | Female |
| Under 5 Years | 0 (0.0%) | 0 (0.0%) |
| 5 to 17 Years | 0 (0.0%) | 13 (4.5%) |
| 18 to 34 Years | 16 (2.6%) | 0 (0.0%) |
| 35 to 64 Years | 0 (0.0%) | 83 (7.6%) |
| 65 to 74 Years | 52 (12.0%) | 55 (13.5%) |
| 75 Years and over | 55 (15.4%) | 60 (22.0%) |
Disability Class: Vision Difficulty
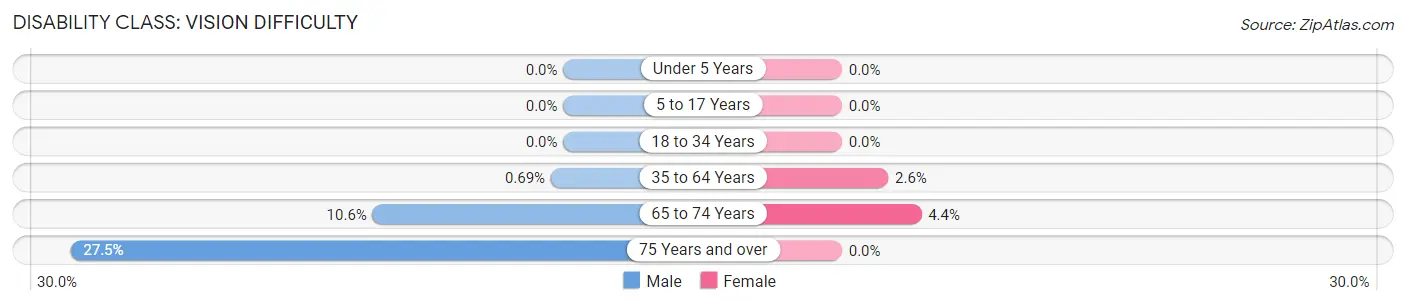
| Age Bracket | Male | Female |
| Under 5 Years | 0 (0.0%) | 0 (0.0%) |
| 5 to 17 Years | 0 (0.0%) | 0 (0.0%) |
| 18 to 34 Years | 0 (0.0%) | 0 (0.0%) |
| 35 to 64 Years | 6 (0.7%) | 28 (2.6%) |
| 65 to 74 Years | 46 (10.6%) | 18 (4.4%) |
| 75 Years and over | 98 (27.5%) | 0 (0.0%) |
Disability Class: Cognitive Difficulty
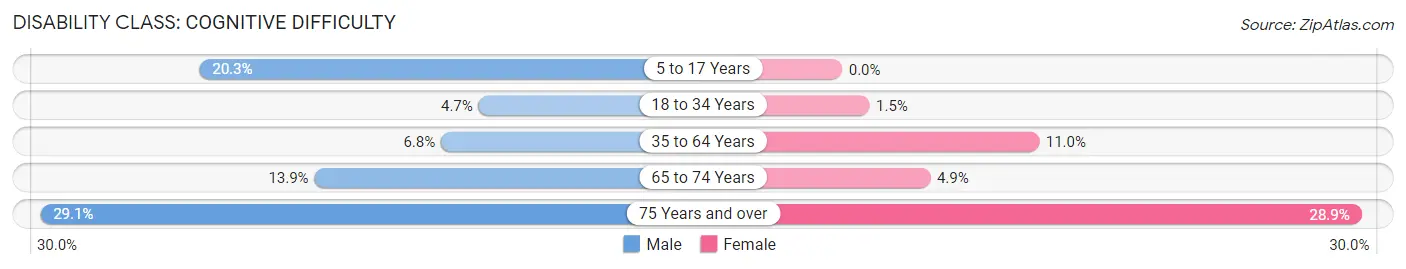
| Age Bracket | Male | Female |
| 5 to 17 Years | 90 (20.3%) | 0 (0.0%) |
| 18 to 34 Years | 29 (4.7%) | 11 (1.5%) |
| 35 to 64 Years | 59 (6.8%) | 119 (11.0%) |
| 65 to 74 Years | 60 (13.9%) | 20 (4.9%) |
| 75 Years and over | 104 (29.1%) | 79 (28.9%) |
Disability Class: Ambulatory Difficulty
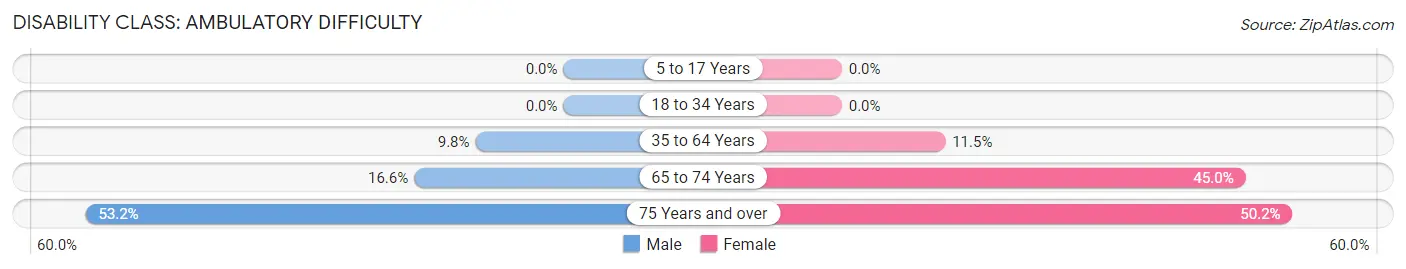
| Age Bracket | Male | Female |
| 5 to 17 Years | 0 (0.0%) | 0 (0.0%) |
| 18 to 34 Years | 0 (0.0%) | 0 (0.0%) |
| 35 to 64 Years | 85 (9.8%) | 125 (11.5%) |
| 65 to 74 Years | 72 (16.6%) | 183 (45.0%) |
| 75 Years and over | 190 (53.2%) | 137 (50.2%) |
Disability Class: Self-Care Difficulty
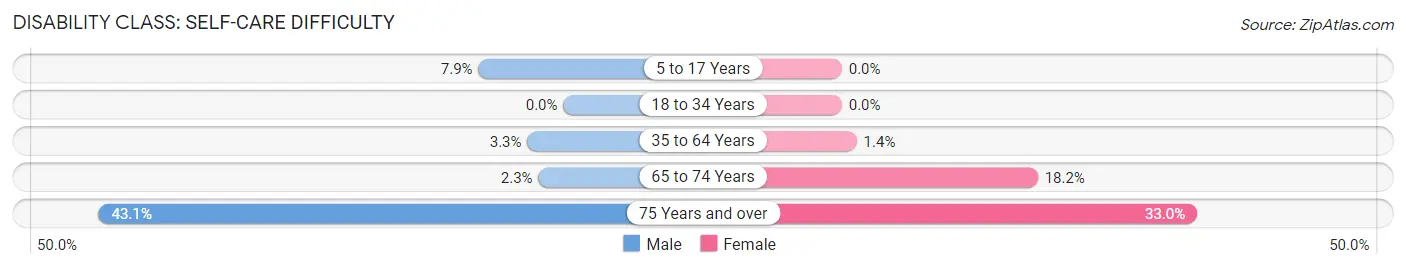
| Age Bracket | Male | Female |
| 5 to 17 Years | 35 (7.9%) | 0 (0.0%) |
| 18 to 34 Years | 0 (0.0%) | 0 (0.0%) |
| 35 to 64 Years | 29 (3.3%) | 15 (1.4%) |
| 65 to 74 Years | 10 (2.3%) | 74 (18.2%) |
| 75 Years and over | 154 (43.1%) | 90 (33.0%) |
Technology Access in Princeton
Computing Device Access in Princeton
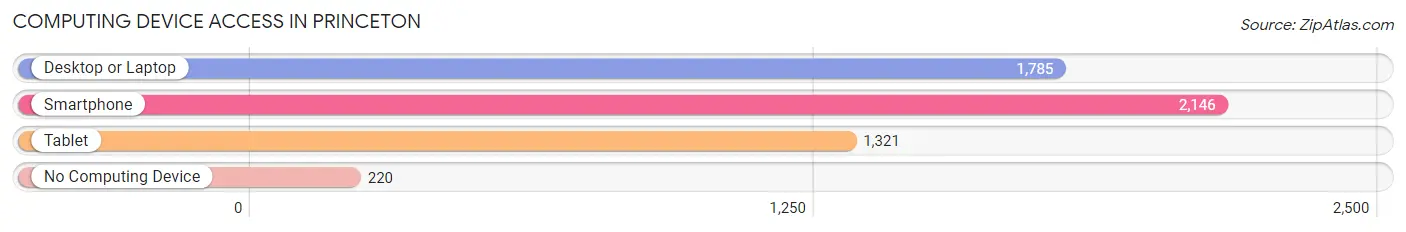
| Device Type | # Households | % Households |
| Desktop or Laptop | 1,785 | 66.6% |
| Smartphone | 2,146 | 80.1% |
| Tablet | 1,321 | 49.3% |
| No Computing Device | 220 | 8.2% |
| Total | 2,680 | 100.0% |
Internet Access in Princeton
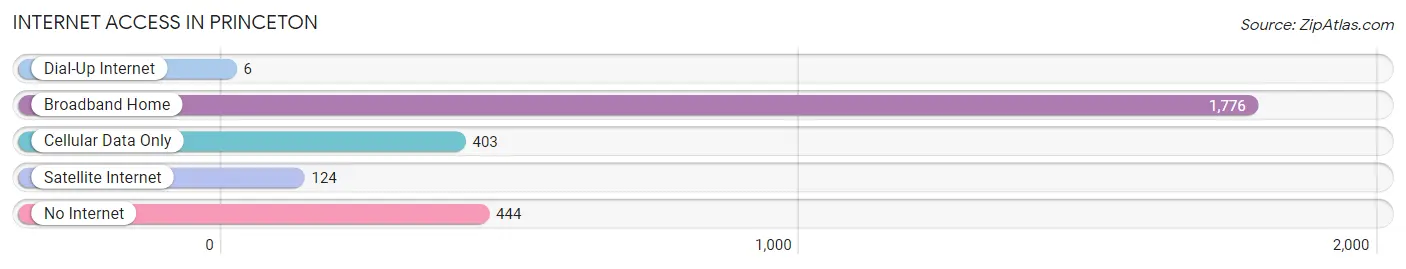
| Internet Type | # Households | % Households |
| Dial-Up Internet | 6 | 0.2% |
| Broadband Home | 1,776 | 66.3% |
| Cellular Data Only | 403 | 15.0% |
| Satellite Internet | 124 | 4.6% |
| No Internet | 444 | 16.6% |
| Total | 2,680 | 100.0% |
Princeton Summary
Princeton, West Virginia is a small city located in the Appalachian Mountains of West Virginia. It is the county seat of Mercer County and is located in the southern part of the state. The city has a population of 6,432 as of the 2010 census.
History
The area that is now Princeton was first settled in 1745 by William Bailey and his family. The town was originally known as Baileytown, but was later renamed Princeton in 1837 after the Revolutionary War hero General Hugh Mercer. The town was officially incorporated in 1838.
During the Civil War, Princeton was a major supply center for the Confederate Army. The town was the site of several skirmishes and battles, including the Battle of Princeton in 1864. After the war, the town began to grow and prosper. The railroad arrived in 1873, and the town was connected to the rest of the state by the West Virginia Central and Pittsburgh Railway.
Geography
Princeton is located in the Appalachian Mountains of West Virginia. It is situated in the southern part of the state, about 50 miles south of Charleston. The city is located in the Bluestone River Valley, and is surrounded by mountains and hills. The city has a total area of 4.2 square miles, all of which is land.
Economy
The economy of Princeton is largely based on the coal industry. The city is home to several coal mines, and the coal industry is the largest employer in the area. Other industries in the area include manufacturing, retail, and tourism.
Demographics
As of the 2010 census, the population of Princeton was 6,432. The racial makeup of the city was 95.3% White, 2.2% African American, 0.3% Native American, 0.4% Asian, 0.1% Pacific Islander, 0.4% from other races, and 1.3% from two or more races. Hispanic or Latino of any race were 1.2% of the population.
The median income for a household in the city was $30,938, and the median income for a family was $37,917. The per capita income for the city was $17,845. About 17.2% of families and 20.2% of the population were below the poverty line, including 28.2% of those under age 18 and 11.2% of those age 65 or over.
Common Questions
What is Per Capita Income in Princeton?
Per Capita income in Princeton is $24,735.
What is the Median Family Income in Princeton?
Median Family Income in Princeton is $51,646.
What is the Median Household income in Princeton?
Median Household Income in Princeton is $41,782.
What is Income or Wage Gap in Princeton?
Income or Wage Gap in Princeton is 38.4%.
Women in Princeton earn 61.6 cents for every dollar earned by a man.
What is Inequality or Gini Index in Princeton?
Inequality or Gini Index in Princeton is 0.41.
What is the Total Population of Princeton?
Total Population of Princeton is 5,833.
What is the Total Male Population of Princeton?
Total Male Population of Princeton is 2,880.
What is the Total Female Population of Princeton?
Total Female Population of Princeton is 2,953.
What is the Ratio of Males per 100 Females in Princeton?
There are 97.53 Males per 100 Females in Princeton.
What is the Ratio of Females per 100 Males in Princeton?
There are 102.53 Females per 100 Males in Princeton.
What is the Median Population Age in Princeton?
Median Population Age in Princeton is 44.3 Years.
What is the Average Family Size in Princeton
Average Family Size in Princeton is 2.8 People.
What is the Average Household Size in Princeton
Average Household Size in Princeton is 2.2 People.
How Large is the Labor Force in Princeton?
There are 2,555 People in the Labor Forcein in Princeton.
What is the Percentage of People in the Labor Force in Princeton?
52.5% of People are in the Labor Force in Princeton.
What is the Unemployment Rate in Princeton?
Unemployment Rate in Princeton is 5.2%.