Weirton, WV Map & Demographics
Weirton Map
Weirton Overview
$35,662
PER CAPITA INCOME
$72,141
AVG FAMILY INCOME
$57,373
AVG HOUSEHOLD INCOME
39.1%
WAGE / INCOME GAP [ % ]
60.9¢/ $1
WAGE / INCOME GAP [ $ ]
$10,831
FAMILY INCOME DEFICIT
0.46
INEQUALITY / GINI INDEX
18,971
TOTAL POPULATION
9,434
MALE POPULATION
9,537
FEMALE POPULATION
98.92
MALES / 100 FEMALES
101.09
FEMALES / 100 MALES
45.5
MEDIAN AGE
2.9
AVG FAMILY SIZE
2.1
AVG HOUSEHOLD SIZE
9,373
LABOR FORCE [ PEOPLE ]
58.7%
PERCENT IN LABOR FORCE
7.8%
UNEMPLOYMENT RATE
Weirton Zip Codes
Income in Weirton
Income Overview in Weirton
Per Capita Income in Weirton is $35,662, while median incomes of families and households are $72,141 and $57,373 respectively.
| Characteristic | Number | Measure |
| Per Capita Income | 18,971 | $35,662 |
| Median Family Income | 4,719 | $72,141 |
| Mean Family Income | 4,719 | $88,225 |
| Median Household Income | 8,762 | $57,373 |
| Mean Household Income | 8,762 | $74,424 |
| Income Deficit | 4,719 | $10,831 |
| Wage / Income Gap (%) | 18,971 | 39.10% |
| Wage / Income Gap ($) | 18,971 | 60.90¢ per $1 |
| Gini / Inequality Index | 18,971 | 0.46 |
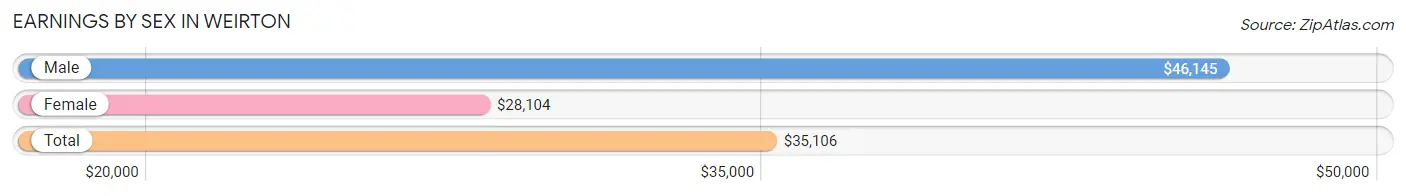
Earnings by Sex in Weirton
Average Earnings in Weirton are $35,106, $46,145 for men and $28,104 for women, a difference of 39.1%.
| Sex | Number | Average Earnings |
| Male | 5,241 (55.2%) | $46,145 |
| Female | 4,248 (44.8%) | $28,104 |
| Total | 9,489 (100.0%) | $35,106 |
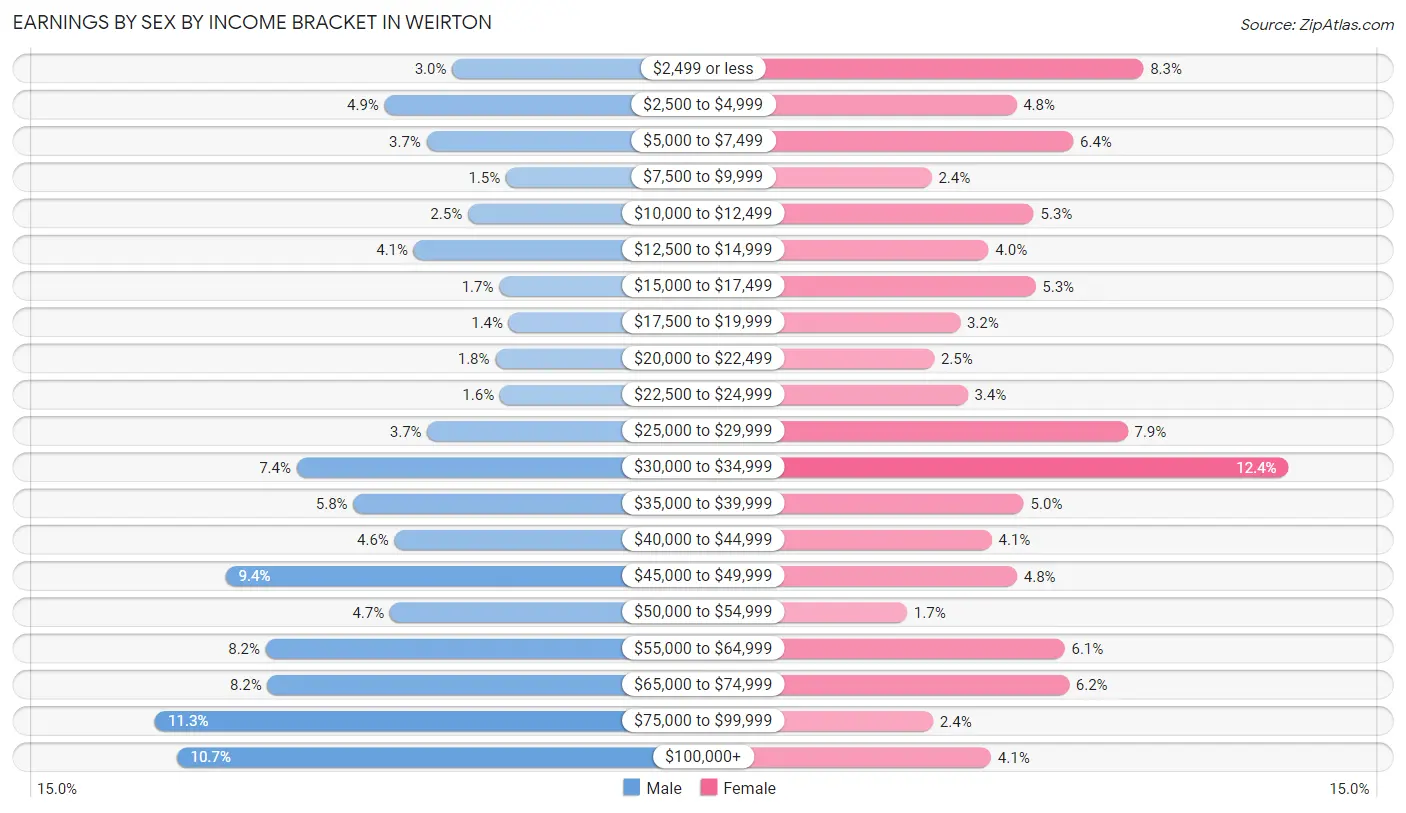
Earnings by Sex by Income Bracket in Weirton
The most common earnings brackets in Weirton are $75,000 to $99,999 for men (594 | 11.3%) and $30,000 to $34,999 for women (527 | 12.4%).
| Income | Male | Female |
| $2,499 or less | 156 (3.0%) | 354 (8.3%) |
| $2,500 to $4,999 | 256 (4.9%) | 202 (4.8%) |
| $5,000 to $7,499 | 194 (3.7%) | 270 (6.4%) |
| $7,500 to $9,999 | 77 (1.5%) | 101 (2.4%) |
| $10,000 to $12,499 | 133 (2.5%) | 223 (5.2%) |
| $12,500 to $14,999 | 213 (4.1%) | 169 (4.0%) |
| $15,000 to $17,499 | 87 (1.7%) | 225 (5.3%) |
| $17,500 to $19,999 | 73 (1.4%) | 135 (3.2%) |
| $20,000 to $22,499 | 93 (1.8%) | 104 (2.5%) |
| $22,500 to $24,999 | 86 (1.6%) | 144 (3.4%) |
| $25,000 to $29,999 | 193 (3.7%) | 335 (7.9%) |
| $30,000 to $34,999 | 385 (7.3%) | 527 (12.4%) |
| $35,000 to $39,999 | 302 (5.8%) | 211 (5.0%) |
| $40,000 to $44,999 | 241 (4.6%) | 173 (4.1%) |
| $45,000 to $49,999 | 490 (9.3%) | 203 (4.8%) |
| $50,000 to $54,999 | 248 (4.7%) | 72 (1.7%) |
| $55,000 to $64,999 | 431 (8.2%) | 260 (6.1%) |
| $65,000 to $74,999 | 428 (8.2%) | 265 (6.2%) |
| $75,000 to $99,999 | 594 (11.3%) | 103 (2.4%) |
| $100,000+ | 561 (10.7%) | 172 (4.1%) |
| Total | 5,241 (100.0%) | 4,248 (100.0%) |
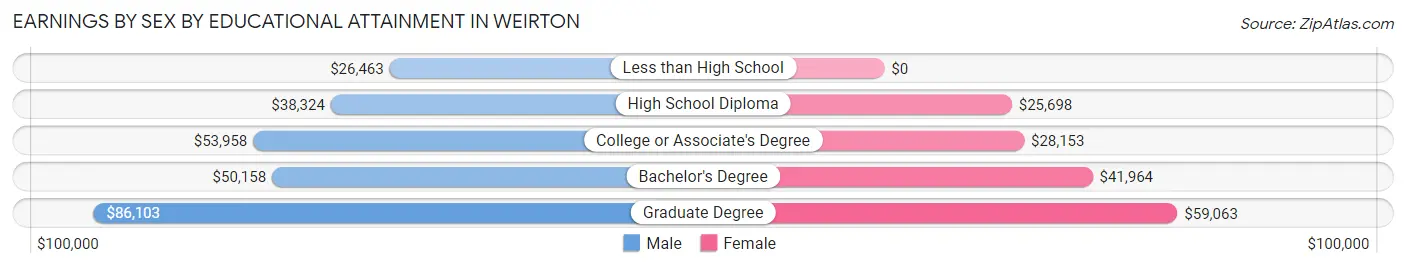
Earnings by Sex by Educational Attainment in Weirton
Average earnings in Weirton are $48,294 for men and $30,984 for women, a difference of 35.8%. Men with an educational attainment of graduate degree enjoy the highest average annual earnings of $86,103, while those with less than high school education earn the least with $26,463. Women with an educational attainment of graduate degree earn the most with the average annual earnings of $59,063, while those with high school diploma education have the smallest earnings of $25,698.
| Educational Attainment | Male Income | Female Income |
| Less than High School | $26,463 | $0 |
| High School Diploma | $38,324 | $25,698 |
| College or Associate's Degree | $53,958 | $28,153 |
| Bachelor's Degree | $50,158 | $41,964 |
| Graduate Degree | $86,103 | $59,063 |
| Total | $48,294 | $30,984 |
Family Income in Weirton
Family Income Brackets in Weirton
According to the Weirton family income data, there are 1,029 families falling into the $50,000 to $74,999 income range, which is the most common income bracket and makes up 21.8% of all families. Conversely, the $10,000 to $14,999 income bracket is the least frequent group with only 85 families (1.8%) belonging to this category.
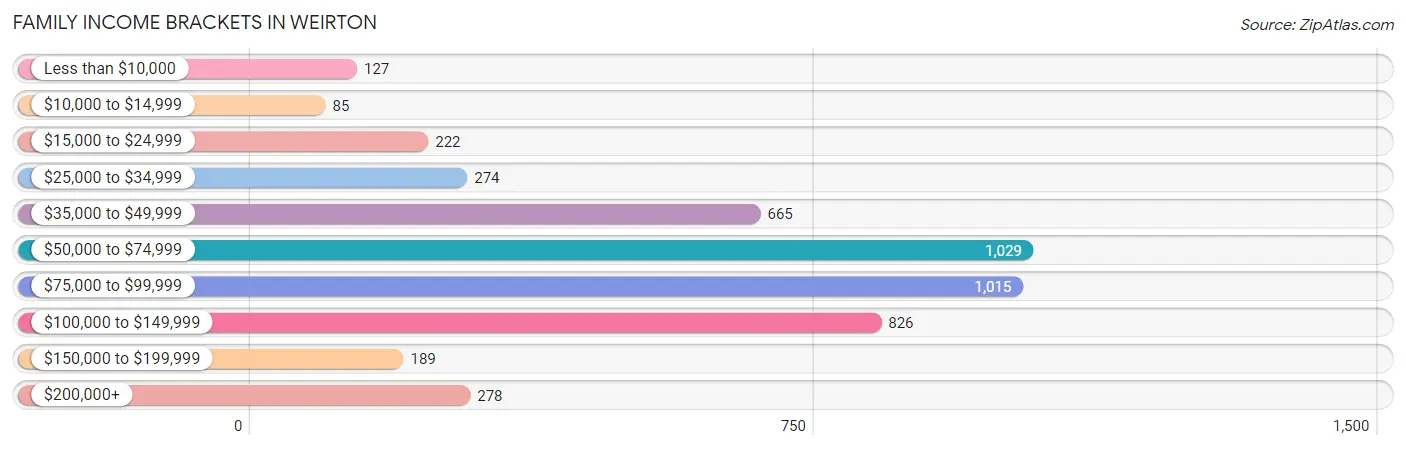
| Income Bracket | # Families | % Families |
| Less than $10,000 | 127 | 2.7% |
| $10,000 to $14,999 | 85 | 1.8% |
| $15,000 to $24,999 | 222 | 4.7% |
| $25,000 to $34,999 | 274 | 5.8% |
| $35,000 to $49,999 | 665 | 14.1% |
| $50,000 to $74,999 | 1,029 | 21.8% |
| $75,000 to $99,999 | 1,015 | 21.5% |
| $100,000 to $149,999 | 826 | 17.5% |
| $150,000 to $199,999 | 189 | 4.0% |
| $200,000+ | 278 | 5.9% |
Family Income by Famaliy Size in Weirton
7+ person families (58 | 1.2%) account for the highest median family income in Weirton with $126,207 per family, while 2-person families (2,679 | 56.8%) have the highest median income of $33,267 per family member.
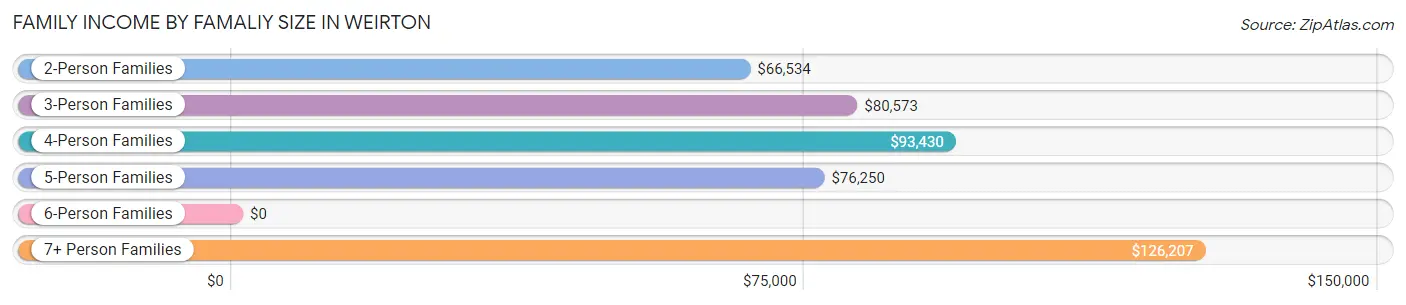
| Income Bracket | # Families | Median Income |
| 2-Person Families | 2,679 (56.8%) | $66,534 |
| 3-Person Families | 1,055 (22.4%) | $80,573 |
| 4-Person Families | 703 (14.9%) | $93,430 |
| 5-Person Families | 192 (4.1%) | $76,250 |
| 6-Person Families | 32 (0.7%) | $0 |
| 7+ Person Families | 58 (1.2%) | $126,207 |
| Total | 4,719 (100.0%) | $72,141 |
Family Income by Number of Earners in Weirton
The median family income in Weirton is $72,141, with families comprising 3+ earners (240) having the highest median family income of $125,862, while families with no earners (1,067) have the lowest median family income of $57,665, accounting for 5.1% and 22.6% of families, respectively.
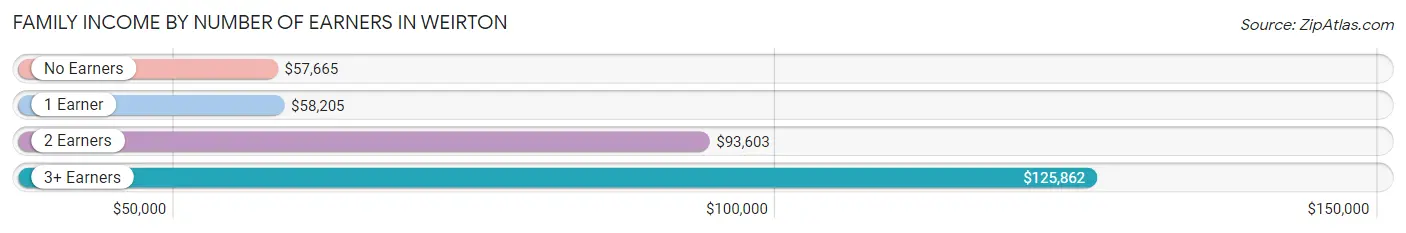
| Number of Earners | # Families | Median Income |
| No Earners | 1,067 (22.6%) | $57,665 |
| 1 Earner | 1,405 (29.8%) | $58,205 |
| 2 Earners | 2,007 (42.5%) | $93,603 |
| 3+ Earners | 240 (5.1%) | $125,862 |
| Total | 4,719 (100.0%) | $72,141 |
Household Income in Weirton
Household Income Brackets in Weirton
With 1,691 households falling in the category, the $50,000 to $74,999 income range is the most frequent in Weirton, accounting for 19.3% of all households. In contrast, only 202 households (2.3%) fall into the $150,000 to $199,999 income bracket, making it the least populous group.
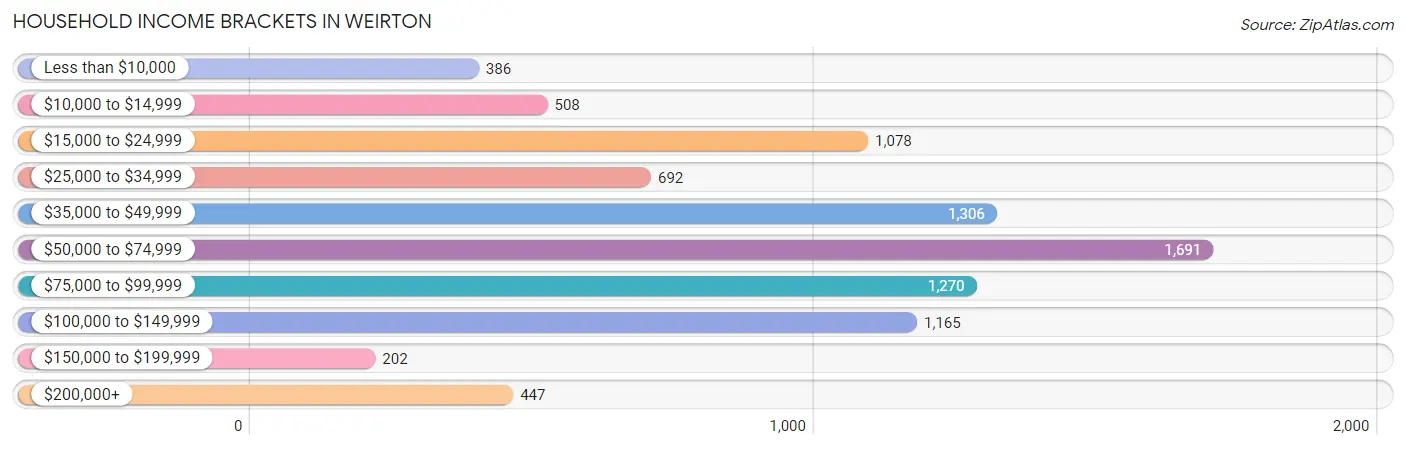
| Income Bracket | # Households | % Households |
| Less than $10,000 | 386 | 4.4% |
| $10,000 to $14,999 | 508 | 5.8% |
| $15,000 to $24,999 | 1,078 | 12.3% |
| $25,000 to $34,999 | 692 | 7.9% |
| $35,000 to $49,999 | 1,306 | 14.9% |
| $50,000 to $74,999 | 1,691 | 19.3% |
| $75,000 to $99,999 | 1,270 | 14.5% |
| $100,000 to $149,999 | 1,165 | 13.3% |
| $150,000 to $199,999 | 202 | 2.3% |
| $200,000+ | 447 | 5.1% |
Household Income by Householder Age in Weirton
The median household income in Weirton is $57,373, with the highest median household income of $68,569 found in the 45 to 64 years age bracket for the primary householder. A total of 3,102 households (35.4%) fall into this category. Meanwhile, the 15 to 24 years age bracket for the primary householder has the lowest median household income of $0, with 200 households (2.3%) in this group.
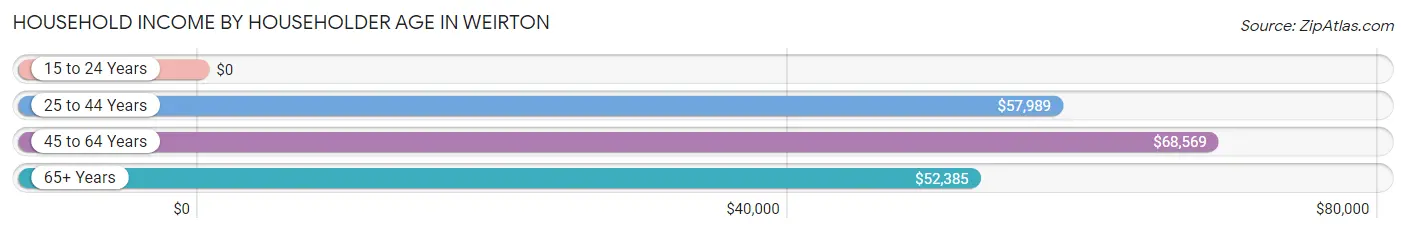
| Income Bracket | # Households | Median Income |
| 15 to 24 Years | 200 (2.3%) | $0 |
| 25 to 44 Years | 2,275 (26.0%) | $57,989 |
| 45 to 64 Years | 3,102 (35.4%) | $68,569 |
| 65+ Years | 3,185 (36.3%) | $52,385 |
| Total | 8,762 (100.0%) | $57,373 |
Poverty in Weirton
Income Below Poverty by Sex and Age in Weirton
With 8.3% poverty level for males and 14.9% for females among the residents of Weirton, 25 to 34 year old males and 18 to 24 year old females are the most vulnerable to poverty, with 234 males (17.3%) and 150 females (28.4%) in their respective age groups living below the poverty level.
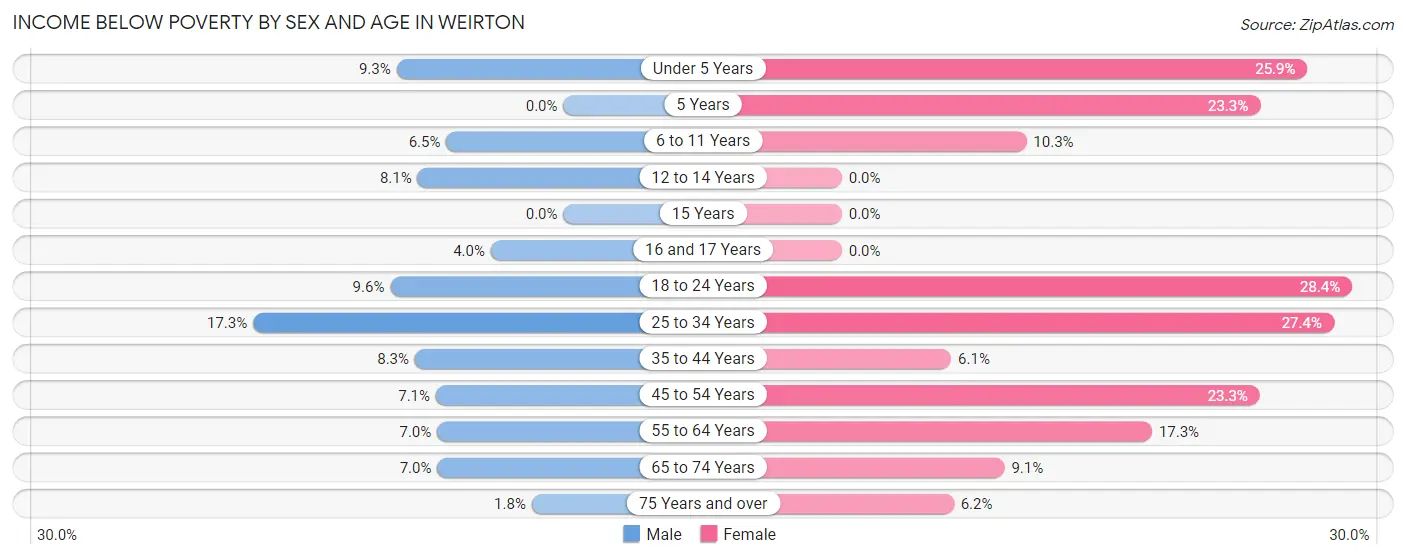
| Age Bracket | Male | Female |
| Under 5 Years | 30 (9.3%) | 134 (25.9%) |
| 5 Years | 0 (0.0%) | 17 (23.3%) |
| 6 to 11 Years | 26 (6.5%) | 65 (10.3%) |
| 12 to 14 Years | 29 (8.1%) | 0 (0.0%) |
| 15 Years | 0 (0.0%) | 0 (0.0%) |
| 16 and 17 Years | 12 (4.0%) | 0 (0.0%) |
| 18 to 24 Years | 53 (9.6%) | 150 (28.4%) |
| 25 to 34 Years | 234 (17.3%) | 304 (27.4%) |
| 35 to 44 Years | 102 (8.3%) | 69 (6.1%) |
| 45 to 54 Years | 89 (7.1%) | 252 (23.3%) |
| 55 to 64 Years | 92 (7.0%) | 223 (17.3%) |
| 65 to 74 Years | 90 (7.0%) | 117 (9.1%) |
| 75 Years and over | 12 (1.8%) | 73 (6.2%) |
| Total | 769 (8.3%) | 1,404 (14.9%) |
Income Above Poverty by Sex and Age in Weirton
According to the poverty statistics in Weirton, males aged 5 years and females aged 12 to 14 years are the age groups that are most secure financially, with 100.0% of males and 100.0% of females in these age groups living above the poverty line.
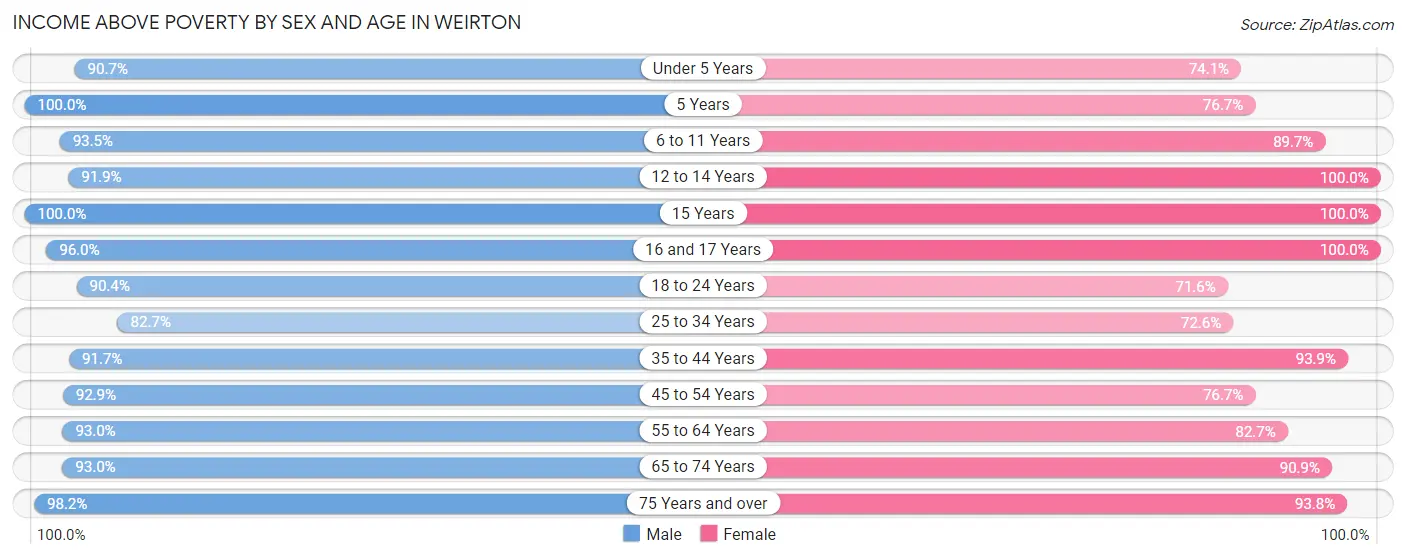
| Age Bracket | Male | Female |
| Under 5 Years | 293 (90.7%) | 383 (74.1%) |
| 5 Years | 177 (100.0%) | 56 (76.7%) |
| 6 to 11 Years | 373 (93.5%) | 567 (89.7%) |
| 12 to 14 Years | 328 (91.9%) | 286 (100.0%) |
| 15 Years | 42 (100.0%) | 91 (100.0%) |
| 16 and 17 Years | 285 (96.0%) | 182 (100.0%) |
| 18 to 24 Years | 497 (90.4%) | 378 (71.6%) |
| 25 to 34 Years | 1,120 (82.7%) | 806 (72.6%) |
| 35 to 44 Years | 1,132 (91.7%) | 1,064 (93.9%) |
| 45 to 54 Years | 1,165 (92.9%) | 831 (76.7%) |
| 55 to 64 Years | 1,217 (93.0%) | 1,068 (82.7%) |
| 65 to 74 Years | 1,192 (93.0%) | 1,174 (90.9%) |
| 75 Years and over | 668 (98.2%) | 1,099 (93.8%) |
| Total | 8,489 (91.7%) | 7,985 (85.1%) |
Income Below Poverty Among Married-Couple Families in Weirton
The poverty statistics for married-couple families in Weirton show that 1.6% or 51 of the total 3,232 families live below the poverty line. Families with no children have the highest poverty rate of 2.3%, comprising of 51 families. On the other hand, families with 1 or 2 children have the lowest poverty rate of 0.0%, which includes 0 families.
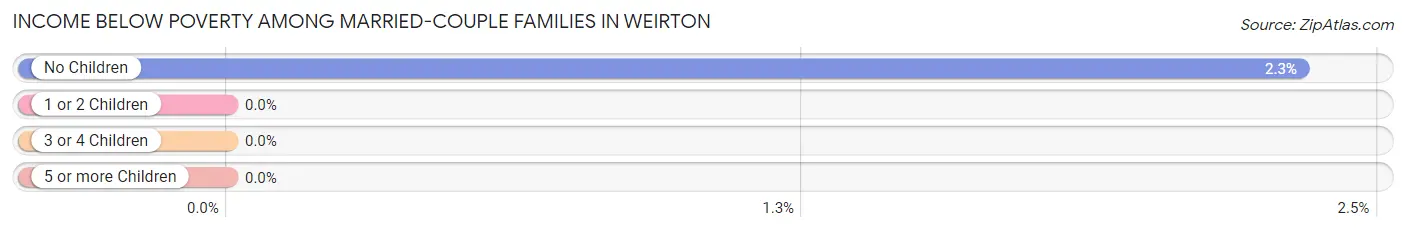
| Children | Above Poverty | Below Poverty |
| No Children | 2,137 (97.7%) | 51 (2.3%) |
| 1 or 2 Children | 937 (100.0%) | 0 (0.0%) |
| 3 or 4 Children | 65 (100.0%) | 0 (0.0%) |
| 5 or more Children | 42 (100.0%) | 0 (0.0%) |
| Total | 3,181 (98.4%) | 51 (1.6%) |
Income Below Poverty Among Single-Parent Households in Weirton
According to the poverty data in Weirton, 20.3% or 101 single-father households and 14.7% or 145 single-mother households are living below the poverty line. Among single-father households, those with 1 or 2 children have the highest poverty rate, with 87 households (37.8%) experiencing poverty. Likewise, among single-mother households, those with 3 or 4 children have the highest poverty rate, with 41 households (60.3%) falling below the poverty line.
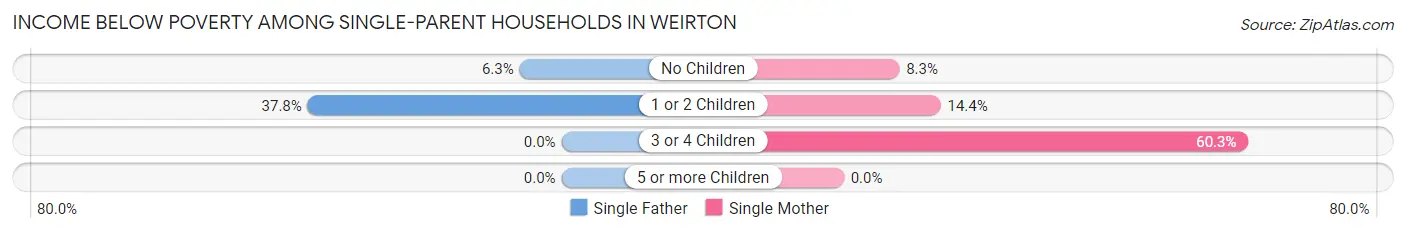
| Children | Single Father | Single Mother |
| No Children | 14 (6.2%) | 39 (8.3%) |
| 1 or 2 Children | 87 (37.8%) | 65 (14.4%) |
| 3 or 4 Children | 0 (0.0%) | 41 (60.3%) |
| 5 or more Children | 0 (0.0%) | 0 (0.0%) |
| Total | 101 (20.3%) | 145 (14.7%) |
Income Below Poverty Among Married-Couple vs Single-Parent Households in Weirton
The poverty data for Weirton shows that 51 of the married-couple family households (1.6%) and 246 of the single-parent households (16.5%) are living below the poverty level. Within the married-couple family households, those with no children have the highest poverty rate, with 51 households (2.3%) falling below the poverty line. Among the single-parent households, those with 3 or 4 children have the highest poverty rate, with 41 household (36.6%) living below poverty.
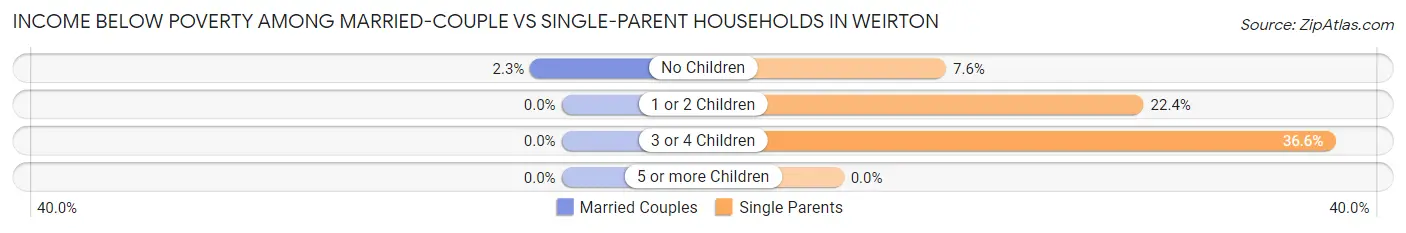
| Children | Married-Couple Families | Single-Parent Households |
| No Children | 51 (2.3%) | 53 (7.6%) |
| 1 or 2 Children | 0 (0.0%) | 152 (22.4%) |
| 3 or 4 Children | 0 (0.0%) | 41 (36.6%) |
| 5 or more Children | 0 (0.0%) | 0 (0.0%) |
| Total | 51 (1.6%) | 246 (16.5%) |
Race in Weirton
The most populous races in Weirton are White / Caucasian (17,497 | 92.2%), Two or more Races (662 | 3.5%), and Black / African American (591 | 3.1%).
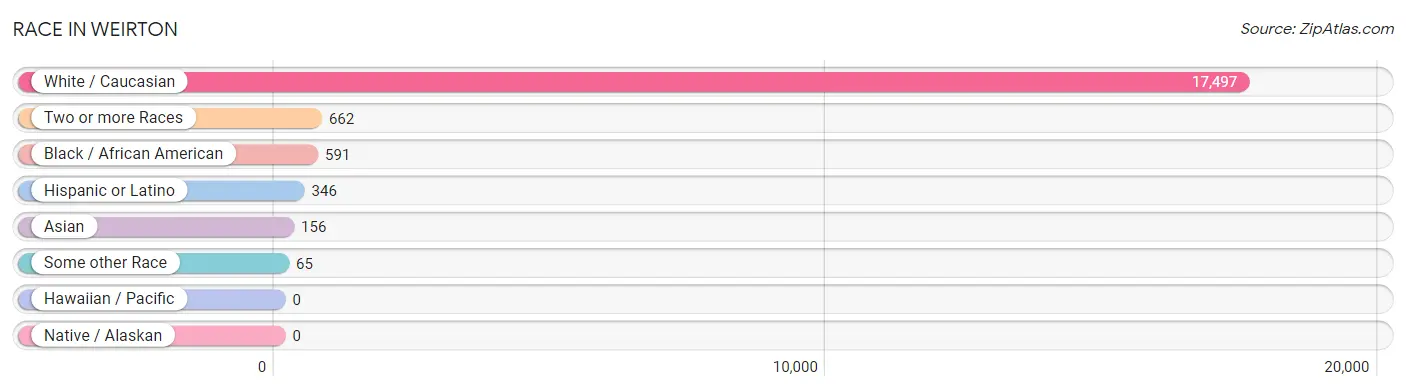
| Race | # Population | % Population |
| Asian | 156 | 0.8% |
| Black / African American | 591 | 3.1% |
| Hawaiian / Pacific | 0 | 0.0% |
| Hispanic or Latino | 346 | 1.8% |
| Native / Alaskan | 0 | 0.0% |
| White / Caucasian | 17,497 | 92.2% |
| Two or more Races | 662 | 3.5% |
| Some other Race | 65 | 0.3% |
| Total | 18,971 | 100.0% |
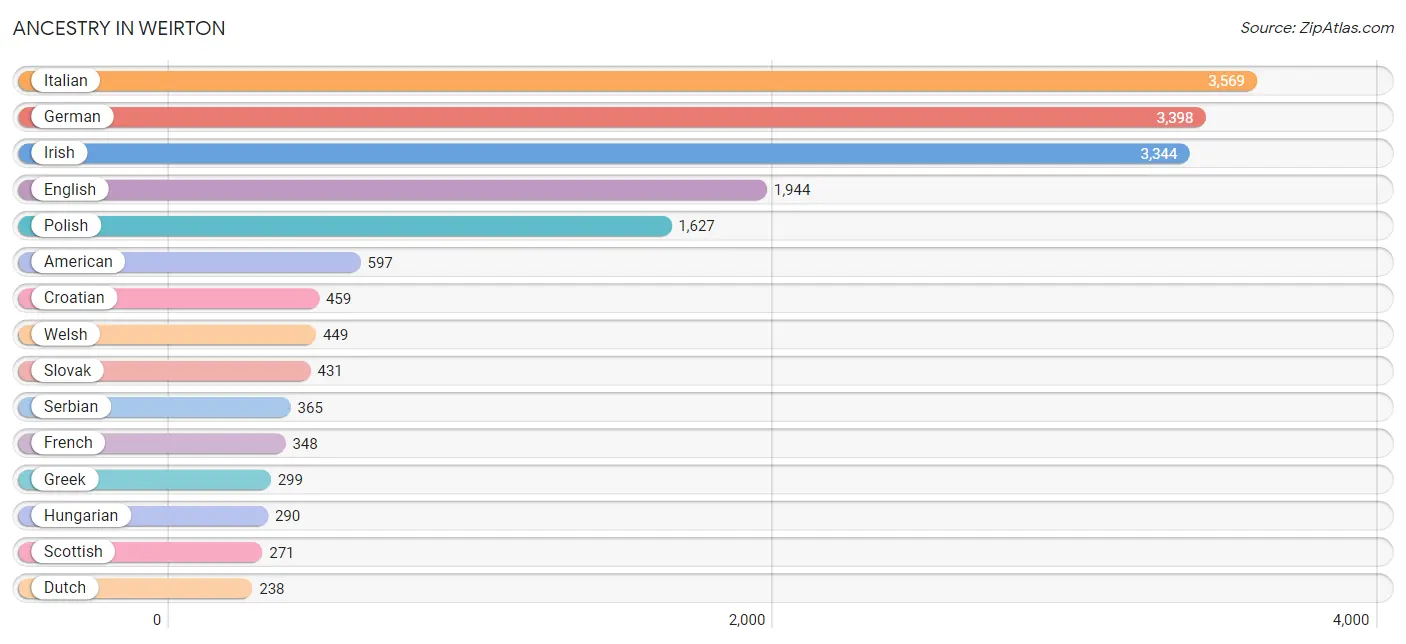
Ancestry in Weirton
The most populous ancestries reported in Weirton are Italian (3,569 | 18.8%), German (3,398 | 17.9%), Irish (3,344 | 17.6%), English (1,944 | 10.2%), and Polish (1,627 | 8.6%), together accounting for 73.2% of all Weirton residents.
| Ancestry | # Population | % Population |
| American | 597 | 3.2% |
| Arab | 83 | 0.4% |
| Arapaho | 14 | 0.1% |
| Austrian | 19 | 0.1% |
| Belgian | 45 | 0.2% |
| Bhutanese | 14 | 0.1% |
| British | 31 | 0.2% |
| Burmese | 55 | 0.3% |
| Cajun | 9 | 0.1% |
| Central American | 14 | 0.1% |
| Cherokee | 31 | 0.2% |
| Croatian | 459 | 2.4% |
| Cuban | 44 | 0.2% |
| Czech | 127 | 0.7% |
| Czechoslovakian | 27 | 0.1% |
| Danish | 9 | 0.1% |
| Dutch | 238 | 1.3% |
| Eastern European | 176 | 0.9% |
| Egyptian | 42 | 0.2% |
| English | 1,944 | 10.2% |
| European | 45 | 0.2% |
| Finnish | 53 | 0.3% |
| French | 348 | 1.8% |
| French Canadian | 16 | 0.1% |
| German | 3,398 | 17.9% |
| Greek | 299 | 1.6% |
| Guatemalan | 14 | 0.1% |
| Hungarian | 290 | 1.5% |
| Indian (Asian) | 4 | 0.0% |
| Irish | 3,344 | 17.6% |
| Italian | 3,569 | 18.8% |
| Korean | 60 | 0.3% |
| Lithuanian | 3 | 0.0% |
| Mexican | 85 | 0.4% |
| Moroccan | 41 | 0.2% |
| Nigerian | 18 | 0.1% |
| Northern European | 40 | 0.2% |
| Norwegian | 16 | 0.1% |
| Pakistani | 27 | 0.1% |
| Polish | 1,627 | 8.6% |
| Puerto Rican | 28 | 0.2% |
| Romanian | 10 | 0.1% |
| Russian | 158 | 0.8% |
| Scandinavian | 24 | 0.1% |
| Scotch-Irish | 183 | 1.0% |
| Scottish | 271 | 1.4% |
| Serbian | 365 | 1.9% |
| Sioux | 17 | 0.1% |
| Slavic | 39 | 0.2% |
| Slovak | 431 | 2.3% |
| Slovene | 42 | 0.2% |
| Spaniard | 53 | 0.3% |
| Spanish | 116 | 0.6% |
| Sri Lankan | 102 | 0.5% |
| Subsaharan African | 18 | 0.1% |
| Swedish | 96 | 0.5% |
| Thai | 30 | 0.2% |
| Ukrainian | 45 | 0.2% |
| Welsh | 449 | 2.4% |
| Yugoslavian | 22 | 0.1% | View All 60 Rows |
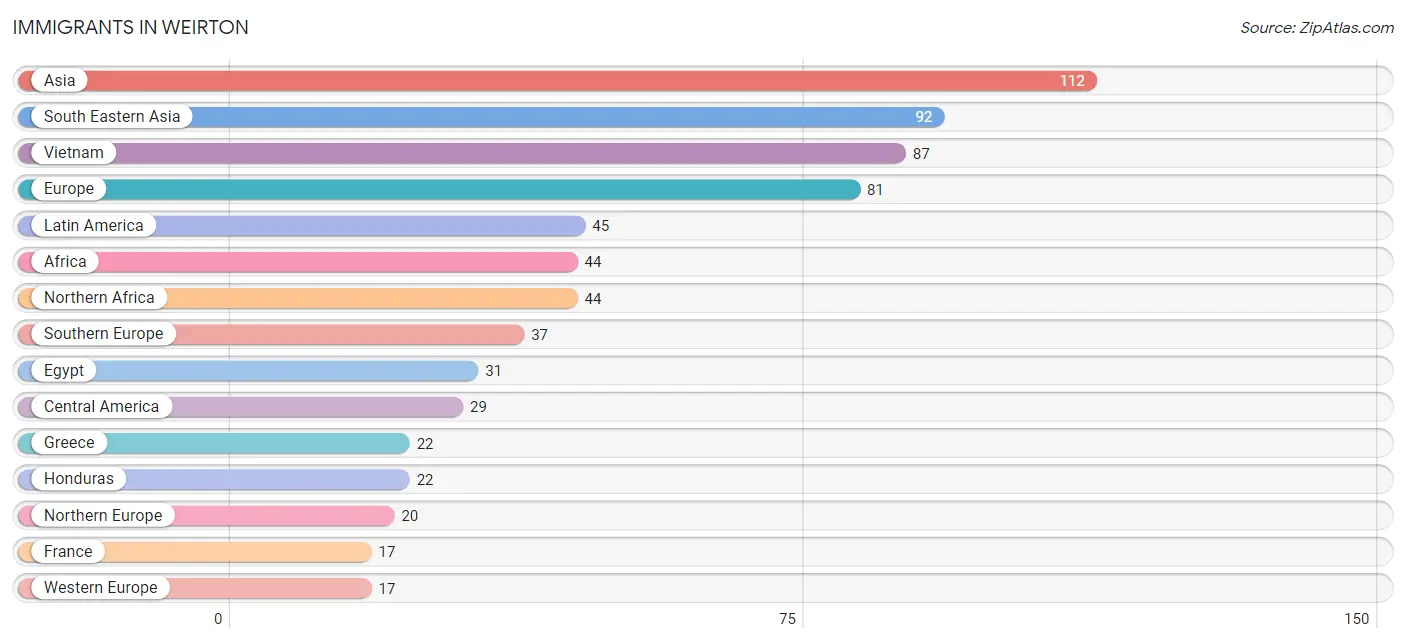
Immigrants in Weirton
The most numerous immigrant groups reported in Weirton came from Asia (112 | 0.6%), South Eastern Asia (92 | 0.5%), Vietnam (87 | 0.5%), Europe (81 | 0.4%), and Latin America (45 | 0.2%), together accounting for 2.2% of all Weirton residents.
| Immigration Origin | # Population | % Population |
| Africa | 44 | 0.2% |
| Asia | 112 | 0.6% |
| Bosnia and Herzegovina | 7 | 0.0% |
| Canada | 6 | 0.0% |
| Caribbean | 16 | 0.1% |
| Central America | 29 | 0.2% |
| China | 4 | 0.0% |
| Cuba | 16 | 0.1% |
| Eastern Asia | 16 | 0.1% |
| Eastern Europe | 7 | 0.0% |
| Egypt | 31 | 0.2% |
| Europe | 81 | 0.4% |
| France | 17 | 0.1% |
| Greece | 22 | 0.1% |
| Honduras | 22 | 0.1% |
| India | 4 | 0.0% |
| Italy | 15 | 0.1% |
| Korea | 12 | 0.1% |
| Latin America | 45 | 0.2% |
| Mexico | 7 | 0.0% |
| Morocco | 13 | 0.1% |
| Northern Africa | 44 | 0.2% |
| Northern Europe | 20 | 0.1% |
| Philippines | 5 | 0.0% |
| South Central Asia | 4 | 0.0% |
| South Eastern Asia | 92 | 0.5% |
| Southern Europe | 37 | 0.2% |
| Vietnam | 87 | 0.5% |
| Western Europe | 17 | 0.1% | View All 29 Rows |
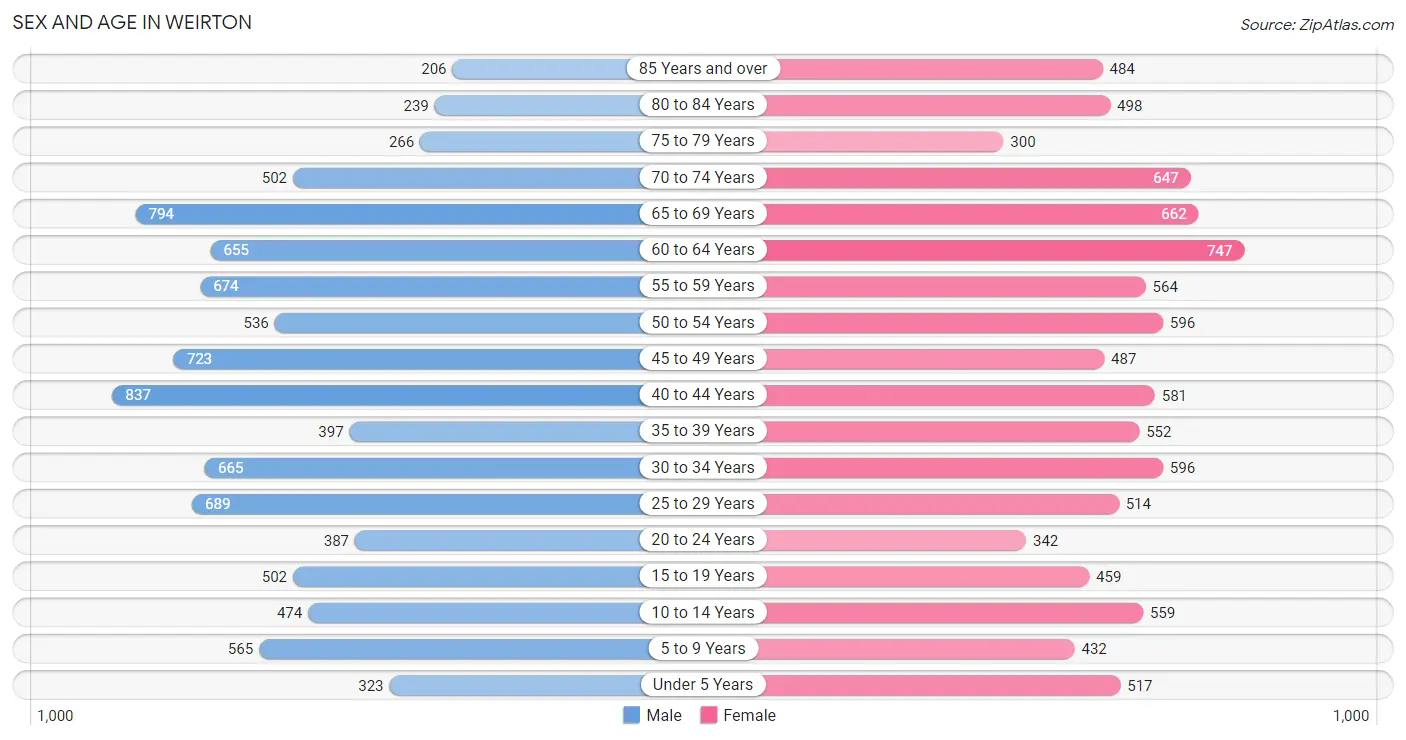
Sex and Age in Weirton
Sex and Age in Weirton
The most populous age groups in Weirton are 40 to 44 Years (837 | 8.9%) for men and 60 to 64 Years (747 | 7.8%) for women.
| Age Bracket | Male | Female |
| Under 5 Years | 323 (3.4%) | 517 (5.4%) |
| 5 to 9 Years | 565 (6.0%) | 432 (4.5%) |
| 10 to 14 Years | 474 (5.0%) | 559 (5.9%) |
| 15 to 19 Years | 502 (5.3%) | 459 (4.8%) |
| 20 to 24 Years | 387 (4.1%) | 342 (3.6%) |
| 25 to 29 Years | 689 (7.3%) | 514 (5.4%) |
| 30 to 34 Years | 665 (7.0%) | 596 (6.2%) |
| 35 to 39 Years | 397 (4.2%) | 552 (5.8%) |
| 40 to 44 Years | 837 (8.9%) | 581 (6.1%) |
| 45 to 49 Years | 723 (7.7%) | 487 (5.1%) |
| 50 to 54 Years | 536 (5.7%) | 596 (6.2%) |
| 55 to 59 Years | 674 (7.1%) | 564 (5.9%) |
| 60 to 64 Years | 655 (6.9%) | 747 (7.8%) |
| 65 to 69 Years | 794 (8.4%) | 662 (6.9%) |
| 70 to 74 Years | 502 (5.3%) | 647 (6.8%) |
| 75 to 79 Years | 266 (2.8%) | 300 (3.2%) |
| 80 to 84 Years | 239 (2.5%) | 498 (5.2%) |
| 85 Years and over | 206 (2.2%) | 484 (5.1%) |
| Total | 9,434 (100.0%) | 9,537 (100.0%) |
Families and Households in Weirton
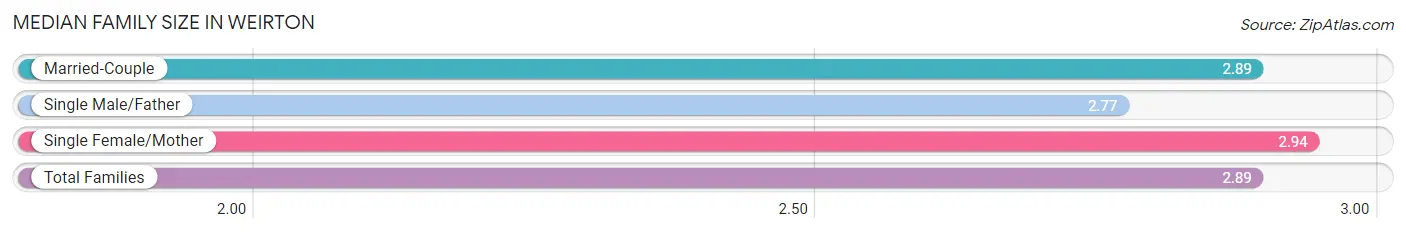
Median Family Size in Weirton
The median family size in Weirton is 2.89 persons per family, with single female/mother families (989 | 21.0%) accounting for the largest median family size of 2.94 persons per family. On the other hand, single male/father families (498 | 10.5%) represent the smallest median family size with 2.77 persons per family.
| Family Type | # Families | Family Size |
| Married-Couple | 3,232 (68.5%) | 2.89 |
| Single Male/Father | 498 (10.5%) | 2.77 |
| Single Female/Mother | 989 (21.0%) | 2.94 |
| Total Families | 4,719 (100.0%) | 2.89 |
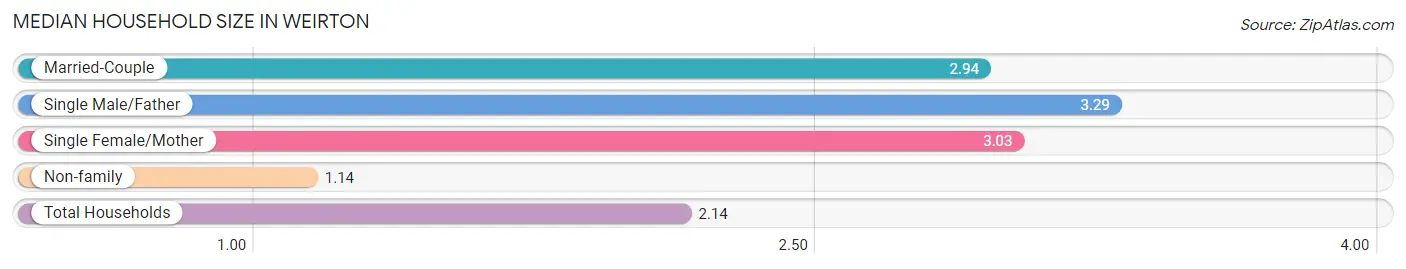
Median Household Size in Weirton
The median household size in Weirton is 2.14 persons per household, with single male/father households (498 | 5.7%) accounting for the largest median household size of 3.29 persons per household. non-family households (4,043 | 46.1%) represent the smallest median household size with 1.14 persons per household.
| Household Type | # Households | Household Size |
| Married-Couple | 3,232 (36.9%) | 2.94 |
| Single Male/Father | 498 (5.7%) | 3.29 |
| Single Female/Mother | 989 (11.3%) | 3.03 |
| Non-family | 4,043 (46.1%) | 1.14 |
| Total Households | 8,762 (100.0%) | 2.14 |
Household Size by Marriage Status in Weirton
Out of a total of 8,762 households in Weirton, 4,719 (53.9%) are family households, while 4,043 (46.1%) are nonfamily households. The most numerous type of family households are 2-person households, comprising 2,524, and the most common type of nonfamily households are 1-person households, comprising 3,508.
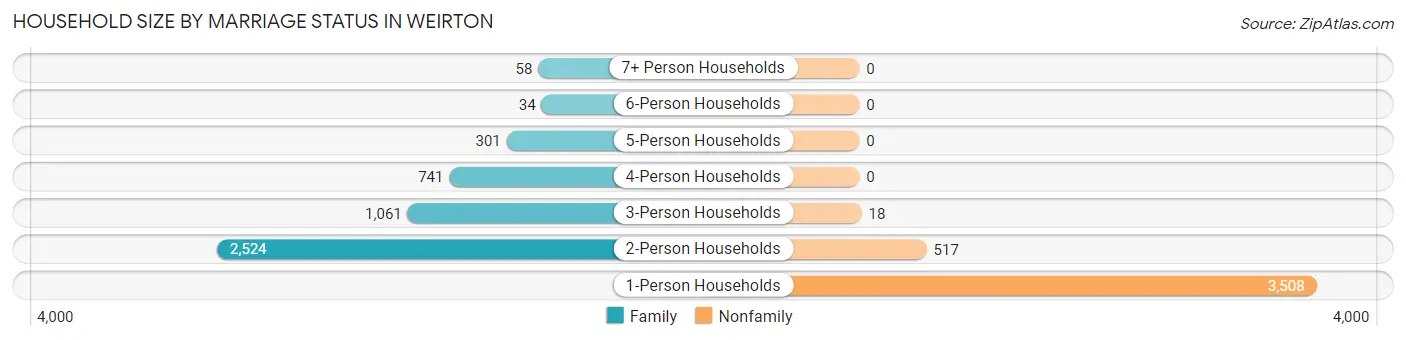
| Household Size | Family Households | Nonfamily Households |
| 1-Person Households | - | 3,508 (40.0%) |
| 2-Person Households | 2,524 (28.8%) | 517 (5.9%) |
| 3-Person Households | 1,061 (12.1%) | 18 (0.2%) |
| 4-Person Households | 741 (8.5%) | 0 (0.0%) |
| 5-Person Households | 301 (3.4%) | 0 (0.0%) |
| 6-Person Households | 34 (0.4%) | 0 (0.0%) |
| 7+ Person Households | 58 (0.7%) | 0 (0.0%) |
| Total | 4,719 (53.9%) | 4,043 (46.1%) |
Female Fertility in Weirton
Fertility by Age in Weirton
Average fertility rate in Weirton is 82.0 births per 1,000 women. Women in the age bracket of 20 to 34 years have the highest fertility rate with 172.0 births per 1,000 women. Women in the age bracket of 20 to 34 years acount for 84.8% of all women with births.
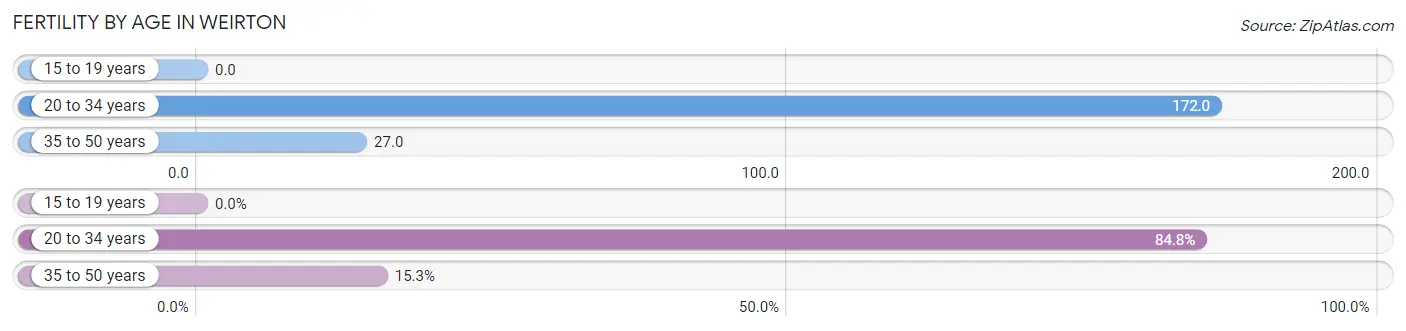
| Age Bracket | Women with Births | Births / 1,000 Women |
| 15 to 19 years | 0 (0.0%) | 0.0 |
| 20 to 34 years | 250 (84.8%) | 172.0 |
| 35 to 50 years | 45 (15.2%) | 27.0 |
| Total | 295 (100.0%) | 82.0 |
Fertility by Age by Marriage Status in Weirton
46.4% of women with births (295) in Weirton are married. The highest percentage of unmarried women with births falls into 20 to 34 years age bracket with 56.0% of them unmarried at the time of birth, while the lowest percentage of unmarried women with births belong to 35 to 50 years age bracket with 40.0% of them unmarried.
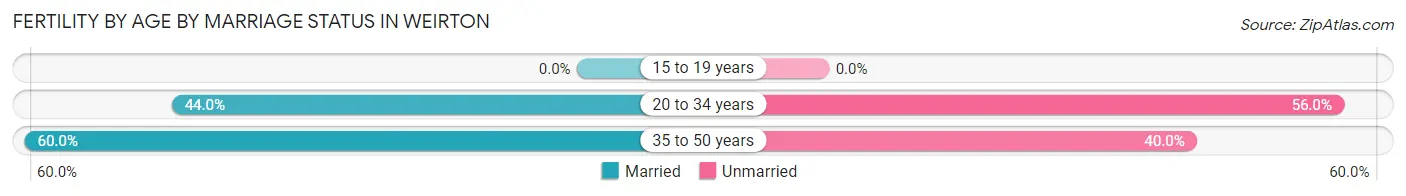
| Age Bracket | Married | Unmarried |
| 15 to 19 years | 0 (0.0%) | 0 (0.0%) |
| 20 to 34 years | 110 (44.0%) | 140 (56.0%) |
| 35 to 50 years | 27 (60.0%) | 18 (40.0%) |
| Total | 137 (46.4%) | 158 (53.6%) |
Fertility by Education in Weirton
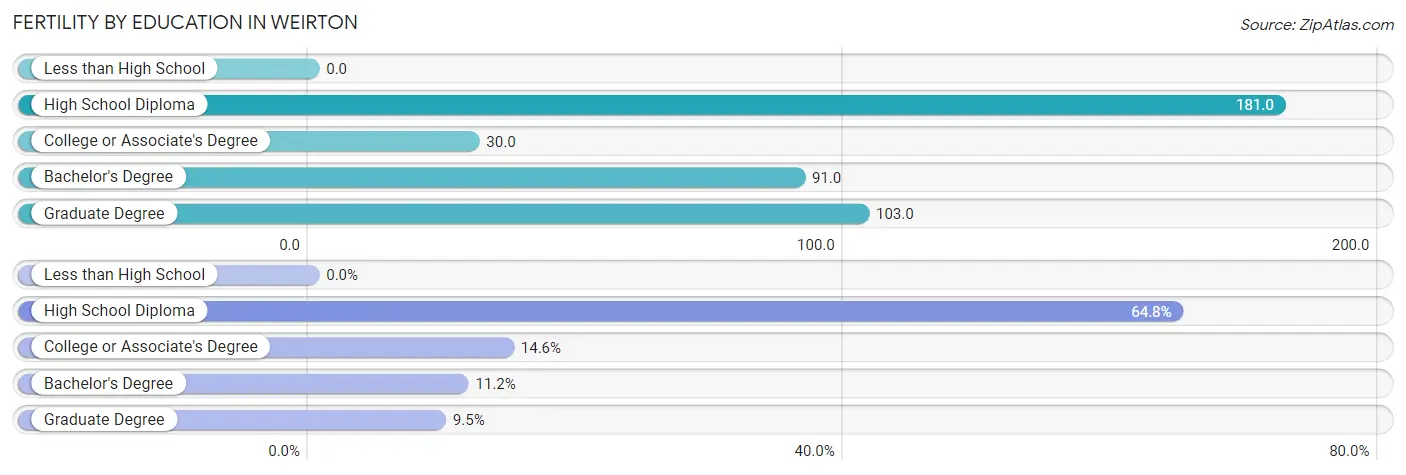
| Educational Attainment | Women with Births | Births / 1,000 Women |
| Less than High School | 0 (0.0%) | 0.0 |
| High School Diploma | 191 (64.7%) | 181.0 |
| College or Associate's Degree | 43 (14.6%) | 30.0 |
| Bachelor's Degree | 33 (11.2%) | 91.0 |
| Graduate Degree | 28 (9.5%) | 103.0 |
| Total | 295 (100.0%) | 82.0 |
Fertility by Education by Marriage Status in Weirton
53.6% of women with births in Weirton are unmarried. Women with the educational attainment of college or associate's degree are most likely to be married with 72.1% of them married at childbirth, while women with the educational attainment of graduate degree are least likely to be married with 64.3% of them unmarried at childbirth.
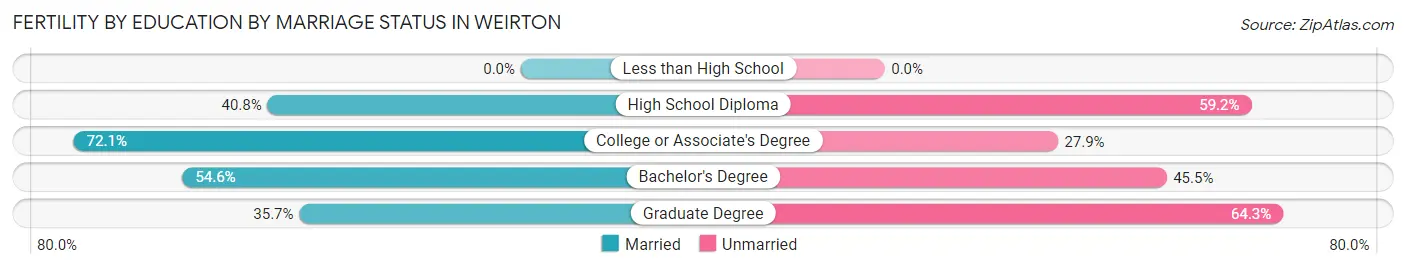
| Educational Attainment | Married | Unmarried |
| Less than High School | 0 (0.0%) | 0 (0.0%) |
| High School Diploma | 78 (40.8%) | 113 (59.2%) |
| College or Associate's Degree | 31 (72.1%) | 12 (27.9%) |
| Bachelor's Degree | 18 (54.5%) | 15 (45.5%) |
| Graduate Degree | 10 (35.7%) | 18 (64.3%) |
| Total | 137 (46.4%) | 158 (53.6%) |
Employment Characteristics in Weirton
Employment by Class of Employer in Weirton
Among the 8,373 employed individuals in Weirton, private company employees (5,356 | 64.0%), not-for-profit organizations (844 | 10.1%), and local government employees (662 | 7.9%) make up the most common classes of employment.
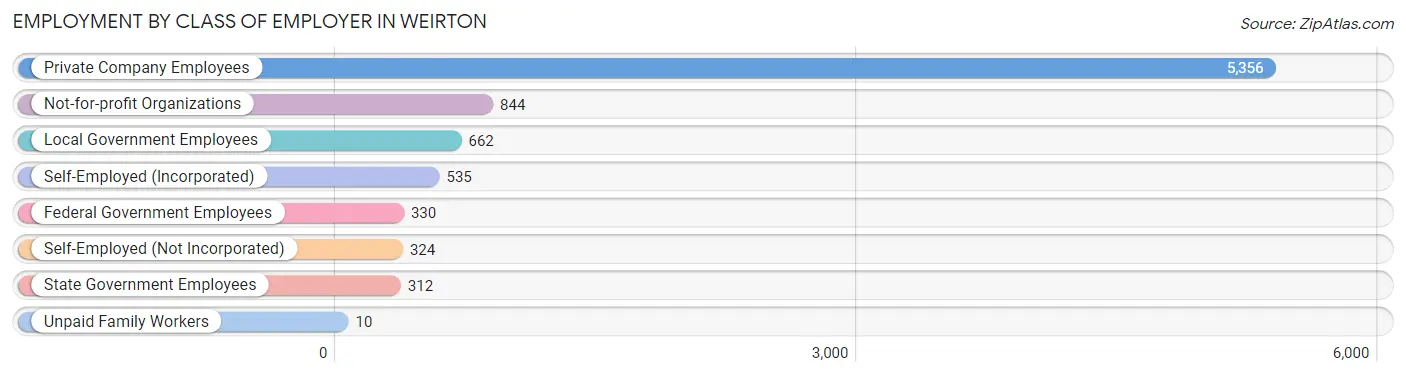
| Employer Class | # Employees | % Employees |
| Private Company Employees | 5,356 | 64.0% |
| Self-Employed (Incorporated) | 535 | 6.4% |
| Self-Employed (Not Incorporated) | 324 | 3.9% |
| Not-for-profit Organizations | 844 | 10.1% |
| Local Government Employees | 662 | 7.9% |
| State Government Employees | 312 | 3.7% |
| Federal Government Employees | 330 | 3.9% |
| Unpaid Family Workers | 10 | 0.1% |
| Total | 8,373 | 100.0% |
Employment Status by Age in Weirton
According to the labor force statistics for Weirton, out of the total population over 16 years of age (15,968), 58.7% or 9,373 individuals are in the labor force, with 7.8% or 731 of them unemployed. The age group with the highest labor force participation rate is 35 to 44 years, with 87.5% or 2,071 individuals in the labor force. Within the labor force, the 16 to 19 years age range has the highest percentage of unemployed individuals, with 46.2% or 229 of them being unemployed.
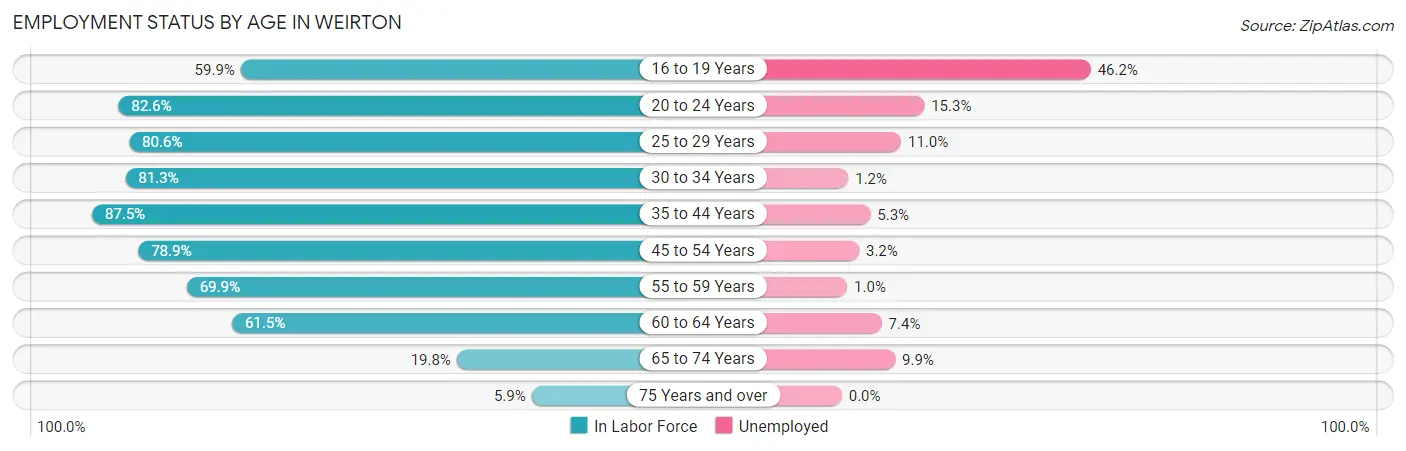
| Age Bracket | In Labor Force | Unemployed |
| 16 to 19 Years | 496 (59.9%) | 229 (46.2%) |
| 20 to 24 Years | 602 (82.6%) | 92 (15.3%) |
| 25 to 29 Years | 970 (80.6%) | 107 (11.0%) |
| 30 to 34 Years | 1,025 (81.3%) | 12 (1.2%) |
| 35 to 44 Years | 2,071 (87.5%) | 110 (5.3%) |
| 45 to 54 Years | 1,848 (78.9%) | 59 (3.2%) |
| 55 to 59 Years | 865 (69.9%) | 9 (1.0%) |
| 60 to 64 Years | 862 (61.5%) | 64 (7.4%) |
| 65 to 74 Years | 516 (19.8%) | 51 (9.9%) |
| 75 Years and over | 118 (5.9%) | 0 (0.0%) |
| Total | 9,373 (58.7%) | 731 (7.8%) |
Employment Status by Educational Attainment in Weirton
According to labor force statistics for Weirton, 77.9% of individuals (7,644) out of the total population between 25 and 64 years of age (9,813) are in the labor force, with 4.7% or 359 of them being unemployed. The group with the highest labor force participation rate are those with the educational attainment of bachelor's degree or higher, with 86.1% or 2,014 individuals in the labor force. Within the labor force, individuals with less than high school education have the highest percentage of unemployment, with 6.5% or 15 of them being unemployed.
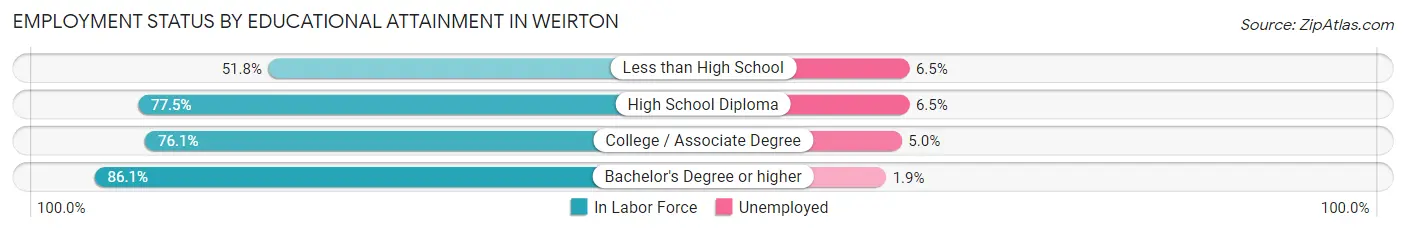
| Educational Attainment | In Labor Force | Unemployed |
| Less than High School | 230 (51.8%) | 29 (6.5%) |
| High School Diploma | 2,578 (77.5%) | 216 (6.5%) |
| College / Associate Degree | 2,819 (76.1%) | 185 (5.0%) |
| Bachelor's Degree or higher | 2,014 (86.1%) | 44 (1.9%) |
| Total | 7,644 (77.9%) | 461 (4.7%) |
Employment Occupations by Sex in Weirton
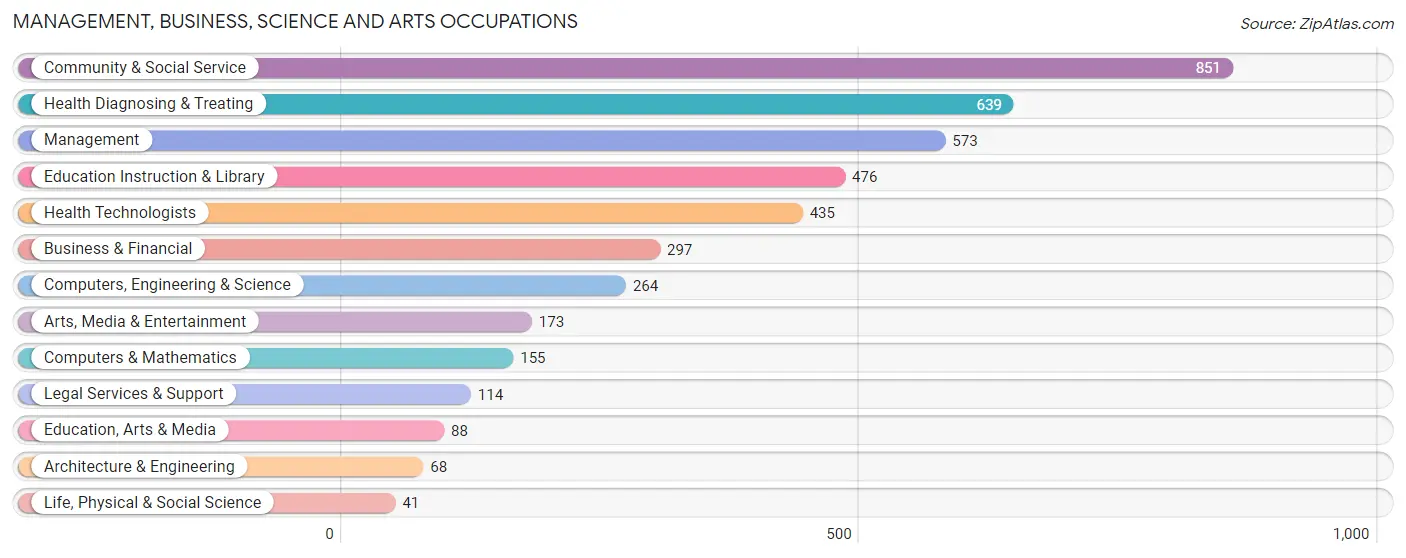
Management, Business, Science and Arts Occupations
The most common Management, Business, Science and Arts occupations in Weirton are Community & Social Service (851 | 9.9%), Health Diagnosing & Treating (639 | 7.4%), Management (573 | 6.7%), Education Instruction & Library (476 | 5.5%), and Health Technologists (435 | 5.1%).
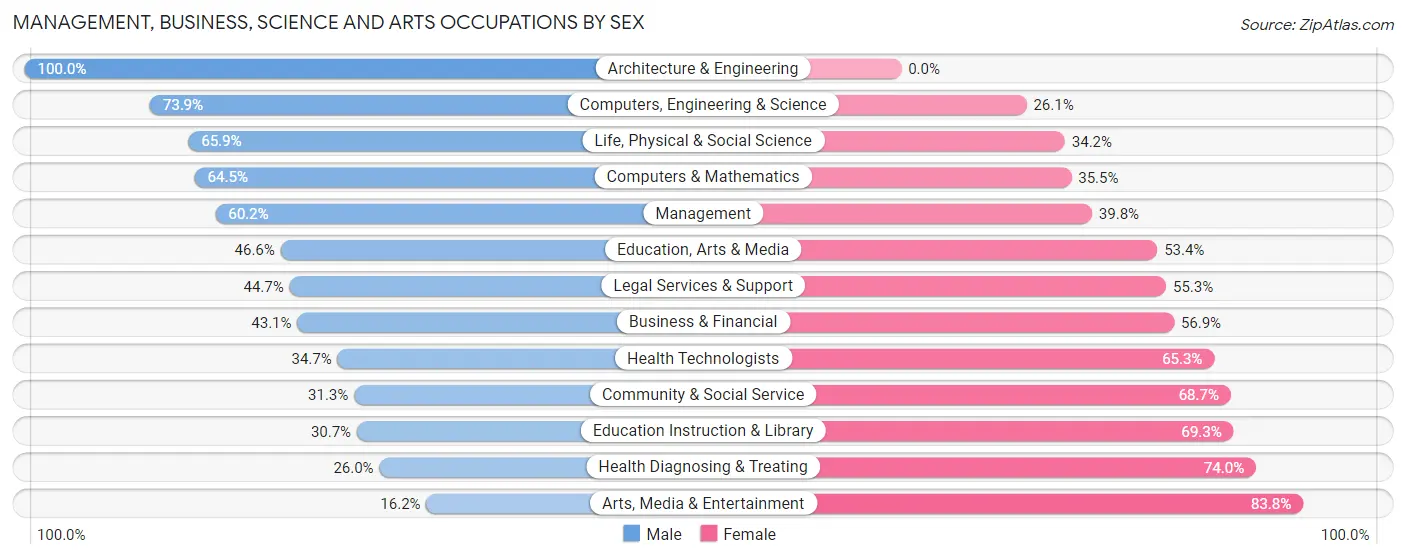
Management, Business, Science and Arts Occupations by Sex
Within the Management, Business, Science and Arts occupations in Weirton, the most male-oriented occupations are Architecture & Engineering (100.0%), Computers, Engineering & Science (73.9%), and Life, Physical & Social Science (65.8%), while the most female-oriented occupations are Arts, Media & Entertainment (83.8%), Health Diagnosing & Treating (74.0%), and Education Instruction & Library (69.3%).
| Occupation | Male | Female |
| Management | 345 (60.2%) | 228 (39.8%) |
| Business & Financial | 128 (43.1%) | 169 (56.9%) |
| Computers, Engineering & Science | 195 (73.9%) | 69 (26.1%) |
| Computers & Mathematics | 100 (64.5%) | 55 (35.5%) |
| Architecture & Engineering | 68 (100.0%) | 0 (0.0%) |
| Life, Physical & Social Science | 27 (65.8%) | 14 (34.2%) |
| Community & Social Service | 266 (31.3%) | 585 (68.7%) |
| Education, Arts & Media | 41 (46.6%) | 47 (53.4%) |
| Legal Services & Support | 51 (44.7%) | 63 (55.3%) |
| Education Instruction & Library | 146 (30.7%) | 330 (69.3%) |
| Arts, Media & Entertainment | 28 (16.2%) | 145 (83.8%) |
| Health Diagnosing & Treating | 166 (26.0%) | 473 (74.0%) |
| Health Technologists | 151 (34.7%) | 284 (65.3%) |
| Total (Category) | 1,100 (41.9%) | 1,524 (58.1%) |
| Total (Overall) | 4,843 (56.2%) | 3,773 (43.8%) |
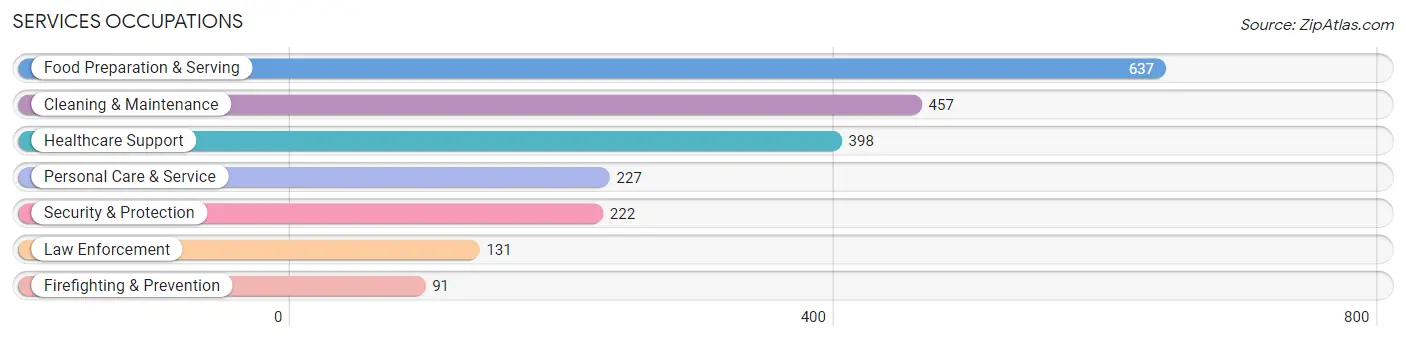
Services Occupations
The most common Services occupations in Weirton are Food Preparation & Serving (637 | 7.4%), Cleaning & Maintenance (457 | 5.3%), Healthcare Support (398 | 4.6%), Personal Care & Service (227 | 2.6%), and Security & Protection (222 | 2.6%).
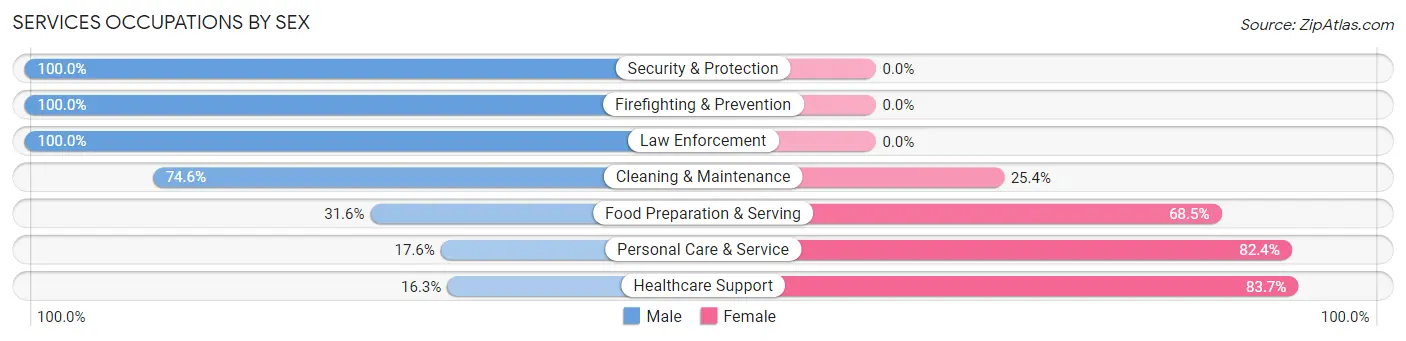
Services Occupations by Sex
Within the Services occupations in Weirton, the most male-oriented occupations are Security & Protection (100.0%), Firefighting & Prevention (100.0%), and Law Enforcement (100.0%), while the most female-oriented occupations are Healthcare Support (83.7%), Personal Care & Service (82.4%), and Food Preparation & Serving (68.4%).
| Occupation | Male | Female |
| Healthcare Support | 65 (16.3%) | 333 (83.7%) |
| Security & Protection | 222 (100.0%) | 0 (0.0%) |
| Firefighting & Prevention | 91 (100.0%) | 0 (0.0%) |
| Law Enforcement | 131 (100.0%) | 0 (0.0%) |
| Food Preparation & Serving | 201 (31.6%) | 436 (68.4%) |
| Cleaning & Maintenance | 341 (74.6%) | 116 (25.4%) |
| Personal Care & Service | 40 (17.6%) | 187 (82.4%) |
| Total (Category) | 869 (44.8%) | 1,072 (55.2%) |
| Total (Overall) | 4,843 (56.2%) | 3,773 (43.8%) |
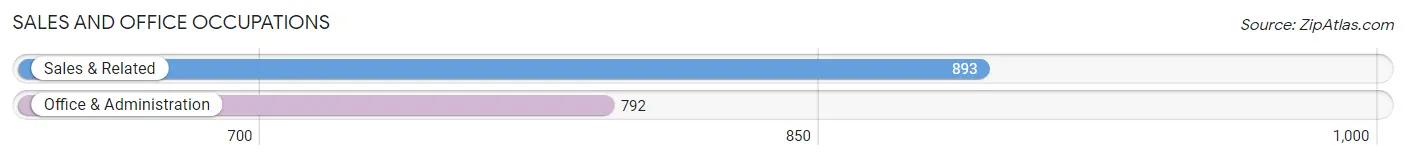
Sales and Office Occupations
The most common Sales and Office occupations in Weirton are Sales & Related (893 | 10.4%), and Office & Administration (792 | 9.2%).
Sales and Office Occupations by Sex
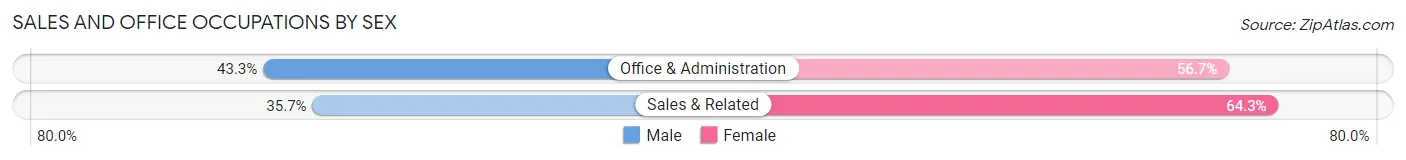
| Occupation | Male | Female |
| Sales & Related | 319 (35.7%) | 574 (64.3%) |
| Office & Administration | 343 (43.3%) | 449 (56.7%) |
| Total (Category) | 662 (39.3%) | 1,023 (60.7%) |
| Total (Overall) | 4,843 (56.2%) | 3,773 (43.8%) |
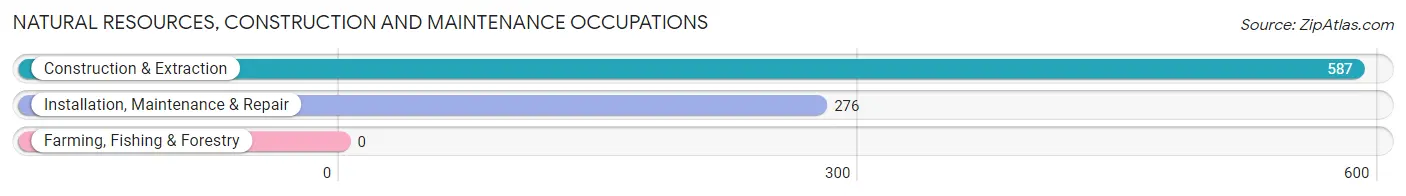
Natural Resources, Construction and Maintenance Occupations
The most common Natural Resources, Construction and Maintenance occupations in Weirton are Construction & Extraction (587 | 6.8%), and Installation, Maintenance & Repair (276 | 3.2%).
Natural Resources, Construction and Maintenance Occupations by Sex
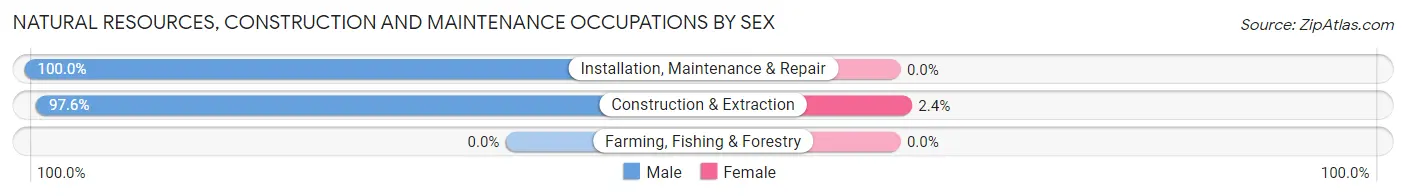
| Occupation | Male | Female |
| Farming, Fishing & Forestry | 0 (0.0%) | 0 (0.0%) |
| Construction & Extraction | 573 (97.6%) | 14 (2.4%) |
| Installation, Maintenance & Repair | 276 (100.0%) | 0 (0.0%) |
| Total (Category) | 849 (98.4%) | 14 (1.6%) |
| Total (Overall) | 4,843 (56.2%) | 3,773 (43.8%) |
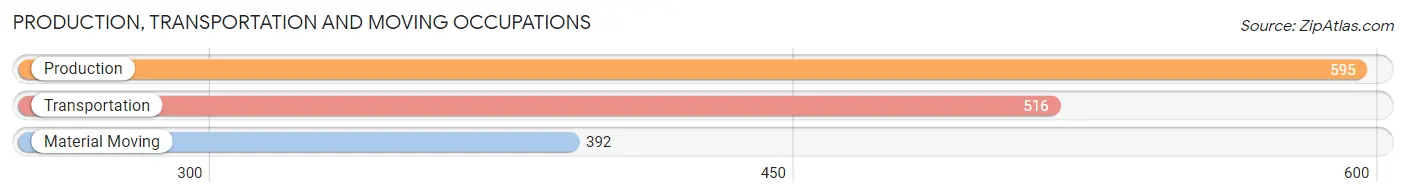
Production, Transportation and Moving Occupations
The most common Production, Transportation and Moving occupations in Weirton are Production (595 | 6.9%), Transportation (516 | 6.0%), and Material Moving (392 | 4.5%).
Production, Transportation and Moving Occupations by Sex
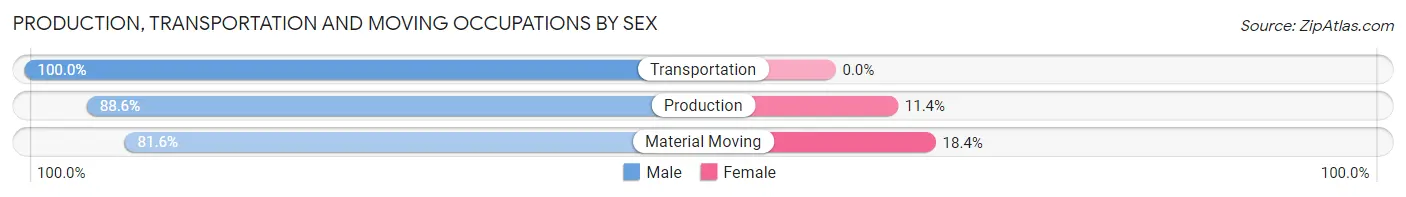
| Occupation | Male | Female |
| Production | 527 (88.6%) | 68 (11.4%) |
| Transportation | 516 (100.0%) | 0 (0.0%) |
| Material Moving | 320 (81.6%) | 72 (18.4%) |
| Total (Category) | 1,363 (90.7%) | 140 (9.3%) |
| Total (Overall) | 4,843 (56.2%) | 3,773 (43.8%) |
Employment Industries by Sex in Weirton
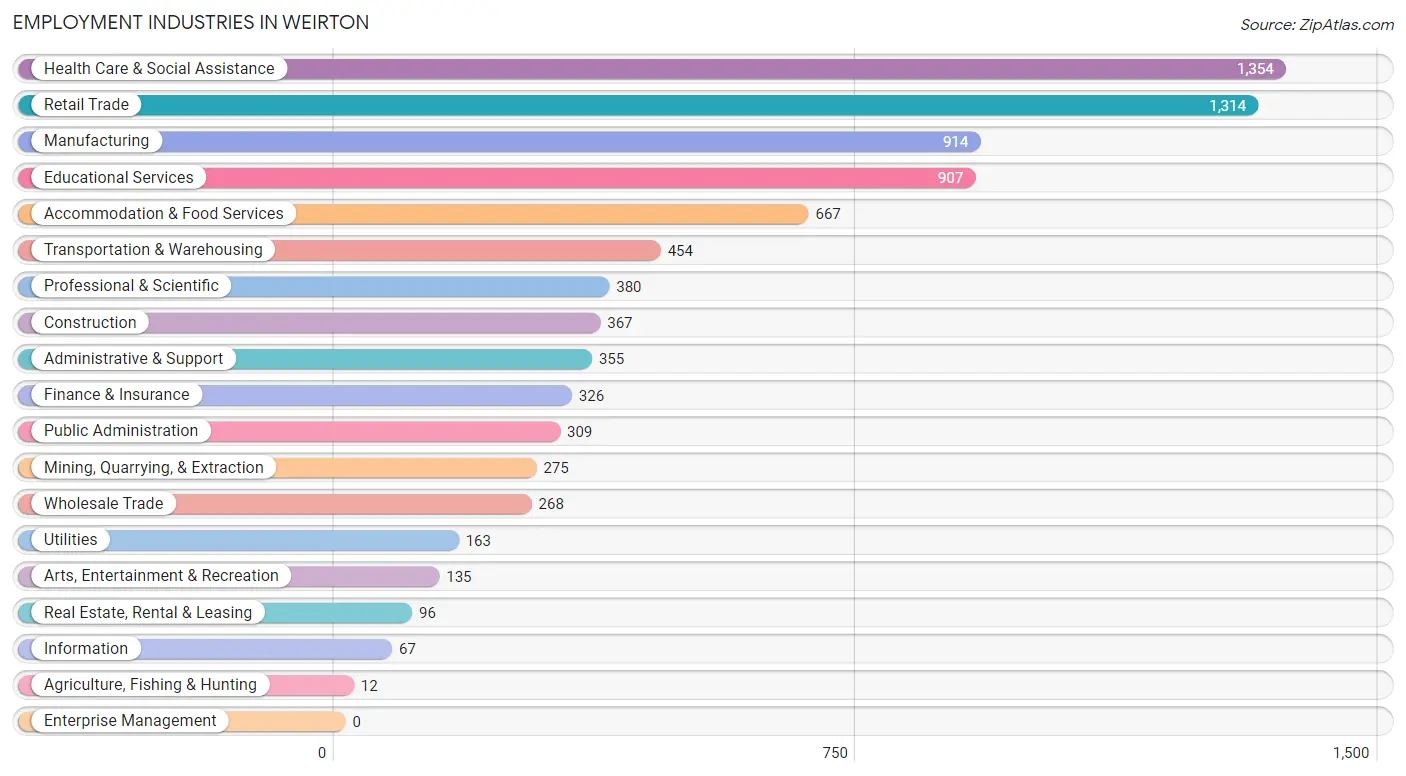
Employment Industries in Weirton
The major employment industries in Weirton include Health Care & Social Assistance (1,354 | 15.7%), Retail Trade (1,314 | 15.2%), Manufacturing (914 | 10.6%), Educational Services (907 | 10.5%), and Accommodation & Food Services (667 | 7.7%).
Employment Industries by Sex in Weirton
The Weirton industries that see more men than women are Agriculture, Fishing & Hunting (100.0%), Mining, Quarrying, & Extraction (100.0%), and Utilities (94.5%), whereas the industries that tend to have a higher number of women are Real Estate, Rental & Leasing (76.0%), Health Care & Social Assistance (75.6%), and Accommodation & Food Services (63.3%).

| Industry | Male | Female |
| Agriculture, Fishing & Hunting | 12 (100.0%) | 0 (0.0%) |
| Mining, Quarrying, & Extraction | 275 (100.0%) | 0 (0.0%) |
| Construction | 345 (94.0%) | 22 (6.0%) |
| Manufacturing | 701 (76.7%) | 213 (23.3%) |
| Wholesale Trade | 183 (68.3%) | 85 (31.7%) |
| Retail Trade | 568 (43.2%) | 746 (56.8%) |
| Transportation & Warehousing | 415 (91.4%) | 39 (8.6%) |
| Utilities | 154 (94.5%) | 9 (5.5%) |
| Information | 38 (56.7%) | 29 (43.3%) |
| Finance & Insurance | 190 (58.3%) | 136 (41.7%) |
| Real Estate, Rental & Leasing | 23 (24.0%) | 73 (76.0%) |
| Professional & Scientific | 229 (60.3%) | 151 (39.7%) |
| Enterprise Management | 0 (0.0%) | 0 (0.0%) |
| Administrative & Support | 287 (80.8%) | 68 (19.2%) |
| Educational Services | 421 (46.4%) | 486 (53.6%) |
| Health Care & Social Assistance | 330 (24.4%) | 1,024 (75.6%) |
| Arts, Entertainment & Recreation | 117 (86.7%) | 18 (13.3%) |
| Accommodation & Food Services | 245 (36.7%) | 422 (63.3%) |
| Public Administration | 242 (78.3%) | 67 (21.7%) |
| Total | 4,843 (56.2%) | 3,773 (43.8%) |
Education in Weirton
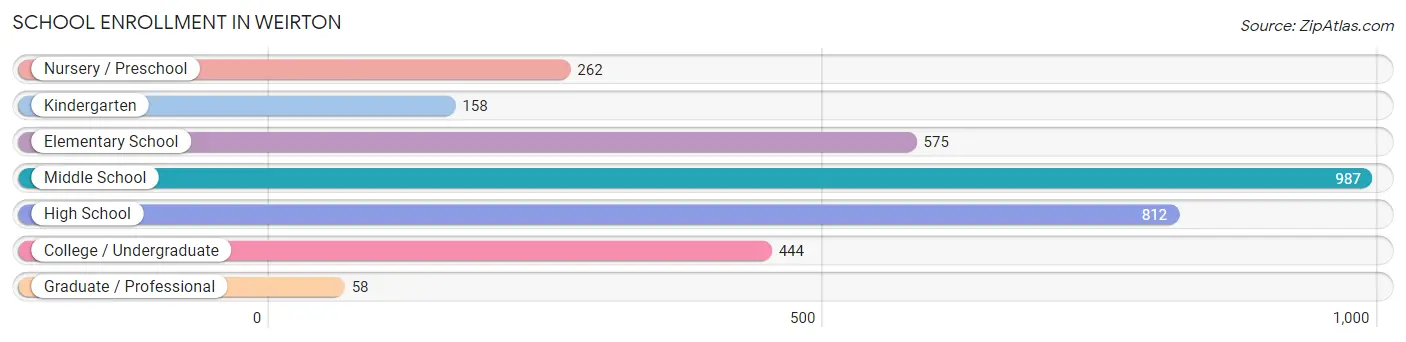
School Enrollment in Weirton
The most common levels of schooling among the 3,296 students in Weirton are middle school (987 | 29.9%), high school (812 | 24.6%), and elementary school (575 | 17.4%).
| School Level | # Students | % Students |
| Nursery / Preschool | 262 | 8.0% |
| Kindergarten | 158 | 4.8% |
| Elementary School | 575 | 17.4% |
| Middle School | 987 | 29.9% |
| High School | 812 | 24.6% |
| College / Undergraduate | 444 | 13.5% |
| Graduate / Professional | 58 | 1.8% |
| Total | 3,296 | 100.0% |
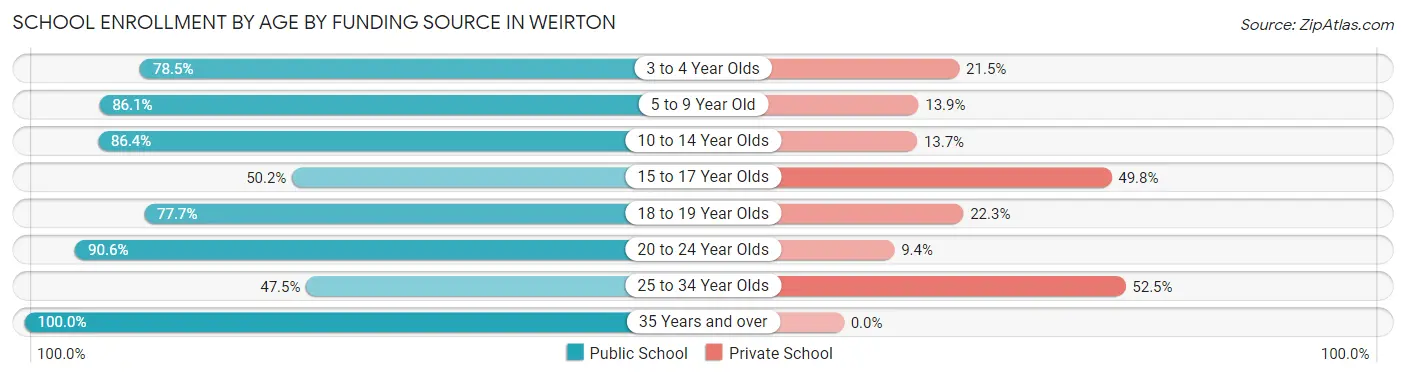
School Enrollment by Age by Funding Source in Weirton
Out of a total of 3,296 students who are enrolled in schools in Weirton, 738 (22.4%) attend a private institution, while the remaining 2,558 (77.6%) are enrolled in public schools. The age group of 25 to 34 year olds has the highest likelihood of being enrolled in private schools, with 85 (52.5% in the age bracket) enrolled. Conversely, the age group of 35 years and over has the lowest likelihood of being enrolled in a private school, with 122 (100.0% in the age bracket) attending a public institution.
| Age Bracket | Public School | Private School |
| 3 to 4 Year Olds | 73 (78.5%) | 20 (21.5%) |
| 5 to 9 Year Old | 731 (86.1%) | 118 (13.9%) |
| 10 to 14 Year Olds | 892 (86.4%) | 141 (13.7%) |
| 15 to 17 Year Olds | 305 (50.2%) | 303 (49.8%) |
| 18 to 19 Year Olds | 185 (77.7%) | 53 (22.3%) |
| 20 to 24 Year Olds | 173 (90.6%) | 18 (9.4%) |
| 25 to 34 Year Olds | 77 (47.5%) | 85 (52.5%) |
| 35 Years and over | 122 (100.0%) | 0 (0.0%) |
| Total | 2,558 (77.6%) | 738 (22.4%) |
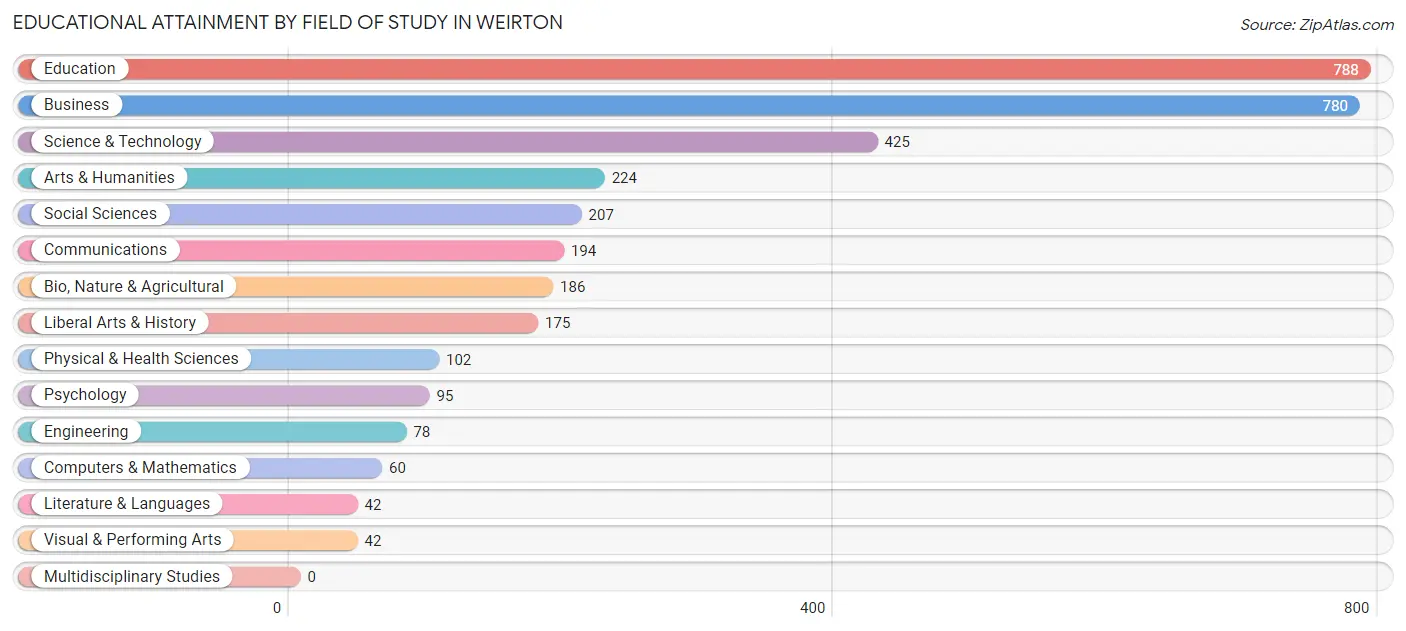
Educational Attainment by Field of Study in Weirton
Education (788 | 23.2%), business (780 | 23.0%), science & technology (425 | 12.5%), arts & humanities (224 | 6.6%), and social sciences (207 | 6.1%) are the most common fields of study among 3,398 individuals in Weirton who have obtained a bachelor's degree or higher.
| Field of Study | # Graduates | % Graduates |
| Computers & Mathematics | 60 | 1.8% |
| Bio, Nature & Agricultural | 186 | 5.5% |
| Physical & Health Sciences | 102 | 3.0% |
| Psychology | 95 | 2.8% |
| Social Sciences | 207 | 6.1% |
| Engineering | 78 | 2.3% |
| Multidisciplinary Studies | 0 | 0.0% |
| Science & Technology | 425 | 12.5% |
| Business | 780 | 23.0% |
| Education | 788 | 23.2% |
| Literature & Languages | 42 | 1.2% |
| Liberal Arts & History | 175 | 5.1% |
| Visual & Performing Arts | 42 | 1.2% |
| Communications | 194 | 5.7% |
| Arts & Humanities | 224 | 6.6% |
| Total | 3,398 | 100.0% |
Transportation & Commute in Weirton
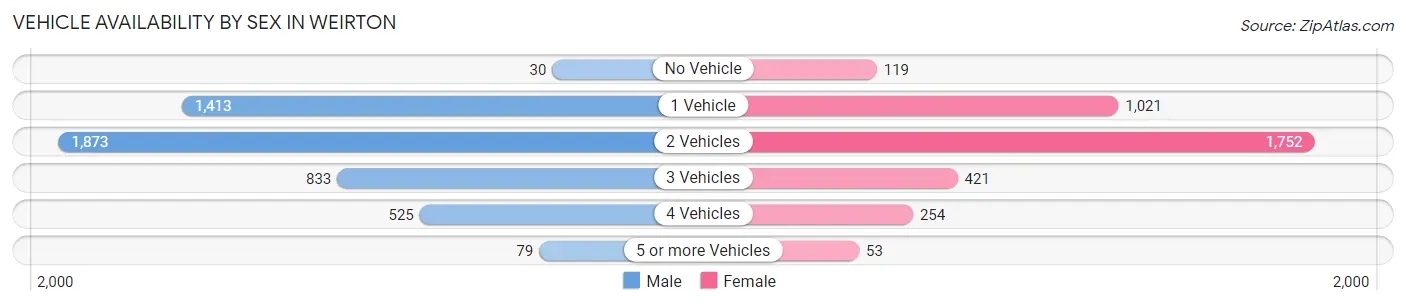
Vehicle Availability by Sex in Weirton
The most prevalent vehicle ownership categories in Weirton are males with 2 vehicles (1,873, accounting for 39.4%) and females with 2 vehicles (1,752, making up 51.7%).
| Vehicles Available | Male | Female |
| No Vehicle | 30 (0.6%) | 119 (3.3%) |
| 1 Vehicle | 1,413 (29.7%) | 1,021 (28.2%) |
| 2 Vehicles | 1,873 (39.4%) | 1,752 (48.4%) |
| 3 Vehicles | 833 (17.5%) | 421 (11.6%) |
| 4 Vehicles | 525 (11.1%) | 254 (7.0%) |
| 5 or more Vehicles | 79 (1.7%) | 53 (1.5%) |
| Total | 4,753 (100.0%) | 3,620 (100.0%) |
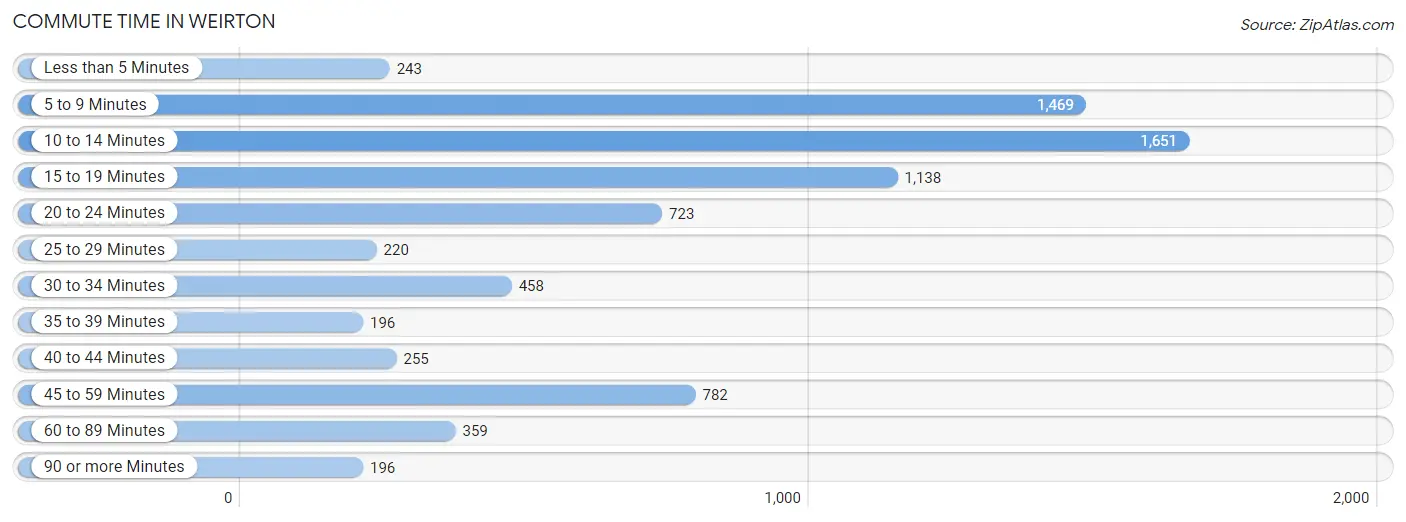
Commute Time in Weirton
The most frequently occuring commute durations in Weirton are 10 to 14 minutes (1,651 commuters, 21.5%), 5 to 9 minutes (1,469 commuters, 19.1%), and 15 to 19 minutes (1,138 commuters, 14.8%).
| Commute Time | # Commuters | % Commuters |
| Less than 5 Minutes | 243 | 3.2% |
| 5 to 9 Minutes | 1,469 | 19.1% |
| 10 to 14 Minutes | 1,651 | 21.5% |
| 15 to 19 Minutes | 1,138 | 14.8% |
| 20 to 24 Minutes | 723 | 9.4% |
| 25 to 29 Minutes | 220 | 2.9% |
| 30 to 34 Minutes | 458 | 6.0% |
| 35 to 39 Minutes | 196 | 2.5% |
| 40 to 44 Minutes | 255 | 3.3% |
| 45 to 59 Minutes | 782 | 10.2% |
| 60 to 89 Minutes | 359 | 4.7% |
| 90 or more Minutes | 196 | 2.5% |
Commute Time by Sex in Weirton
The most common commute times in Weirton are 10 to 14 minutes (859 commuters, 19.0%) for males and 10 to 14 minutes (792 commuters, 25.0%) for females.
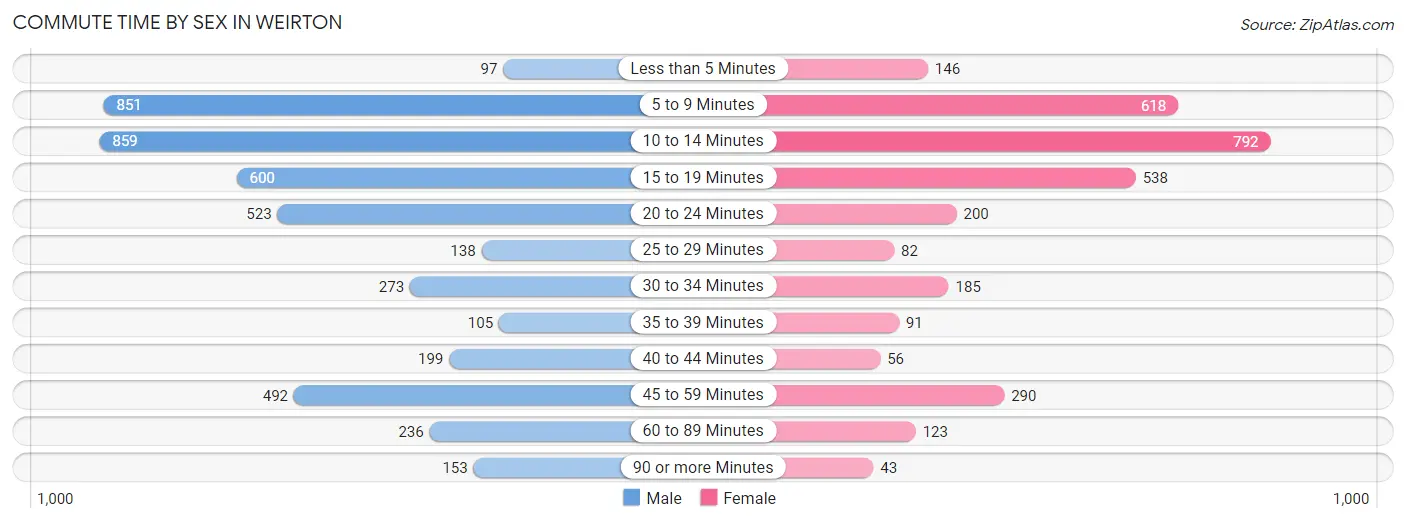
| Commute Time | Male | Female |
| Less than 5 Minutes | 97 (2.1%) | 146 (4.6%) |
| 5 to 9 Minutes | 851 (18.8%) | 618 (19.5%) |
| 10 to 14 Minutes | 859 (19.0%) | 792 (25.0%) |
| 15 to 19 Minutes | 600 (13.3%) | 538 (17.0%) |
| 20 to 24 Minutes | 523 (11.6%) | 200 (6.3%) |
| 25 to 29 Minutes | 138 (3.0%) | 82 (2.6%) |
| 30 to 34 Minutes | 273 (6.0%) | 185 (5.9%) |
| 35 to 39 Minutes | 105 (2.3%) | 91 (2.9%) |
| 40 to 44 Minutes | 199 (4.4%) | 56 (1.8%) |
| 45 to 59 Minutes | 492 (10.9%) | 290 (9.2%) |
| 60 to 89 Minutes | 236 (5.2%) | 123 (3.9%) |
| 90 or more Minutes | 153 (3.4%) | 43 (1.4%) |
Time of Departure to Work by Sex in Weirton
The most frequent times of departure to work in Weirton are 6:30 AM to 6:59 AM (708, 15.6%) for males and 7:00 AM to 7:29 AM (385, 12.2%) for females.
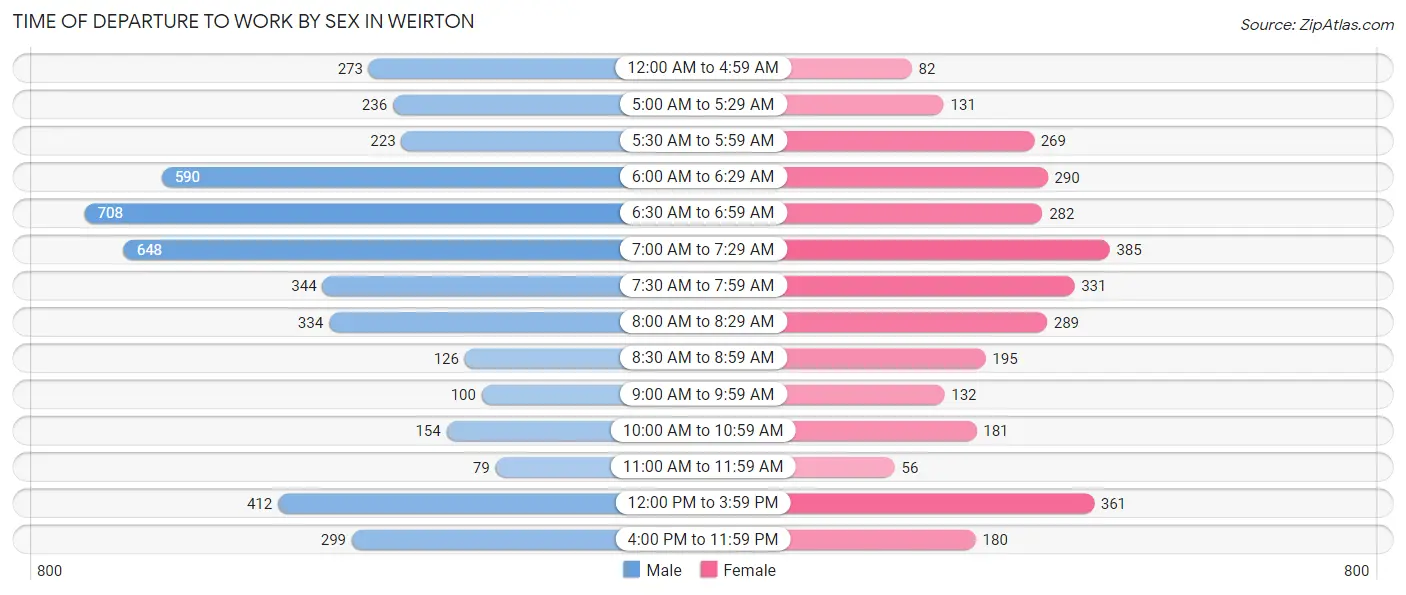
| Time of Departure | Male | Female |
| 12:00 AM to 4:59 AM | 273 (6.0%) | 82 (2.6%) |
| 5:00 AM to 5:29 AM | 236 (5.2%) | 131 (4.1%) |
| 5:30 AM to 5:59 AM | 223 (4.9%) | 269 (8.5%) |
| 6:00 AM to 6:29 AM | 590 (13.0%) | 290 (9.2%) |
| 6:30 AM to 6:59 AM | 708 (15.6%) | 282 (8.9%) |
| 7:00 AM to 7:29 AM | 648 (14.3%) | 385 (12.2%) |
| 7:30 AM to 7:59 AM | 344 (7.6%) | 331 (10.5%) |
| 8:00 AM to 8:29 AM | 334 (7.4%) | 289 (9.1%) |
| 8:30 AM to 8:59 AM | 126 (2.8%) | 195 (6.2%) |
| 9:00 AM to 9:59 AM | 100 (2.2%) | 132 (4.2%) |
| 10:00 AM to 10:59 AM | 154 (3.4%) | 181 (5.7%) |
| 11:00 AM to 11:59 AM | 79 (1.8%) | 56 (1.8%) |
| 12:00 PM to 3:59 PM | 412 (9.1%) | 361 (11.4%) |
| 4:00 PM to 11:59 PM | 299 (6.6%) | 180 (5.7%) |
| Total | 4,526 (100.0%) | 3,164 (100.0%) |
Housing Occupancy in Weirton
Occupancy by Ownership in Weirton
Of the total 8,762 dwellings in Weirton, owner-occupied units account for 5,913 (67.5%), while renter-occupied units make up 2,849 (32.5%).
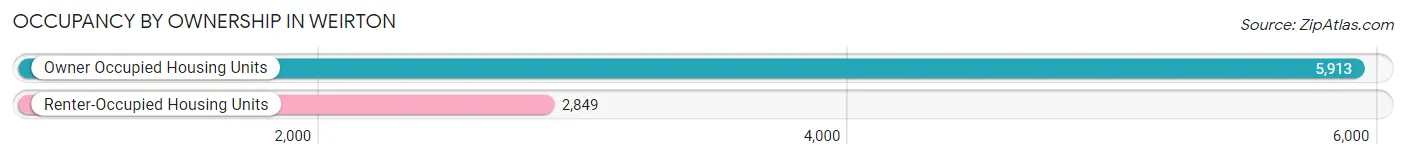
| Occupancy | # Housing Units | % Housing Units |
| Owner Occupied Housing Units | 5,913 | 67.5% |
| Renter-Occupied Housing Units | 2,849 | 32.5% |
| Total Occupied Housing Units | 8,762 | 100.0% |
Occupancy by Household Size in Weirton
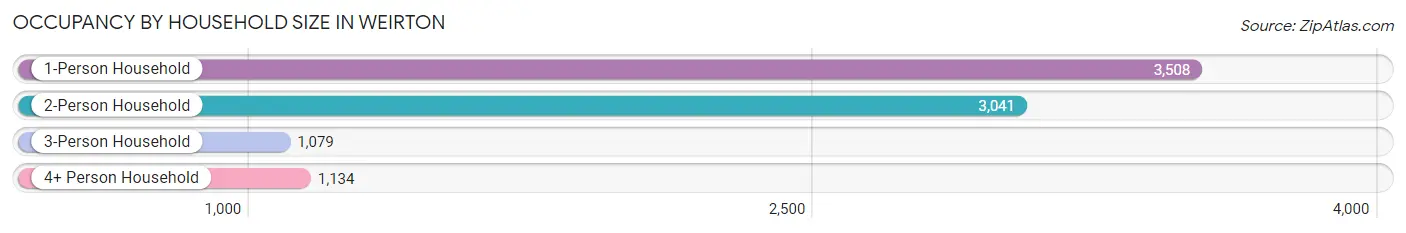
| Household Size | # Housing Units | % Housing Units |
| 1-Person Household | 3,508 | 40.0% |
| 2-Person Household | 3,041 | 34.7% |
| 3-Person Household | 1,079 | 12.3% |
| 4+ Person Household | 1,134 | 12.9% |
| Total Housing Units | 8,762 | 100.0% |
Occupancy by Ownership by Household Size in Weirton
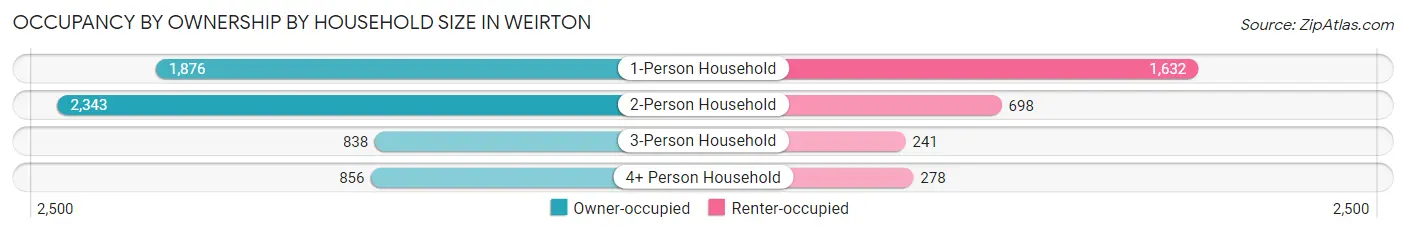
| Household Size | Owner-occupied | Renter-occupied |
| 1-Person Household | 1,876 (53.5%) | 1,632 (46.5%) |
| 2-Person Household | 2,343 (77.0%) | 698 (23.0%) |
| 3-Person Household | 838 (77.7%) | 241 (22.3%) |
| 4+ Person Household | 856 (75.5%) | 278 (24.5%) |
| Total Housing Units | 5,913 (67.5%) | 2,849 (32.5%) |
Occupancy by Educational Attainment in Weirton
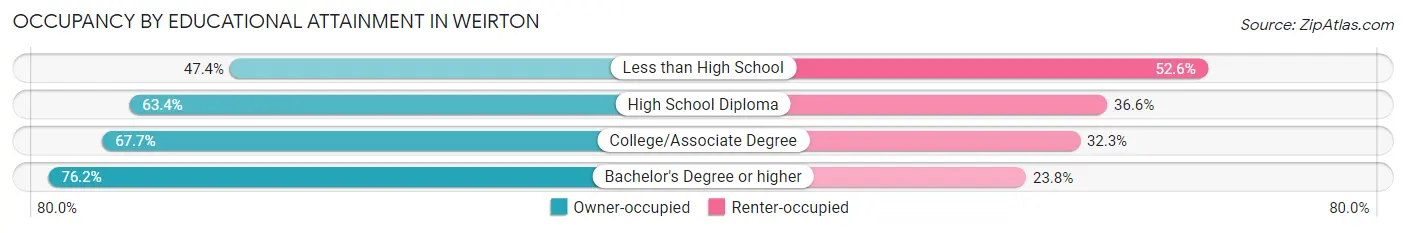
| Household Size | Owner-occupied | Renter-occupied |
| Less than High School | 148 (47.4%) | 164 (52.6%) |
| High School Diploma | 1,927 (63.4%) | 1,114 (36.6%) |
| College/Associate Degree | 2,260 (67.7%) | 1,079 (32.3%) |
| Bachelor's Degree or higher | 1,578 (76.2%) | 492 (23.8%) |
Occupancy by Age of Householder in Weirton
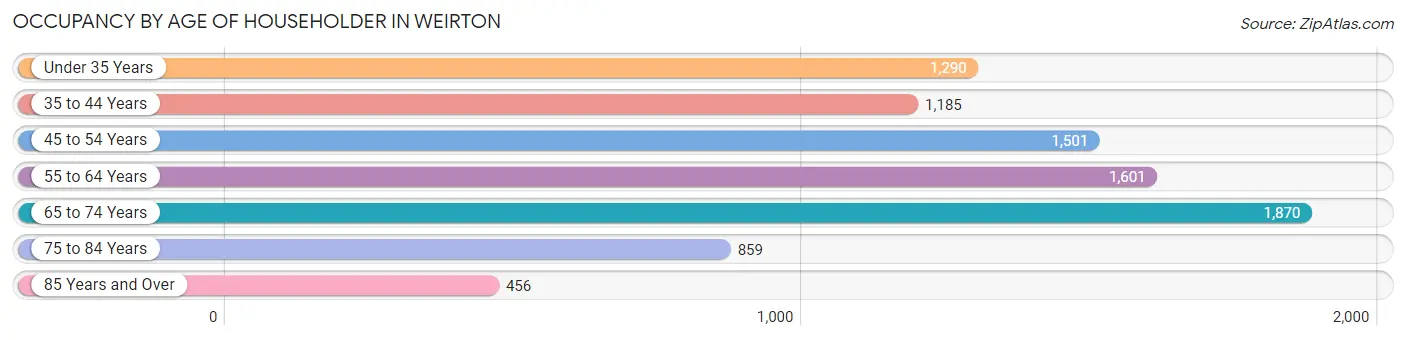
| Age Bracket | # Households | % Households |
| Under 35 Years | 1,290 | 14.7% |
| 35 to 44 Years | 1,185 | 13.5% |
| 45 to 54 Years | 1,501 | 17.1% |
| 55 to 64 Years | 1,601 | 18.3% |
| 65 to 74 Years | 1,870 | 21.3% |
| 75 to 84 Years | 859 | 9.8% |
| 85 Years and Over | 456 | 5.2% |
| Total | 8,762 | 100.0% |
Housing Finances in Weirton
Median Income by Occupancy in Weirton
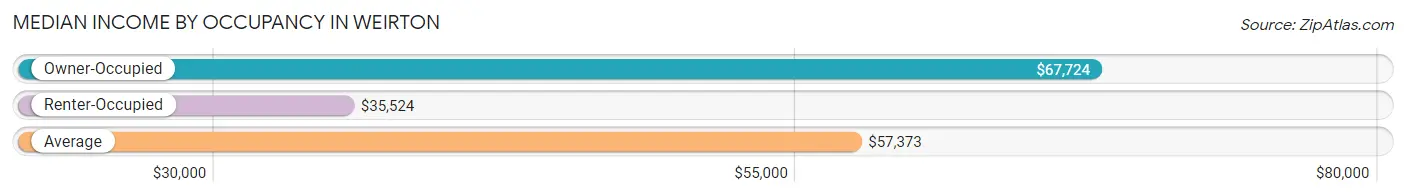
| Occupancy Type | # Households | Median Income |
| Owner-Occupied | 5,913 (67.5%) | $67,724 |
| Renter-Occupied | 2,849 (32.5%) | $35,524 |
| Average | 8,762 (100.0%) | $57,373 |
Occupancy by Householder Income Bracket in Weirton
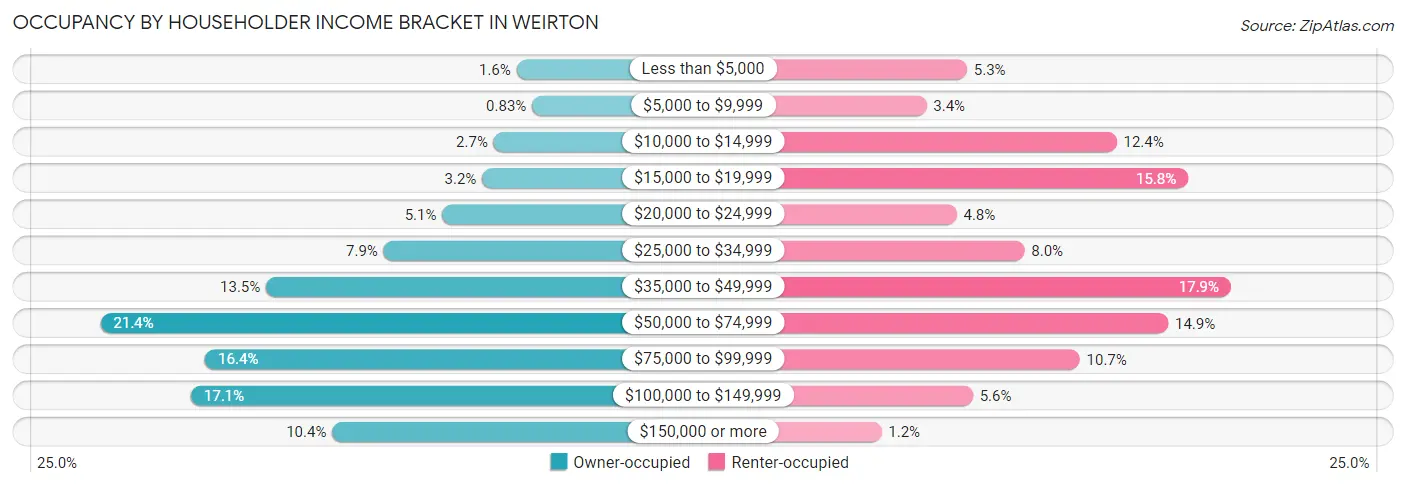
| Income Bracket | Owner-occupied | Renter-occupied |
| Less than $5,000 | 93 (1.6%) | 151 (5.3%) |
| $5,000 to $9,999 | 49 (0.8%) | 96 (3.4%) |
| $10,000 to $14,999 | 157 (2.7%) | 354 (12.4%) |
| $15,000 to $19,999 | 190 (3.2%) | 451 (15.8%) |
| $20,000 to $24,999 | 302 (5.1%) | 137 (4.8%) |
| $25,000 to $34,999 | 467 (7.9%) | 229 (8.0%) |
| $35,000 to $49,999 | 798 (13.5%) | 509 (17.9%) |
| $50,000 to $74,999 | 1,265 (21.4%) | 424 (14.9%) |
| $75,000 to $99,999 | 970 (16.4%) | 304 (10.7%) |
| $100,000 to $149,999 | 1,010 (17.1%) | 159 (5.6%) |
| $150,000 or more | 612 (10.3%) | 35 (1.2%) |
| Total | 5,913 (100.0%) | 2,849 (100.0%) |
Monthly Housing Cost Tiers in Weirton
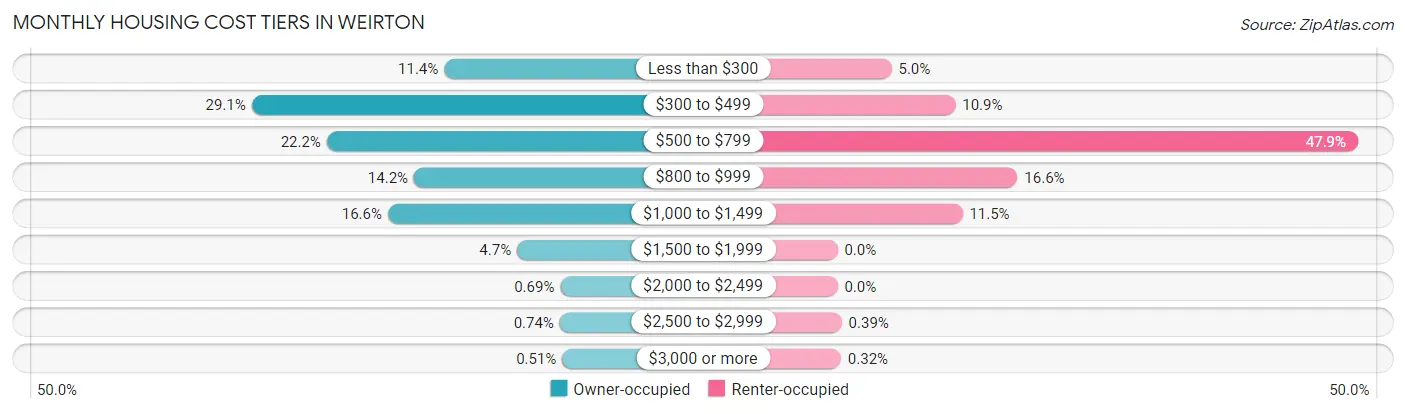
| Monthly Cost | Owner-occupied | Renter-occupied |
| Less than $300 | 673 (11.4%) | 142 (5.0%) |
| $300 to $499 | 1,721 (29.1%) | 309 (10.8%) |
| $500 to $799 | 1,312 (22.2%) | 1,365 (47.9%) |
| $800 to $999 | 837 (14.2%) | 472 (16.6%) |
| $1,000 to $1,499 | 979 (16.6%) | 328 (11.5%) |
| $1,500 to $1,999 | 276 (4.7%) | 0 (0.0%) |
| $2,000 to $2,499 | 41 (0.7%) | 0 (0.0%) |
| $2,500 to $2,999 | 44 (0.7%) | 11 (0.4%) |
| $3,000 or more | 30 (0.5%) | 9 (0.3%) |
| Total | 5,913 (100.0%) | 2,849 (100.0%) |
Physical Housing Characteristics in Weirton
Housing Structures in Weirton
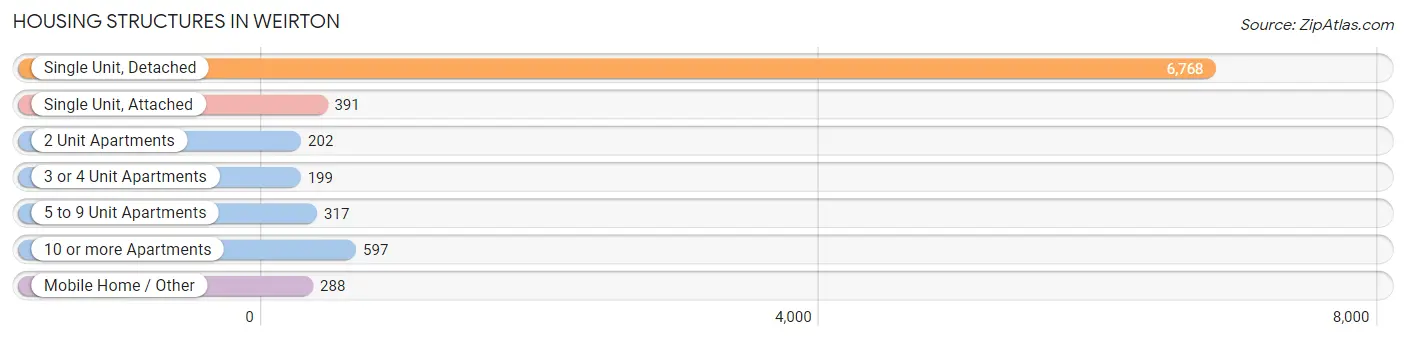
| Structure Type | # Housing Units | % Housing Units |
| Single Unit, Detached | 6,768 | 77.2% |
| Single Unit, Attached | 391 | 4.5% |
| 2 Unit Apartments | 202 | 2.3% |
| 3 or 4 Unit Apartments | 199 | 2.3% |
| 5 to 9 Unit Apartments | 317 | 3.6% |
| 10 or more Apartments | 597 | 6.8% |
| Mobile Home / Other | 288 | 3.3% |
| Total | 8,762 | 100.0% |
Housing Structures by Occupancy in Weirton
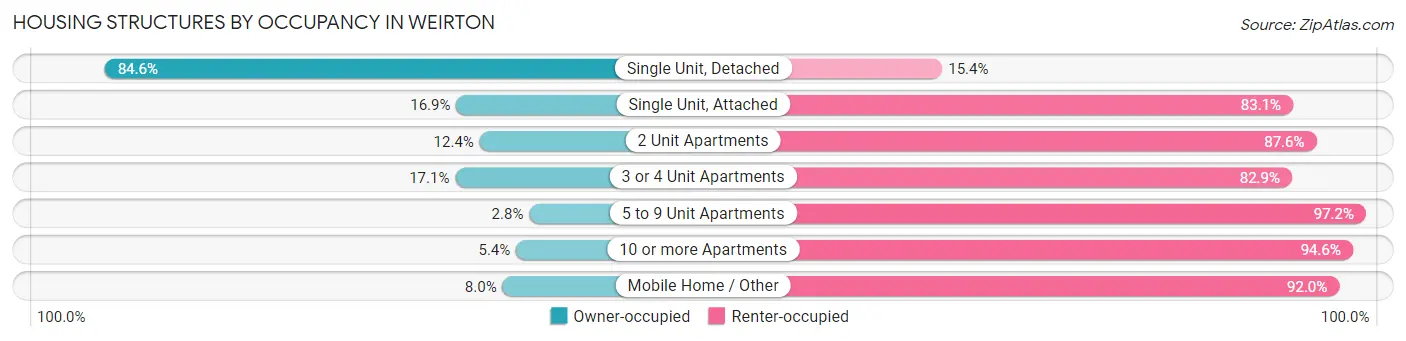
| Structure Type | Owner-occupied | Renter-occupied |
| Single Unit, Detached | 5,724 (84.6%) | 1,044 (15.4%) |
| Single Unit, Attached | 66 (16.9%) | 325 (83.1%) |
| 2 Unit Apartments | 25 (12.4%) | 177 (87.6%) |
| 3 or 4 Unit Apartments | 34 (17.1%) | 165 (82.9%) |
| 5 to 9 Unit Apartments | 9 (2.8%) | 308 (97.2%) |
| 10 or more Apartments | 32 (5.4%) | 565 (94.6%) |
| Mobile Home / Other | 23 (8.0%) | 265 (92.0%) |
| Total | 5,913 (67.5%) | 2,849 (32.5%) |
Housing Structures by Number of Rooms in Weirton
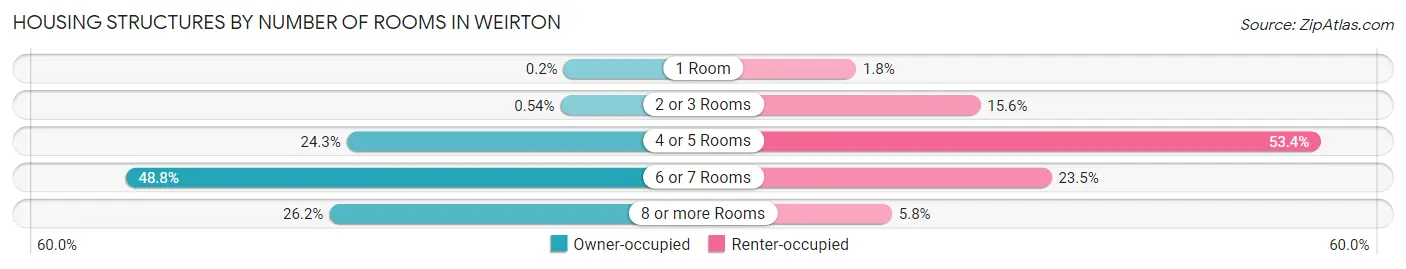
| Number of Rooms | Owner-occupied | Renter-occupied |
| 1 Room | 12 (0.2%) | 51 (1.8%) |
| 2 or 3 Rooms | 32 (0.5%) | 444 (15.6%) |
| 4 or 5 Rooms | 1,435 (24.3%) | 1,521 (53.4%) |
| 6 or 7 Rooms | 2,885 (48.8%) | 669 (23.5%) |
| 8 or more Rooms | 1,549 (26.2%) | 164 (5.8%) |
| Total | 5,913 (100.0%) | 2,849 (100.0%) |
Housing Structure by Heating Type in Weirton
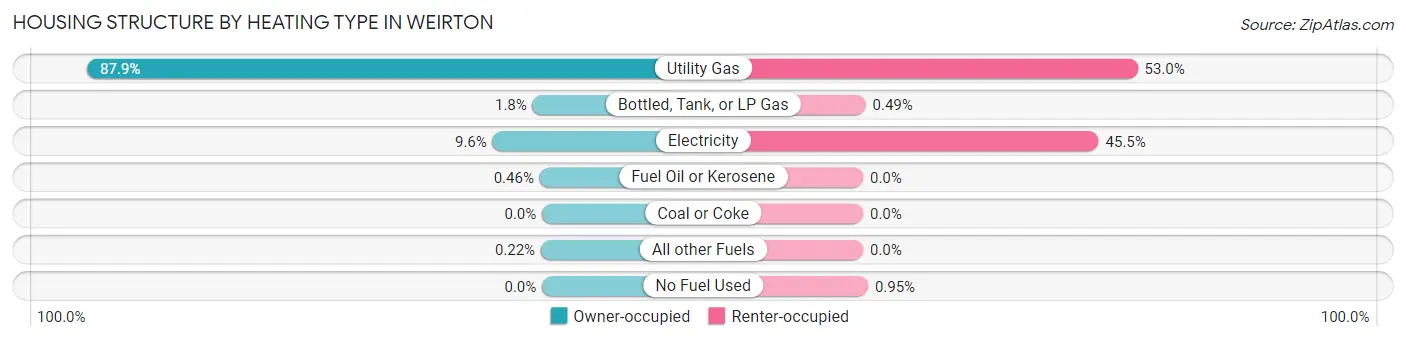
| Heating Type | Owner-occupied | Renter-occupied |
| Utility Gas | 5,200 (87.9%) | 1,511 (53.0%) |
| Bottled, Tank, or LP Gas | 108 (1.8%) | 14 (0.5%) |
| Electricity | 565 (9.6%) | 1,297 (45.5%) |
| Fuel Oil or Kerosene | 27 (0.5%) | 0 (0.0%) |
| Coal or Coke | 0 (0.0%) | 0 (0.0%) |
| All other Fuels | 13 (0.2%) | 0 (0.0%) |
| No Fuel Used | 0 (0.0%) | 27 (0.9%) |
| Total | 5,913 (100.0%) | 2,849 (100.0%) |
Household Vehicle Usage in Weirton
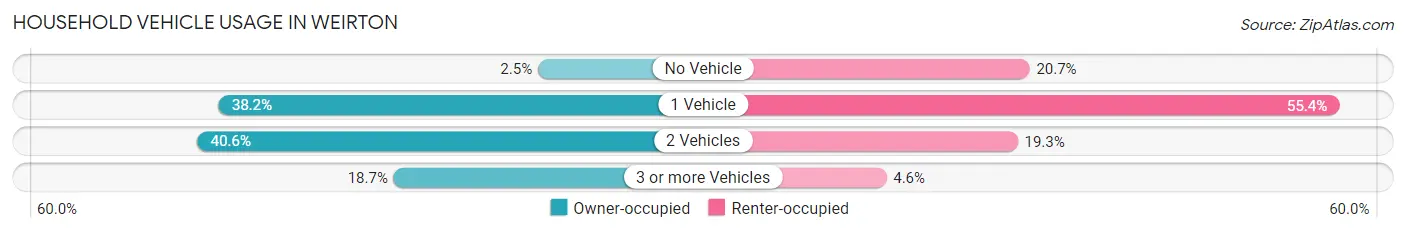
| Vehicles per Household | Owner-occupied | Renter-occupied |
| No Vehicle | 147 (2.5%) | 589 (20.7%) |
| 1 Vehicle | 2,261 (38.2%) | 1,577 (55.3%) |
| 2 Vehicles | 2,402 (40.6%) | 551 (19.3%) |
| 3 or more Vehicles | 1,103 (18.6%) | 132 (4.6%) |
| Total | 5,913 (100.0%) | 2,849 (100.0%) |
Real Estate & Mortgages in Weirton
Real Estate and Mortgage Overview in Weirton
| Characteristic | Without Mortgage | With Mortgage |
| Housing Units | 3,098 | 2,815 |
| Median Property Value | $108,500 | $120,700 |
| Median Household Income | $57,989 | $318 |
| Monthly Housing Costs | $386 | $30 |
| Real Estate Taxes | $715 | $35 |
Property Value by Mortgage Status in Weirton
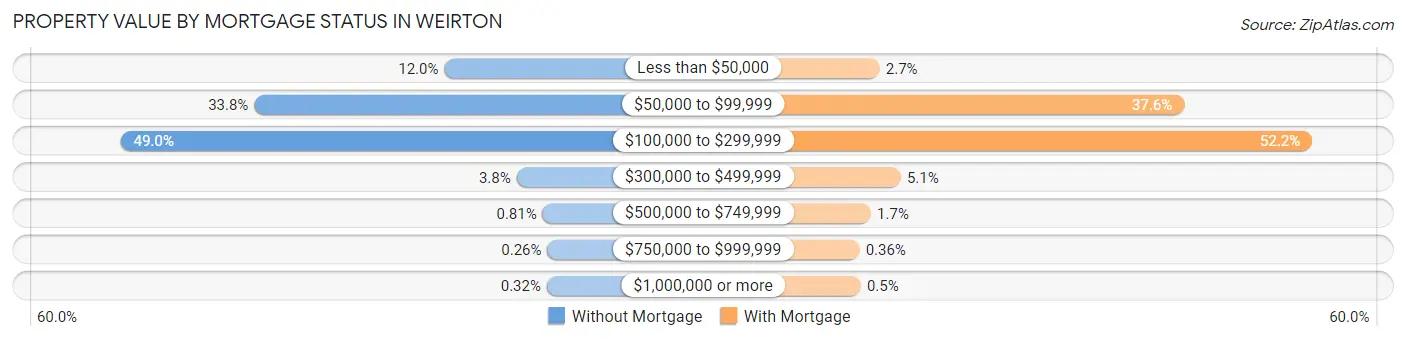
| Property Value | Without Mortgage | With Mortgage |
| Less than $50,000 | 373 (12.0%) | 75 (2.7%) |
| $50,000 to $99,999 | 1,046 (33.8%) | 1,057 (37.6%) |
| $100,000 to $299,999 | 1,519 (49.0%) | 1,469 (52.2%) |
| $300,000 to $499,999 | 117 (3.8%) | 143 (5.1%) |
| $500,000 to $749,999 | 25 (0.8%) | 47 (1.7%) |
| $750,000 to $999,999 | 8 (0.3%) | 10 (0.4%) |
| $1,000,000 or more | 10 (0.3%) | 14 (0.5%) |
| Total | 3,098 (100.0%) | 2,815 (100.0%) |
Household Income by Mortgage Status in Weirton
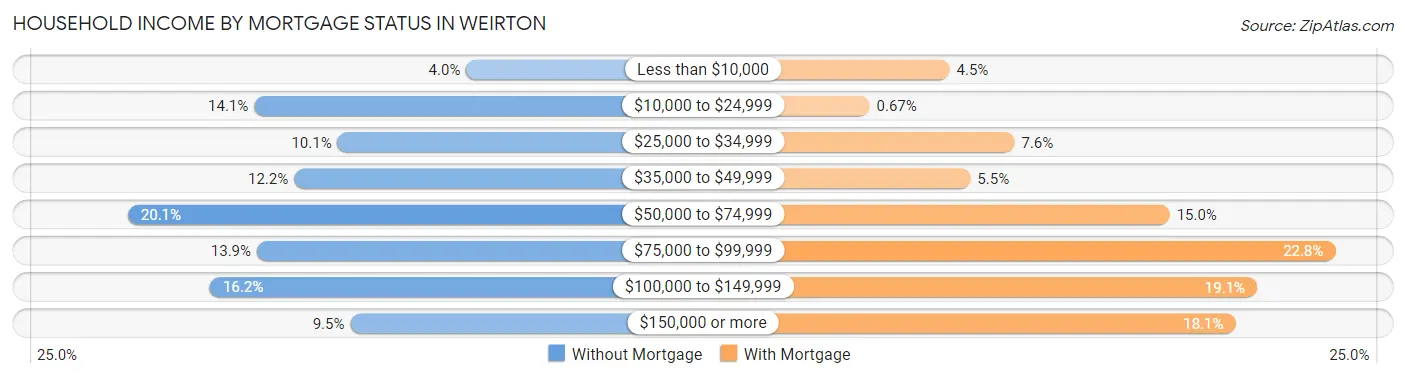
| Household Income | Without Mortgage | With Mortgage |
| Less than $10,000 | 123 (4.0%) | 126 (4.5%) |
| $10,000 to $24,999 | 436 (14.1%) | 19 (0.7%) |
| $25,000 to $34,999 | 313 (10.1%) | 213 (7.6%) |
| $35,000 to $49,999 | 377 (12.2%) | 154 (5.5%) |
| $50,000 to $74,999 | 622 (20.1%) | 421 (15.0%) |
| $75,000 to $99,999 | 432 (13.9%) | 643 (22.8%) |
| $100,000 to $149,999 | 501 (16.2%) | 538 (19.1%) |
| $150,000 or more | 294 (9.5%) | 509 (18.1%) |
| Total | 3,098 (100.0%) | 2,815 (100.0%) |
Property Value to Household Income Ratio in Weirton
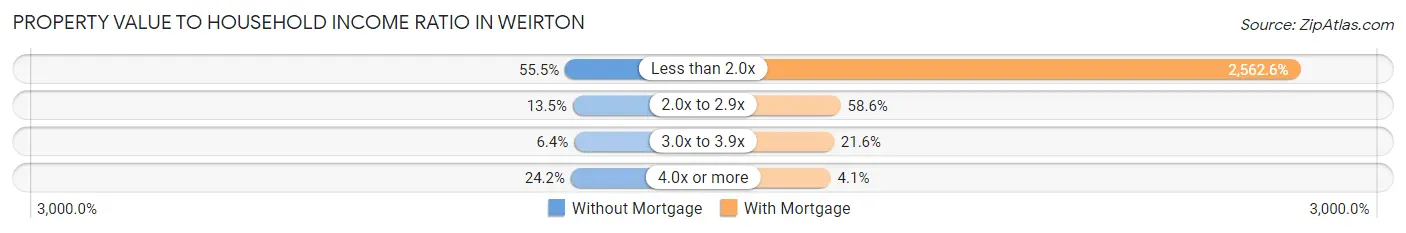
| Value-to-Income Ratio | Without Mortgage | With Mortgage |
| Less than 2.0x | 1,718 (55.5%) | 72,137 (2,562.6%) |
| 2.0x to 2.9x | 417 (13.5%) | 1,650 (58.6%) |
| 3.0x to 3.9x | 198 (6.4%) | 607 (21.6%) |
| 4.0x or more | 749 (24.2%) | 116 (4.1%) |
| Total | 3,098 (100.0%) | 2,815 (100.0%) |
Real Estate Taxes by Mortgage Status in Weirton
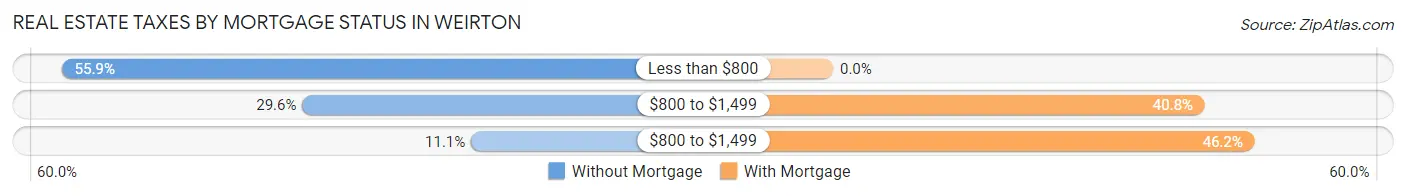
| Property Taxes | Without Mortgage | With Mortgage |
| Less than $800 | 1,733 (55.9%) | 0 (0.0%) |
| $800 to $1,499 | 916 (29.6%) | 1,147 (40.7%) |
| $800 to $1,499 | 343 (11.1%) | 1,301 (46.2%) |
| Total | 3,098 (100.0%) | 2,815 (100.0%) |
Health & Disability in Weirton
Health Insurance Coverage by Age in Weirton
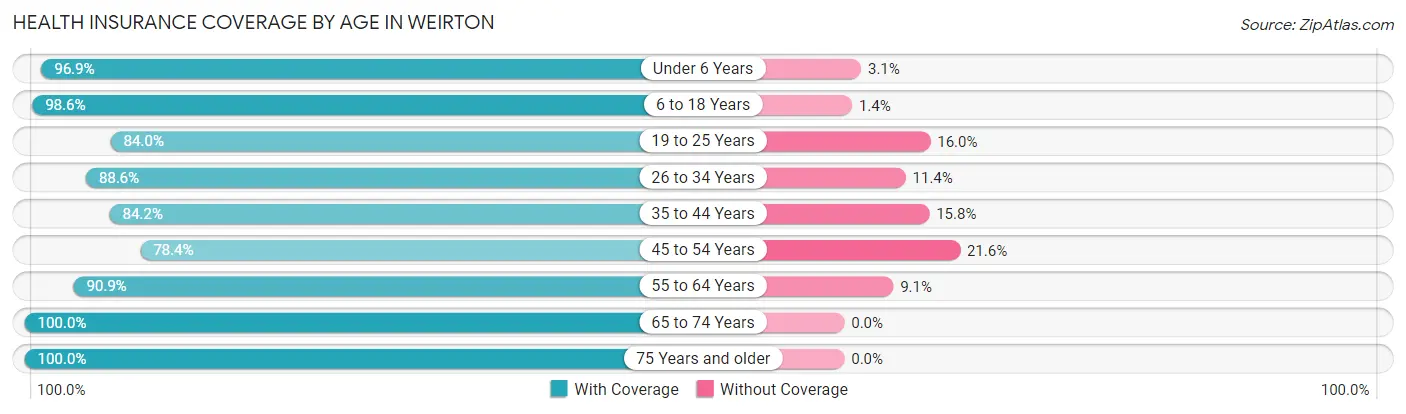
| Age Bracket | With Coverage | Without Coverage |
| Under 6 Years | 1,056 (96.9%) | 34 (3.1%) |
| 6 to 18 Years | 2,488 (98.6%) | 36 (1.4%) |
| 19 to 25 Years | 1,079 (84.0%) | 206 (16.0%) |
| 26 to 34 Years | 1,860 (88.6%) | 240 (11.4%) |
| 35 to 44 Years | 1,992 (84.2%) | 375 (15.8%) |
| 45 to 54 Years | 1,833 (78.4%) | 504 (21.6%) |
| 55 to 64 Years | 2,363 (90.9%) | 237 (9.1%) |
| 65 to 74 Years | 2,573 (100.0%) | 0 (0.0%) |
| 75 Years and older | 1,852 (100.0%) | 0 (0.0%) |
| Total | 17,096 (91.3%) | 1,632 (8.7%) |
Health Insurance Coverage by Citizenship Status in Weirton
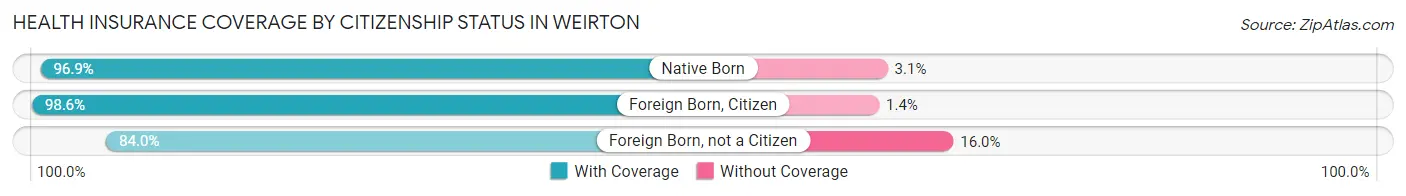
| Citizenship Status | With Coverage | Without Coverage |
| Native Born | 1,056 (96.9%) | 34 (3.1%) |
| Foreign Born, Citizen | 2,488 (98.6%) | 36 (1.4%) |
| Foreign Born, not a Citizen | 1,079 (84.0%) | 206 (16.0%) |
Health Insurance Coverage by Household Income in Weirton
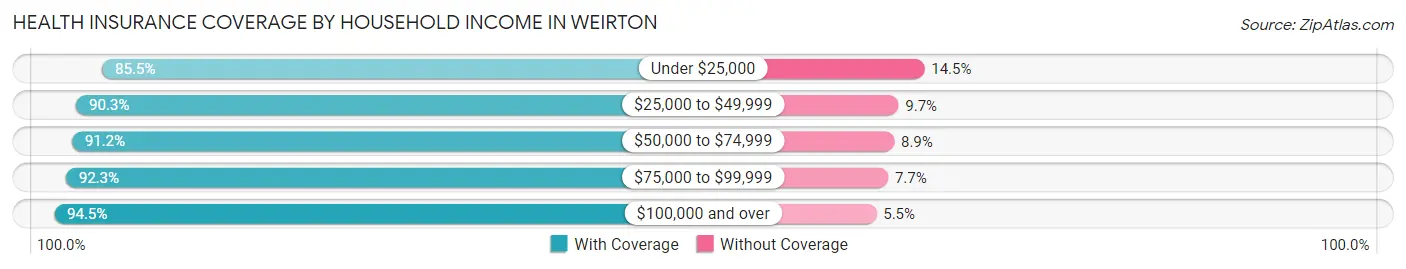
| Household Income | With Coverage | Without Coverage |
| Under $25,000 | 2,302 (85.5%) | 391 (14.5%) |
| $25,000 to $49,999 | 3,562 (90.3%) | 381 (9.7%) |
| $50,000 to $74,999 | 3,071 (91.1%) | 298 (8.8%) |
| $75,000 to $99,999 | 3,406 (92.3%) | 285 (7.7%) |
| $100,000 and over | 4,741 (94.5%) | 277 (5.5%) |
Public vs Private Health Insurance Coverage by Age in Weirton
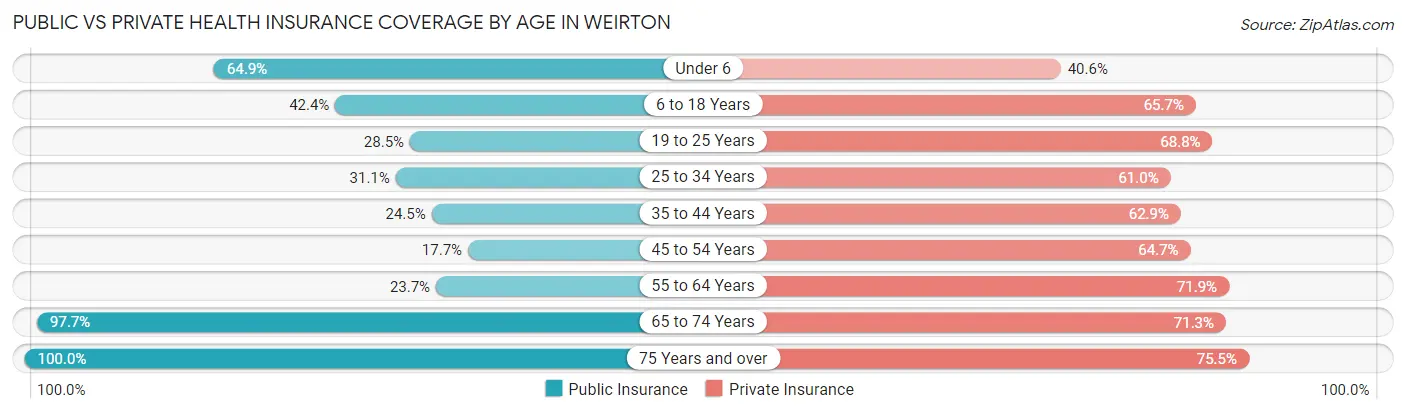
| Age Bracket | Public Insurance | Private Insurance |
| Under 6 | 707 (64.9%) | 443 (40.6%) |
| 6 to 18 Years | 1,069 (42.3%) | 1,658 (65.7%) |
| 19 to 25 Years | 366 (28.5%) | 884 (68.8%) |
| 25 to 34 Years | 654 (31.1%) | 1,281 (61.0%) |
| 35 to 44 Years | 579 (24.5%) | 1,489 (62.9%) |
| 45 to 54 Years | 414 (17.7%) | 1,512 (64.7%) |
| 55 to 64 Years | 615 (23.6%) | 1,868 (71.9%) |
| 65 to 74 Years | 2,514 (97.7%) | 1,834 (71.3%) |
| 75 Years and over | 1,852 (100.0%) | 1,399 (75.5%) |
| Total | 8,770 (46.8%) | 12,368 (66.0%) |
Disability Status by Sex by Age in Weirton
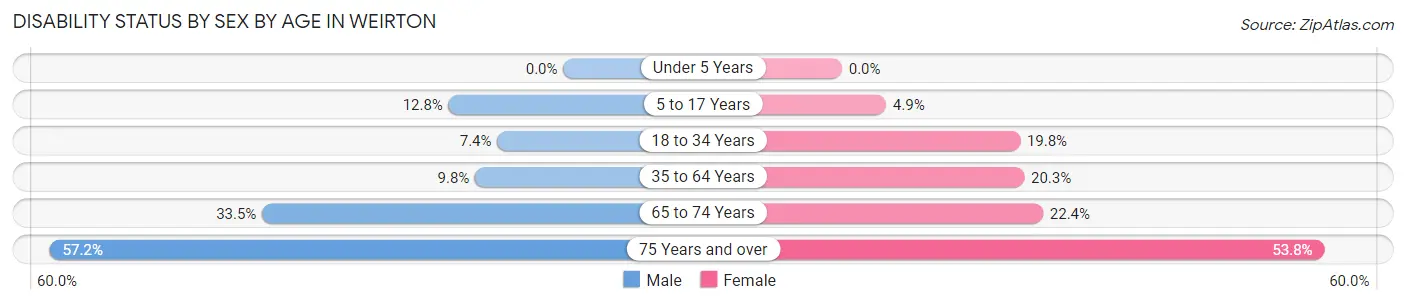
| Age Bracket | Male | Female |
| Under 5 Years | 0 (0.0%) | 0 (0.0%) |
| 5 to 17 Years | 176 (12.8%) | 62 (4.9%) |
| 18 to 34 Years | 140 (7.3%) | 320 (19.8%) |
| 35 to 64 Years | 373 (9.8%) | 712 (20.3%) |
| 65 to 74 Years | 430 (33.5%) | 289 (22.4%) |
| 75 Years and over | 389 (57.2%) | 630 (53.7%) |
Disability Class by Sex by Age in Weirton
Disability Class: Hearing Difficulty
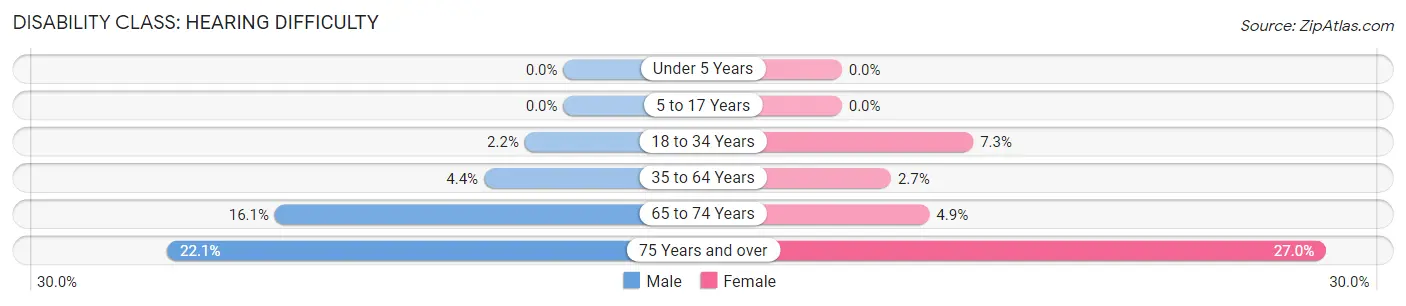
| Age Bracket | Male | Female |
| Under 5 Years | 0 (0.0%) | 0 (0.0%) |
| 5 to 17 Years | 0 (0.0%) | 0 (0.0%) |
| 18 to 34 Years | 41 (2.1%) | 118 (7.3%) |
| 35 to 64 Years | 168 (4.4%) | 96 (2.7%) |
| 65 to 74 Years | 206 (16.1%) | 63 (4.9%) |
| 75 Years and over | 150 (22.1%) | 316 (27.0%) |
Disability Class: Vision Difficulty
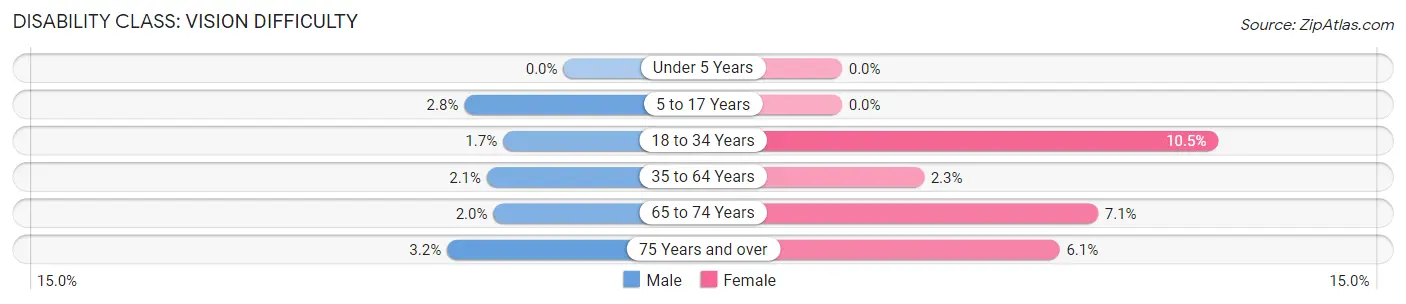
| Age Bracket | Male | Female |
| Under 5 Years | 0 (0.0%) | 0 (0.0%) |
| 5 to 17 Years | 38 (2.8%) | 0 (0.0%) |
| 18 to 34 Years | 32 (1.7%) | 169 (10.5%) |
| 35 to 64 Years | 81 (2.1%) | 80 (2.3%) |
| 65 to 74 Years | 25 (1.9%) | 92 (7.1%) |
| 75 Years and over | 22 (3.2%) | 71 (6.1%) |
Disability Class: Cognitive Difficulty
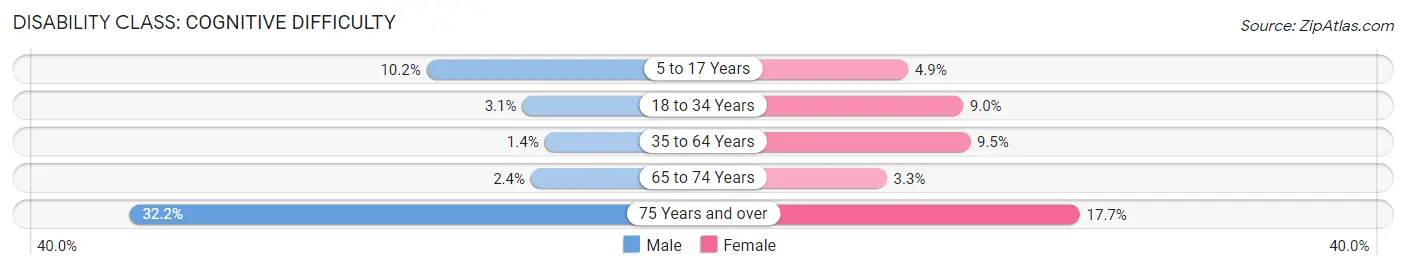
| Age Bracket | Male | Female |
| 5 to 17 Years | 140 (10.2%) | 62 (4.9%) |
| 18 to 34 Years | 58 (3.0%) | 145 (9.0%) |
| 35 to 64 Years | 53 (1.4%) | 334 (9.5%) |
| 65 to 74 Years | 31 (2.4%) | 43 (3.3%) |
| 75 Years and over | 219 (32.2%) | 207 (17.7%) |
Disability Class: Ambulatory Difficulty
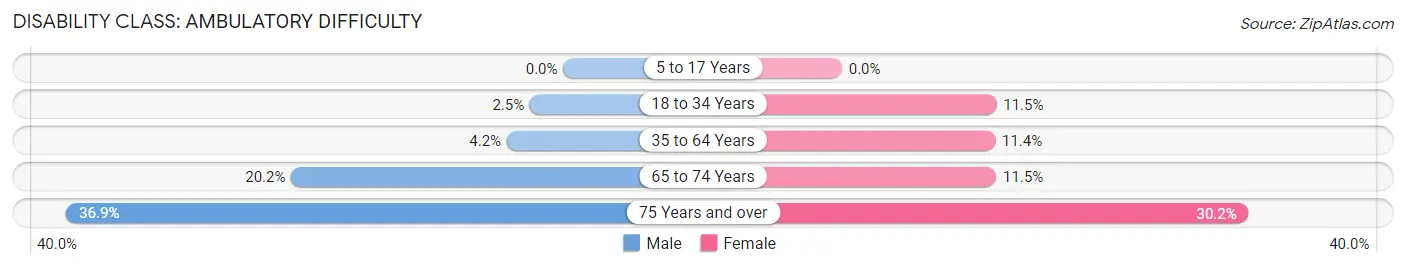
| Age Bracket | Male | Female |
| 5 to 17 Years | 0 (0.0%) | 0 (0.0%) |
| 18 to 34 Years | 47 (2.5%) | 185 (11.5%) |
| 35 to 64 Years | 159 (4.2%) | 399 (11.4%) |
| 65 to 74 Years | 259 (20.2%) | 148 (11.5%) |
| 75 Years and over | 251 (36.9%) | 354 (30.2%) |
Disability Class: Self-Care Difficulty
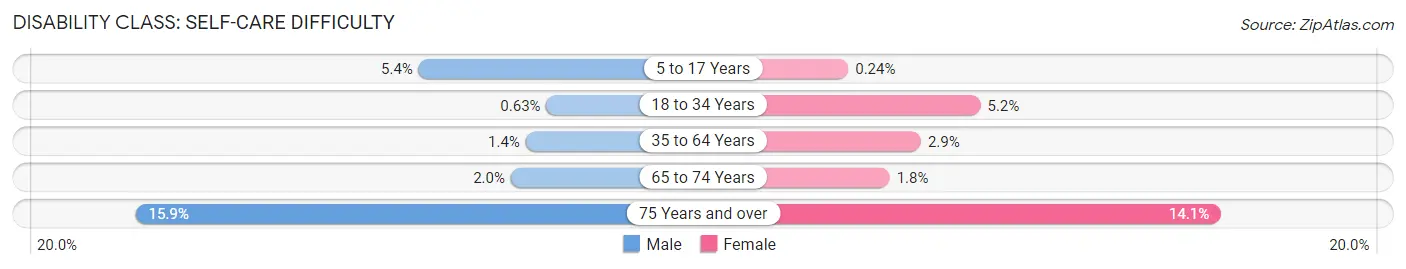
| Age Bracket | Male | Female |
| 5 to 17 Years | 74 (5.4%) | 3 (0.2%) |
| 18 to 34 Years | 12 (0.6%) | 83 (5.1%) |
| 35 to 64 Years | 53 (1.4%) | 103 (2.9%) |
| 65 to 74 Years | 25 (1.9%) | 23 (1.8%) |
| 75 Years and over | 108 (15.9%) | 165 (14.1%) |
Technology Access in Weirton
Computing Device Access in Weirton
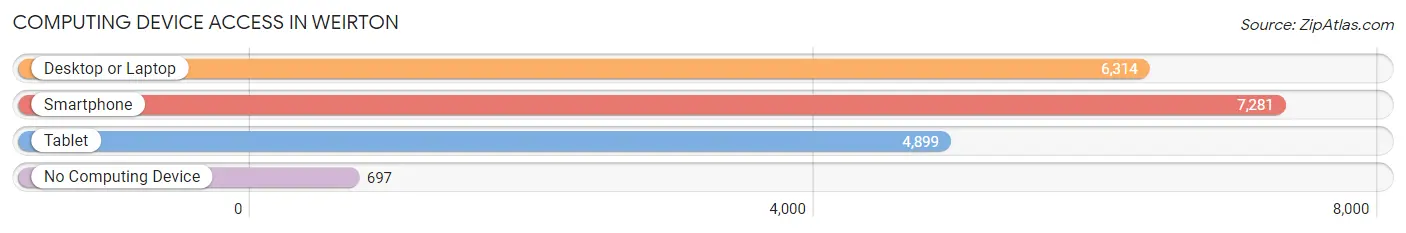
| Device Type | # Households | % Households |
| Desktop or Laptop | 6,314 | 72.1% |
| Smartphone | 7,281 | 83.1% |
| Tablet | 4,899 | 55.9% |
| No Computing Device | 697 | 8.0% |
| Total | 8,762 | 100.0% |
Internet Access in Weirton
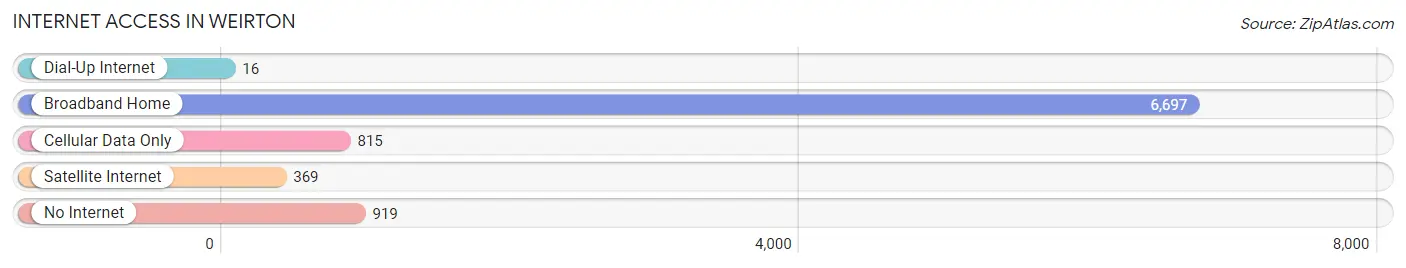
| Internet Type | # Households | % Households |
| Dial-Up Internet | 16 | 0.2% |
| Broadband Home | 6,697 | 76.4% |
| Cellular Data Only | 815 | 9.3% |
| Satellite Internet | 369 | 4.2% |
| No Internet | 919 | 10.5% |
| Total | 8,762 | 100.0% |
Weirton Summary
Weirton, West Virginia is a city located in the northern panhandle of the state, along the Ohio River. It is part of the Weirton-Steubenville, WV-OH Metropolitan Statistical Area, and is the largest city in Hancock County. The city was founded in 1793 and incorporated in 1947.
History
Weirton was originally part of the Virginia Colony, and was settled by the Weir family in 1793. The family built a gristmill and a sawmill on the banks of the Ohio River, and the settlement was named Weirs Mill. The settlement grew slowly, and in 1839, the first post office was established. In 1849, the town was renamed Weirton, and in 1853, the first school was built.
In the late 19th century, Weirton began to experience rapid growth due to the steel industry. The Weirton Steel Company was founded in 1909, and the city was incorporated in 1947. The steel industry continued to be the main source of employment for the city until the late 20th century, when the industry began to decline.
Geography
Weirton is located in the northern panhandle of West Virginia, along the Ohio River. It is bordered by the states of Ohio and Pennsylvania. The city has a total area of 8.3 square miles, of which 8.2 square miles is land and 0.1 square miles is water. The city is located in the Appalachian Plateau region of West Virginia, and is part of the Appalachian Mountains.
Economy
Weirton’s economy is largely based on the steel industry. The Weirton Steel Company is the largest employer in the city, and is the largest steel mill in the United States. Other major employers in the city include the Weirton Medical Center, the Weirton Area Chamber of Commerce, and the Weirton Area Board of Education.
The city also has a growing tourism industry, with attractions such as the Weirton Steel Museum, the Weirton Event Center, and the Weirton Area Historical Society.
Demographics
As of the 2010 census, the population of Weirton was 19,746. The racial makeup of the city was 92.3% White, 4.2% African American, 0.3% Native American, 0.7% Asian, 0.1% Pacific Islander, 0.7% from other races, and 1.7% from two or more races. Hispanic or Latino of any race were 1.9% of the population.
The median household income in Weirton was $37,945, and the median family income was $45,945. The per capita income for the city was $20,845. About 11.3% of families and 14.2% of the population were below the poverty line, including 20.2% of those under age 18 and 8.2% of those age 65 or over.
Common Questions
What is Per Capita Income in Weirton?
Per Capita income in Weirton is $35,662.
What is the Median Family Income in Weirton?
Median Family Income in Weirton is $72,141.
What is the Median Household income in Weirton?
Median Household Income in Weirton is $57,373.
What is Income or Wage Gap in Weirton?
Income or Wage Gap in Weirton is 39.1%.
Women in Weirton earn 60.9 cents for every dollar earned by a man.
What is Family Income Deficit in Weirton?
Family Income Deficit in Weirton is $10,831.
Families that are below poverty line in Weirton earn $10,831 less on average than the poverty threshold level.
What is Inequality or Gini Index in Weirton?
Inequality or Gini Index in Weirton is 0.46.
What is the Total Population of Weirton?
Total Population of Weirton is 18,971.
What is the Total Male Population of Weirton?
Total Male Population of Weirton is 9,434.
What is the Total Female Population of Weirton?
Total Female Population of Weirton is 9,537.
What is the Ratio of Males per 100 Females in Weirton?
There are 98.92 Males per 100 Females in Weirton.
What is the Ratio of Females per 100 Males in Weirton?
There are 101.09 Females per 100 Males in Weirton.
What is the Median Population Age in Weirton?
Median Population Age in Weirton is 45.5 Years.
What is the Average Family Size in Weirton
Average Family Size in Weirton is 2.9 People.
What is the Average Household Size in Weirton
Average Household Size in Weirton is 2.1 People.
How Large is the Labor Force in Weirton?
There are 9,373 People in the Labor Forcein in Weirton.
What is the Percentage of People in the Labor Force in Weirton?
58.7% of People are in the Labor Force in Weirton.
What is the Unemployment Rate in Weirton?
Unemployment Rate in Weirton is 7.8%.