Chesapeake, WV Map & Demographics
Chesapeake Map
Chesapeake Overview
$21,790
PER CAPITA INCOME
$60,781
AVG FAMILY INCOME
$48,375
AVG HOUSEHOLD INCOME
22.0%
WAGE / INCOME GAP [ % ]
78.0¢/ $1
WAGE / INCOME GAP [ $ ]
0.42
INEQUALITY / GINI INDEX
1,585
TOTAL POPULATION
770
MALE POPULATION
815
FEMALE POPULATION
94.48
MALES / 100 FEMALES
105.84
FEMALES / 100 MALES
39.2
MEDIAN AGE
2.8
AVG FAMILY SIZE
2.3
AVG HOUSEHOLD SIZE
503
LABOR FORCE [ PEOPLE ]
39.5%
PERCENT IN LABOR FORCE
5.4%
UNEMPLOYMENT RATE
Chesapeake Area Codes
Income in Chesapeake
Income Overview in Chesapeake
Per Capita Income in Chesapeake is $21,790, while median incomes of families and households are $60,781 and $48,375 respectively.
| Characteristic | Number | Measure |
| Per Capita Income | 1,585 | $21,790 |
| Median Family Income | 454 | $60,781 |
| Mean Family Income | 454 | $61,067 |
| Median Household Income | 694 | $48,375 |
| Mean Household Income | 694 | $52,635 |
| Income Deficit | 454 | $0 |
| Wage / Income Gap (%) | 1,585 | 22.02% |
| Wage / Income Gap ($) | 1,585 | 77.98¢ per $1 |
| Gini / Inequality Index | 1,585 | 0.42 |
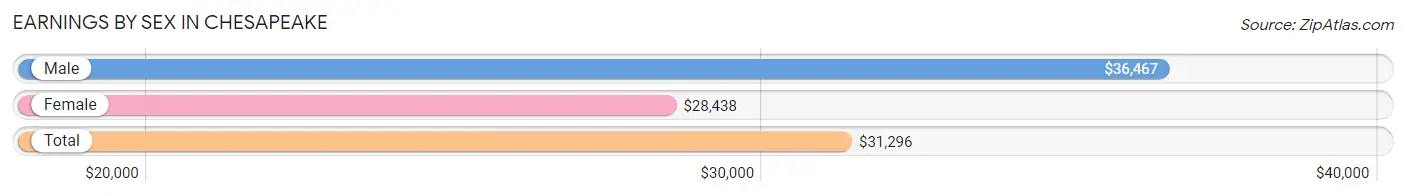
Earnings by Sex in Chesapeake
Average Earnings in Chesapeake are $31,296, $36,467 for men and $28,438 for women, a difference of 22.0%.
| Sex | Number | Average Earnings |
| Male | 287 (46.1%) | $36,467 |
| Female | 335 (53.9%) | $28,438 |
| Total | 622 (100.0%) | $31,296 |
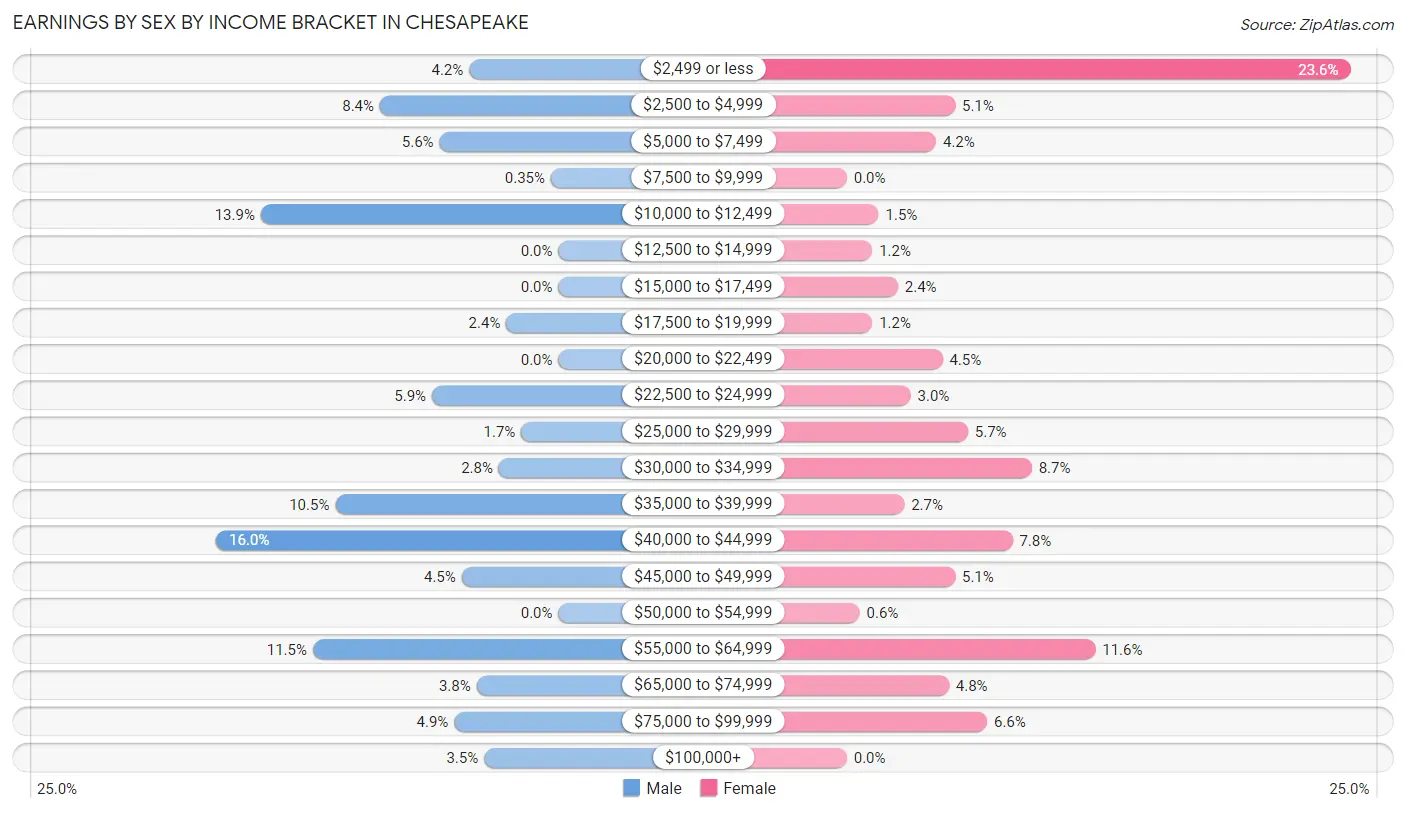
Earnings by Sex by Income Bracket in Chesapeake
The most common earnings brackets in Chesapeake are $40,000 to $44,999 for men (46 | 16.0%) and $2,499 or less for women (79 | 23.6%).
| Income | Male | Female |
| $2,499 or less | 12 (4.2%) | 79 (23.6%) |
| $2,500 to $4,999 | 24 (8.4%) | 17 (5.1%) |
| $5,000 to $7,499 | 16 (5.6%) | 14 (4.2%) |
| $7,500 to $9,999 | 1 (0.4%) | 0 (0.0%) |
| $10,000 to $12,499 | 40 (13.9%) | 5 (1.5%) |
| $12,500 to $14,999 | 0 (0.0%) | 4 (1.2%) |
| $15,000 to $17,499 | 0 (0.0%) | 8 (2.4%) |
| $17,500 to $19,999 | 7 (2.4%) | 4 (1.2%) |
| $20,000 to $22,499 | 0 (0.0%) | 15 (4.5%) |
| $22,500 to $24,999 | 17 (5.9%) | 10 (3.0%) |
| $25,000 to $29,999 | 5 (1.7%) | 19 (5.7%) |
| $30,000 to $34,999 | 8 (2.8%) | 29 (8.7%) |
| $35,000 to $39,999 | 30 (10.4%) | 9 (2.7%) |
| $40,000 to $44,999 | 46 (16.0%) | 26 (7.8%) |
| $45,000 to $49,999 | 13 (4.5%) | 17 (5.1%) |
| $50,000 to $54,999 | 0 (0.0%) | 2 (0.6%) |
| $55,000 to $64,999 | 33 (11.5%) | 39 (11.6%) |
| $65,000 to $74,999 | 11 (3.8%) | 16 (4.8%) |
| $75,000 to $99,999 | 14 (4.9%) | 22 (6.6%) |
| $100,000+ | 10 (3.5%) | 0 (0.0%) |
| Total | 287 (100.0%) | 335 (100.0%) |
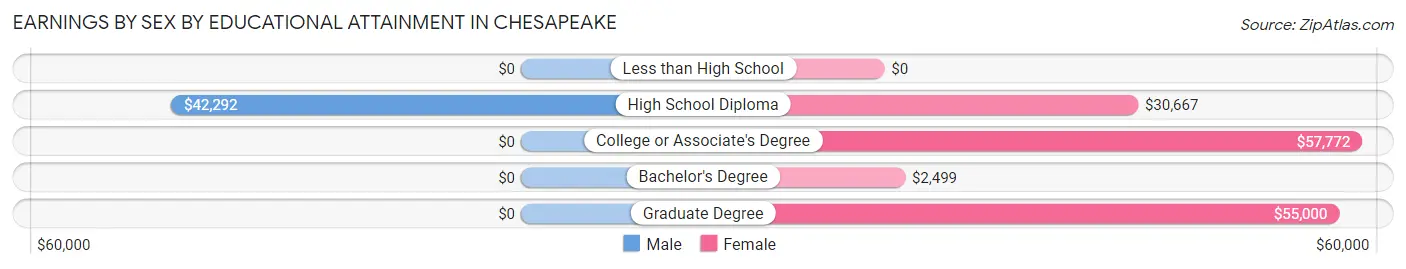
Earnings by Sex by Educational Attainment in Chesapeake
Average earnings in Chesapeake are $40,048 for men and $28,646 for women, a difference of 28.5%. Men with an educational attainment of high school diploma enjoy the highest average annual earnings of $42,292, while those with high school diploma education earn the least with $42,292. Women with an educational attainment of college or associate's degree earn the most with the average annual earnings of $57,772, while those with bachelor's degree education have the smallest earnings of $2,499.
| Educational Attainment | Male Income | Female Income |
| Less than High School | - | - |
| High School Diploma | $42,292 | $30,667 |
| College or Associate's Degree | - | - |
| Bachelor's Degree | - | - |
| Graduate Degree | - | - |
| Total | $40,048 | $28,646 |
Family Income in Chesapeake
Family Income Brackets in Chesapeake
According to the Chesapeake family income data, there are 150 families falling into the $50,000 to $74,999 income range, which is the most common income bracket and makes up 33.0% of all families. Conversely, the $200,000+ income bracket is the least frequent group with only 3 families (0.7%) belonging to this category.
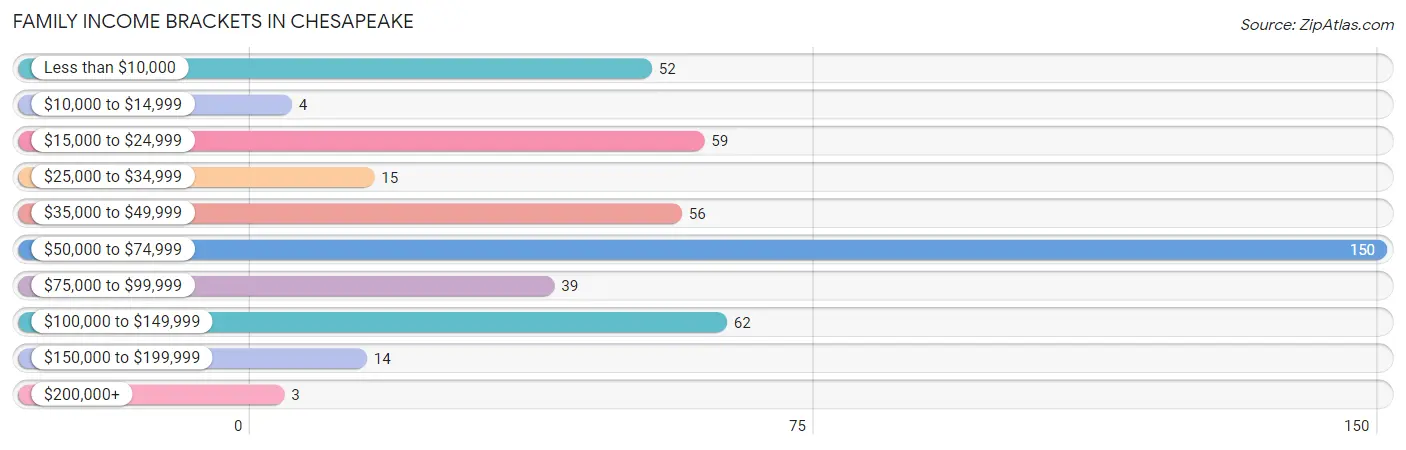
| Income Bracket | # Families | % Families |
| Less than $10,000 | 52 | 11.5% |
| $10,000 to $14,999 | 4 | 0.9% |
| $15,000 to $24,999 | 59 | 13.0% |
| $25,000 to $34,999 | 15 | 3.3% |
| $35,000 to $49,999 | 56 | 12.3% |
| $50,000 to $74,999 | 150 | 33.0% |
| $75,000 to $99,999 | 39 | 8.6% |
| $100,000 to $149,999 | 62 | 13.7% |
| $150,000 to $199,999 | 14 | 3.1% |
| $200,000+ | 3 | 0.7% |
Family Income by Famaliy Size in Chesapeake
4-person families (88 | 19.4%) account for the highest median family income in Chesapeake with $73,529 per family, while 2-person families (199 | 43.8%) have the highest median income of $30,062 per family member.
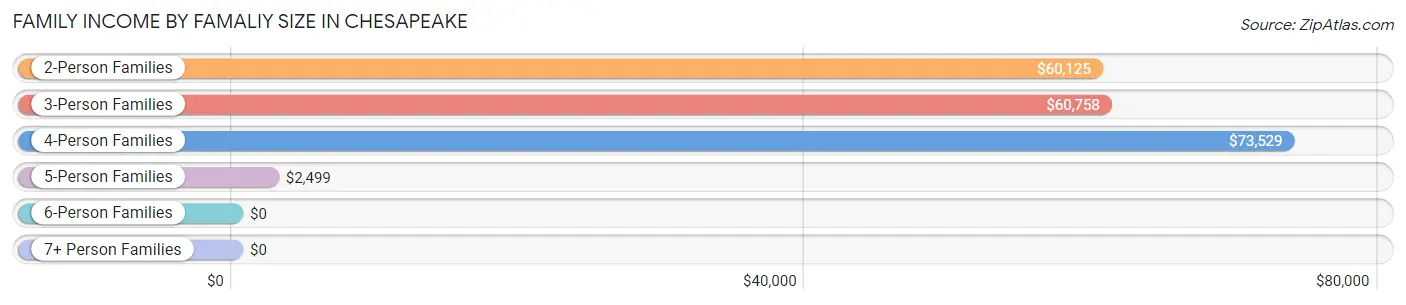
| Income Bracket | # Families | Median Income |
| 2-Person Families | 199 (43.8%) | $60,125 |
| 3-Person Families | 148 (32.6%) | $60,758 |
| 4-Person Families | 88 (19.4%) | $73,529 |
| 5-Person Families | 19 (4.2%) | $2,499 |
| 6-Person Families | 0 (0.0%) | $0 |
| 7+ Person Families | 0 (0.0%) | $0 |
| Total | 454 (100.0%) | $60,781 |
Family Income by Number of Earners in Chesapeake
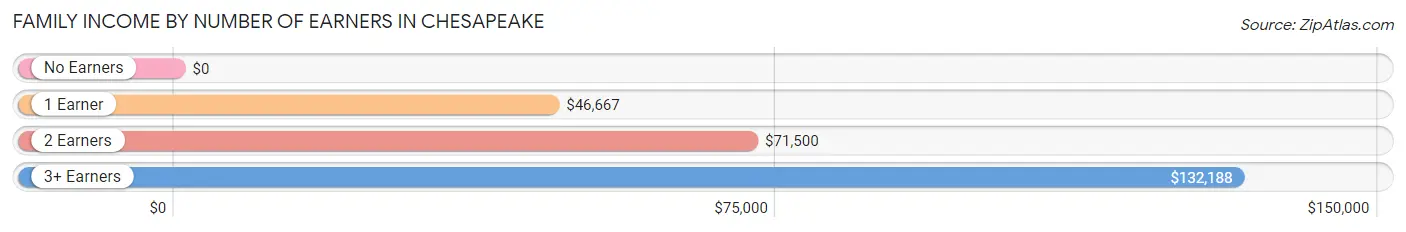
| Number of Earners | # Families | Median Income |
| No Earners | 115 (25.3%) | $0 |
| 1 Earner | 170 (37.4%) | $46,667 |
| 2 Earners | 156 (34.4%) | $71,500 |
| 3+ Earners | 13 (2.9%) | $132,188 |
| Total | 454 (100.0%) | $60,781 |
Household Income in Chesapeake
Household Income Brackets in Chesapeake
With 196 households falling in the category, the $50,000 to $74,999 income range is the most frequent in Chesapeake, accounting for 28.2% of all households. In contrast, only 3 households (0.4%) fall into the $200,000+ income bracket, making it the least populous group.
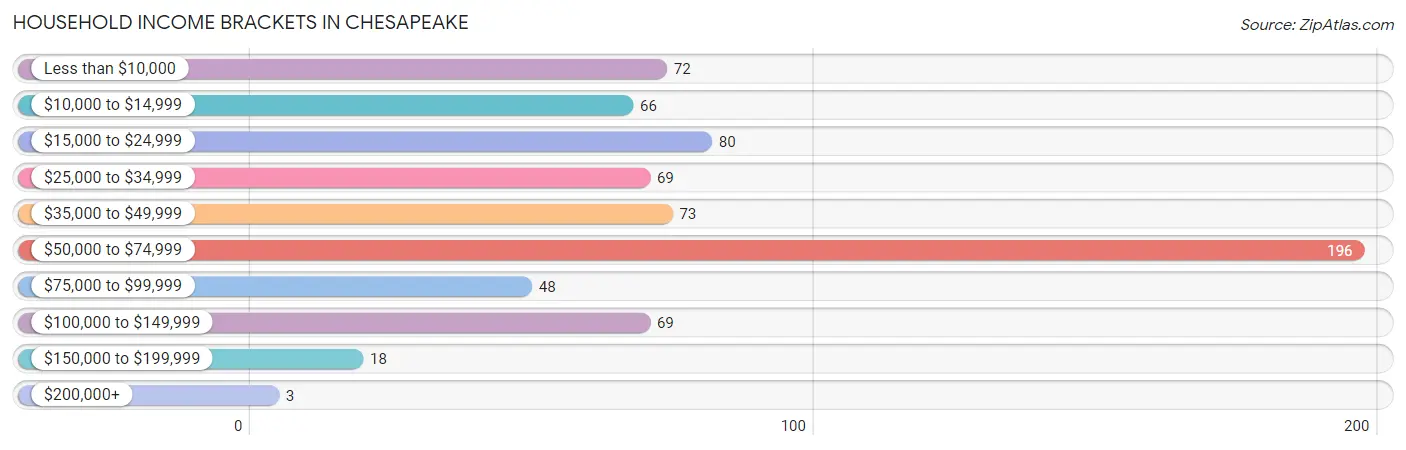
| Income Bracket | # Households | % Households |
| Less than $10,000 | 72 | 10.4% |
| $10,000 to $14,999 | 66 | 9.5% |
| $15,000 to $24,999 | 80 | 11.5% |
| $25,000 to $34,999 | 69 | 9.9% |
| $35,000 to $49,999 | 73 | 10.5% |
| $50,000 to $74,999 | 196 | 28.2% |
| $75,000 to $99,999 | 48 | 6.9% |
| $100,000 to $149,999 | 69 | 9.9% |
| $150,000 to $199,999 | 18 | 2.6% |
| $200,000+ | 3 | 0.4% |
Household Income by Householder Age in Chesapeake
The median household income in Chesapeake is $48,375, with the highest median household income of $60,587 found in the 25 to 44 years age bracket for the primary householder. A total of 203 households (29.2%) fall into this category. Meanwhile, the 15 to 24 years age bracket for the primary householder has the lowest median household income of $0, with 1 households (0.1%) in this group.
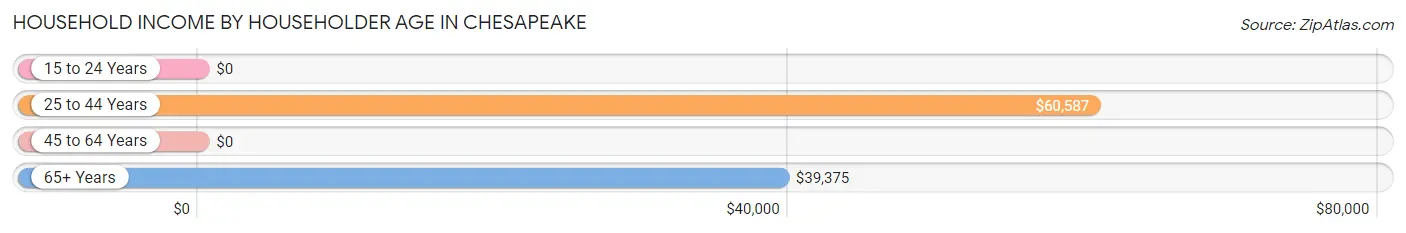
| Income Bracket | # Households | Median Income |
| 15 to 24 Years | 1 (0.1%) | $0 |
| 25 to 44 Years | 203 (29.2%) | $60,587 |
| 45 to 64 Years | 279 (40.2%) | $0 |
| 65+ Years | 211 (30.4%) | $39,375 |
| Total | 694 (100.0%) | $48,375 |
Poverty in Chesapeake
Income Below Poverty by Sex and Age in Chesapeake
With 30.0% poverty level for males and 27.1% for females among the residents of Chesapeake, 5 year old males and 15 year old females are the most vulnerable to poverty, with 18 males (100.0%) and 1 females (100.0%) in their respective age groups living below the poverty level.
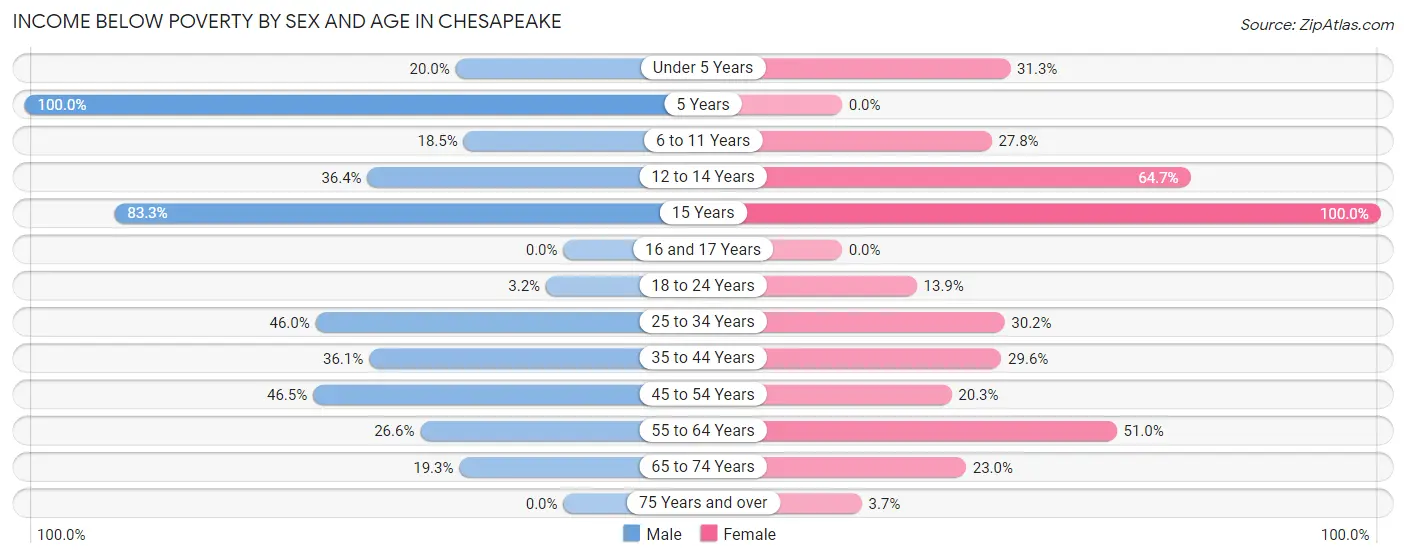
| Age Bracket | Male | Female |
| Under 5 Years | 16 (20.0%) | 10 (31.2%) |
| 5 Years | 18 (100.0%) | 0 (0.0%) |
| 6 to 11 Years | 15 (18.5%) | 15 (27.8%) |
| 12 to 14 Years | 4 (36.4%) | 11 (64.7%) |
| 15 Years | 15 (83.3%) | 1 (100.0%) |
| 16 and 17 Years | 0 (0.0%) | 0 (0.0%) |
| 18 to 24 Years | 2 (3.2%) | 5 (13.9%) |
| 25 to 34 Years | 46 (46.0%) | 54 (30.2%) |
| 35 to 44 Years | 22 (36.1%) | 21 (29.6%) |
| 45 to 54 Years | 59 (46.5%) | 24 (20.3%) |
| 55 to 64 Years | 17 (26.6%) | 51 (51.0%) |
| 65 to 74 Years | 17 (19.3%) | 26 (23.0%) |
| 75 Years and over | 0 (0.0%) | 3 (3.7%) |
| Total | 231 (30.0%) | 221 (27.1%) |
Income Above Poverty by Sex and Age in Chesapeake
According to the poverty statistics in Chesapeake, males aged 16 and 17 years and females aged 16 and 17 years are the age groups that are most secure financially, with 100.0% of males and 100.0% of females in these age groups living above the poverty line.
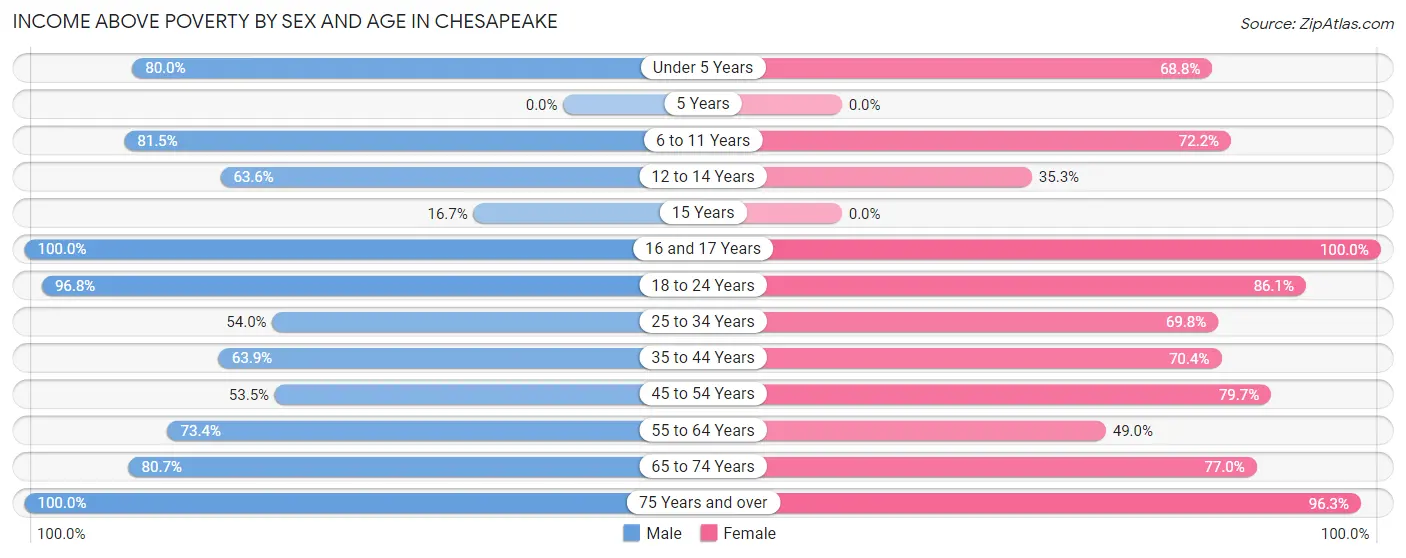
| Age Bracket | Male | Female |
| Under 5 Years | 64 (80.0%) | 22 (68.8%) |
| 5 Years | 0 (0.0%) | 0 (0.0%) |
| 6 to 11 Years | 66 (81.5%) | 39 (72.2%) |
| 12 to 14 Years | 7 (63.6%) | 6 (35.3%) |
| 15 Years | 3 (16.7%) | 0 (0.0%) |
| 16 and 17 Years | 18 (100.0%) | 12 (100.0%) |
| 18 to 24 Years | 60 (96.8%) | 31 (86.1%) |
| 25 to 34 Years | 54 (54.0%) | 125 (69.8%) |
| 35 to 44 Years | 39 (63.9%) | 50 (70.4%) |
| 45 to 54 Years | 68 (53.5%) | 94 (79.7%) |
| 55 to 64 Years | 47 (73.4%) | 49 (49.0%) |
| 65 to 74 Years | 71 (80.7%) | 87 (77.0%) |
| 75 Years and over | 42 (100.0%) | 79 (96.3%) |
| Total | 539 (70.0%) | 594 (72.9%) |
Income Below Poverty Among Married-Couple Families in Chesapeake
The poverty statistics for married-couple families in Chesapeake show that 11.4% or 35 of the total 306 families live below the poverty line. Families with 3 or 4 children have the highest poverty rate of 100.0%, comprising of 16 families. On the other hand, families with 1 or 2 children have the lowest poverty rate of 2.5%, which includes 4 families.
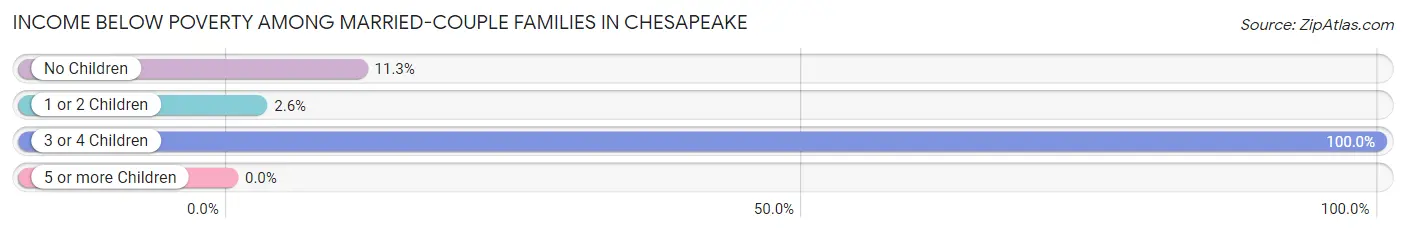
| Children | Above Poverty | Below Poverty |
| No Children | 118 (88.7%) | 15 (11.3%) |
| 1 or 2 Children | 153 (97.5%) | 4 (2.5%) |
| 3 or 4 Children | 0 (0.0%) | 16 (100.0%) |
| 5 or more Children | 0 (0.0%) | 0 (0.0%) |
| Total | 271 (88.6%) | 35 (11.4%) |
Income Below Poverty Among Single-Parent Households in Chesapeake
According to the poverty data in Chesapeake, 51.3% or 19 single-father households and 42.3% or 47 single-mother households are living below the poverty line. Among single-father households, those with no children have the highest poverty rate, with 19 households (63.3%) experiencing poverty. Likewise, among single-mother households, those with 1 or 2 children have the highest poverty rate, with 38 households (66.7%) falling below the poverty line.
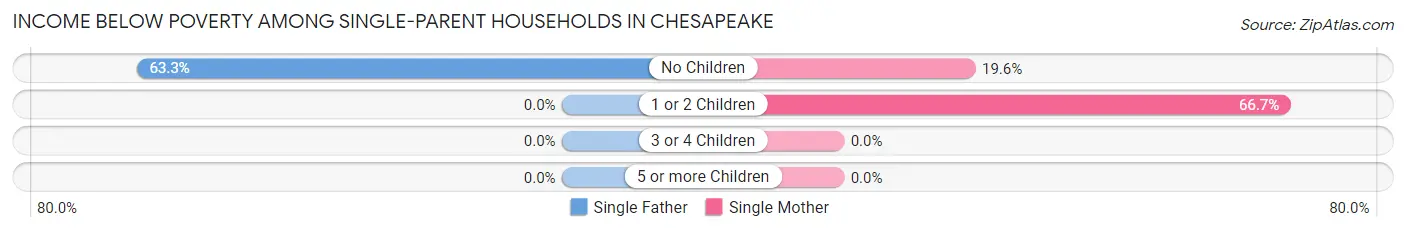
| Children | Single Father | Single Mother |
| No Children | 19 (63.3%) | 9 (19.6%) |
| 1 or 2 Children | 0 (0.0%) | 38 (66.7%) |
| 3 or 4 Children | 0 (0.0%) | 0 (0.0%) |
| 5 or more Children | 0 (0.0%) | 0 (0.0%) |
| Total | 19 (51.3%) | 47 (42.3%) |
Income Below Poverty Among Married-Couple vs Single-Parent Households in Chesapeake
The poverty data for Chesapeake shows that 35 of the married-couple family households (11.4%) and 66 of the single-parent households (44.6%) are living below the poverty level. Within the married-couple family households, those with 3 or 4 children have the highest poverty rate, with 16 households (100.0%) falling below the poverty line. Among the single-parent households, those with 1 or 2 children have the highest poverty rate, with 38 household (59.4%) living below poverty.
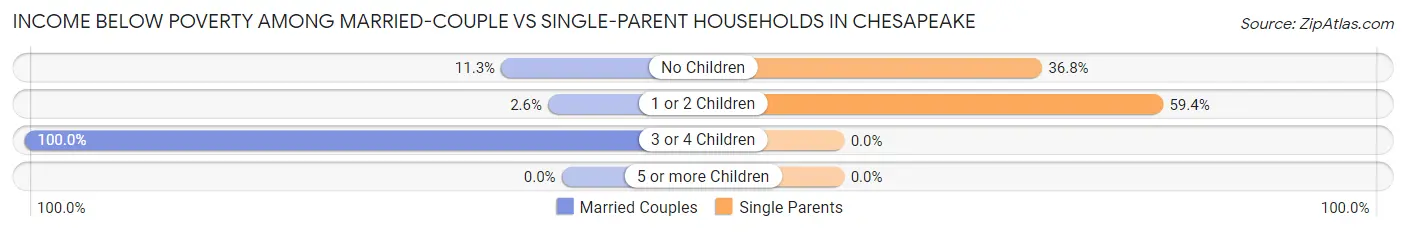
| Children | Married-Couple Families | Single-Parent Households |
| No Children | 15 (11.3%) | 28 (36.8%) |
| 1 or 2 Children | 4 (2.5%) | 38 (59.4%) |
| 3 or 4 Children | 16 (100.0%) | 0 (0.0%) |
| 5 or more Children | 0 (0.0%) | 0 (0.0%) |
| Total | 35 (11.4%) | 66 (44.6%) |
Race in Chesapeake
The most populous races in Chesapeake are White / Caucasian (1,421 | 89.6%), Black / African American (87 | 5.5%), and Two or more Races (70 | 4.4%).
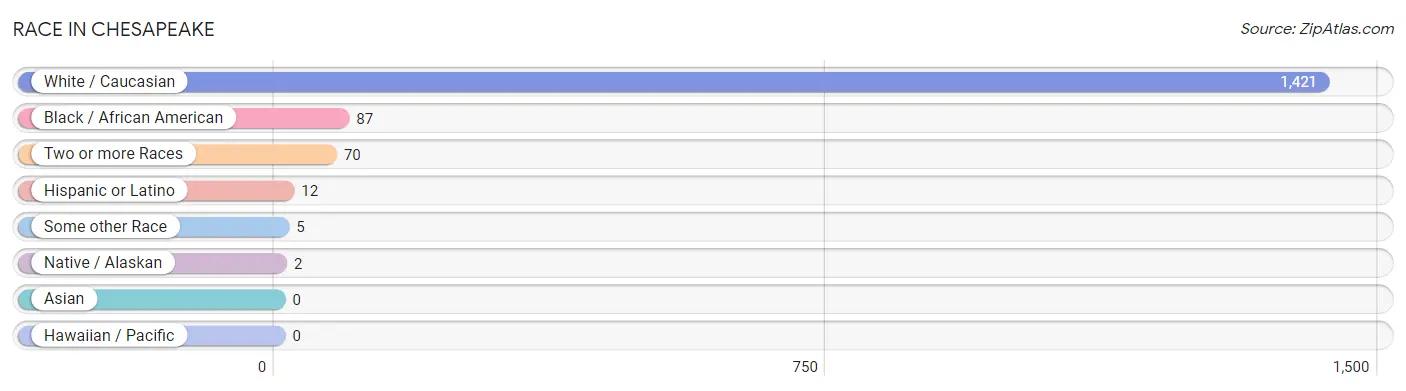
| Race | # Population | % Population |
| Asian | 0 | 0.0% |
| Black / African American | 87 | 5.5% |
| Hawaiian / Pacific | 0 | 0.0% |
| Hispanic or Latino | 12 | 0.8% |
| Native / Alaskan | 2 | 0.1% |
| White / Caucasian | 1,421 | 89.6% |
| Two or more Races | 70 | 4.4% |
| Some other Race | 5 | 0.3% |
| Total | 1,585 | 100.0% |
Ancestry in Chesapeake
The most populous ancestries reported in Chesapeake are English (210 | 13.3%), American (155 | 9.8%), German (97 | 6.1%), Irish (94 | 5.9%), and African (21 | 1.3%), together accounting for 36.4% of all Chesapeake residents.
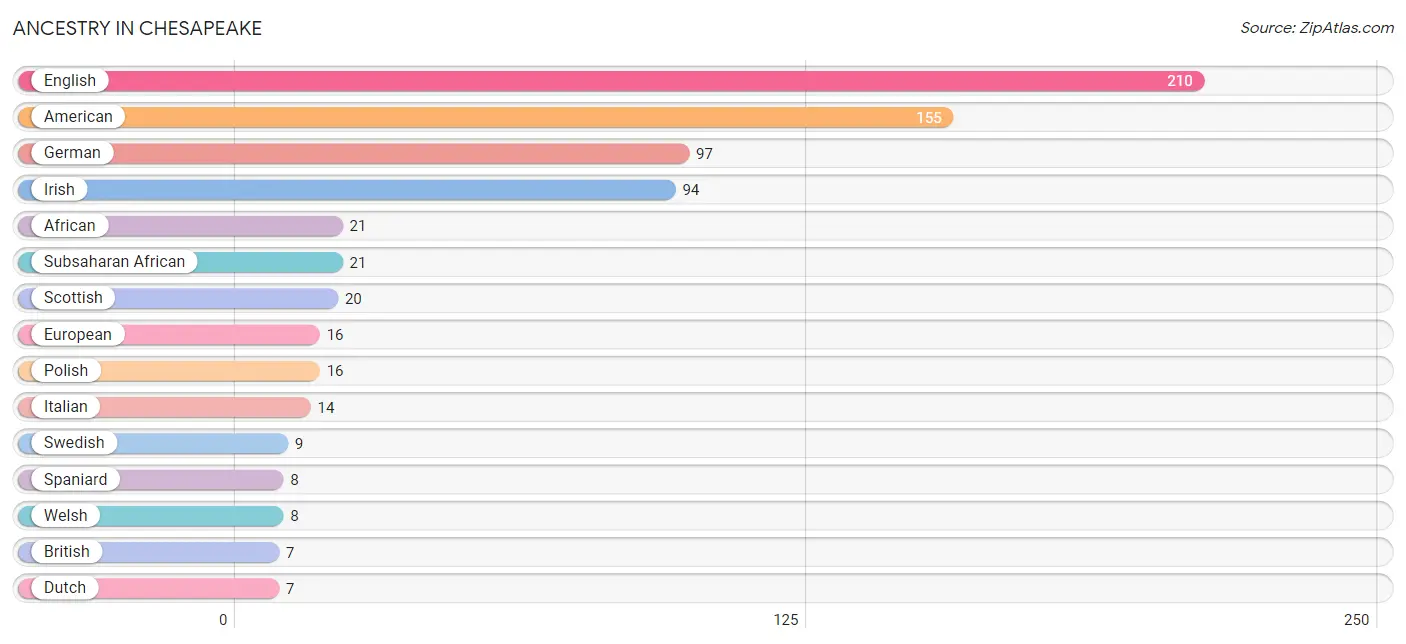
| Ancestry | # Population | % Population |
| African | 21 | 1.3% |
| American | 155 | 9.8% |
| Australian | 3 | 0.2% |
| British | 7 | 0.4% |
| Central American | 4 | 0.3% |
| Delaware | 2 | 0.1% |
| Dutch | 7 | 0.4% |
| English | 210 | 13.3% |
| European | 16 | 1.0% |
| French | 6 | 0.4% |
| German | 97 | 6.1% |
| Guatemalan | 4 | 0.3% |
| Hungarian | 7 | 0.4% |
| Irish | 94 | 5.9% |
| Italian | 14 | 0.9% |
| Polish | 16 | 1.0% |
| Scotch-Irish | 1 | 0.1% |
| Scottish | 20 | 1.3% |
| Spaniard | 8 | 0.5% |
| Subsaharan African | 21 | 1.3% |
| Swedish | 9 | 0.6% |
| Welsh | 8 | 0.5% |
| Yugoslavian | 2 | 0.1% | View All 23 Rows |
Immigrants in Chesapeake

| Immigration Origin | # Population | % Population | View All 0 Rows |
Sex and Age in Chesapeake
Sex and Age in Chesapeake
The most populous age groups in Chesapeake are 5 to 9 Years (87 | 11.3%) for men and 30 to 34 Years (109 | 13.4%) for women.
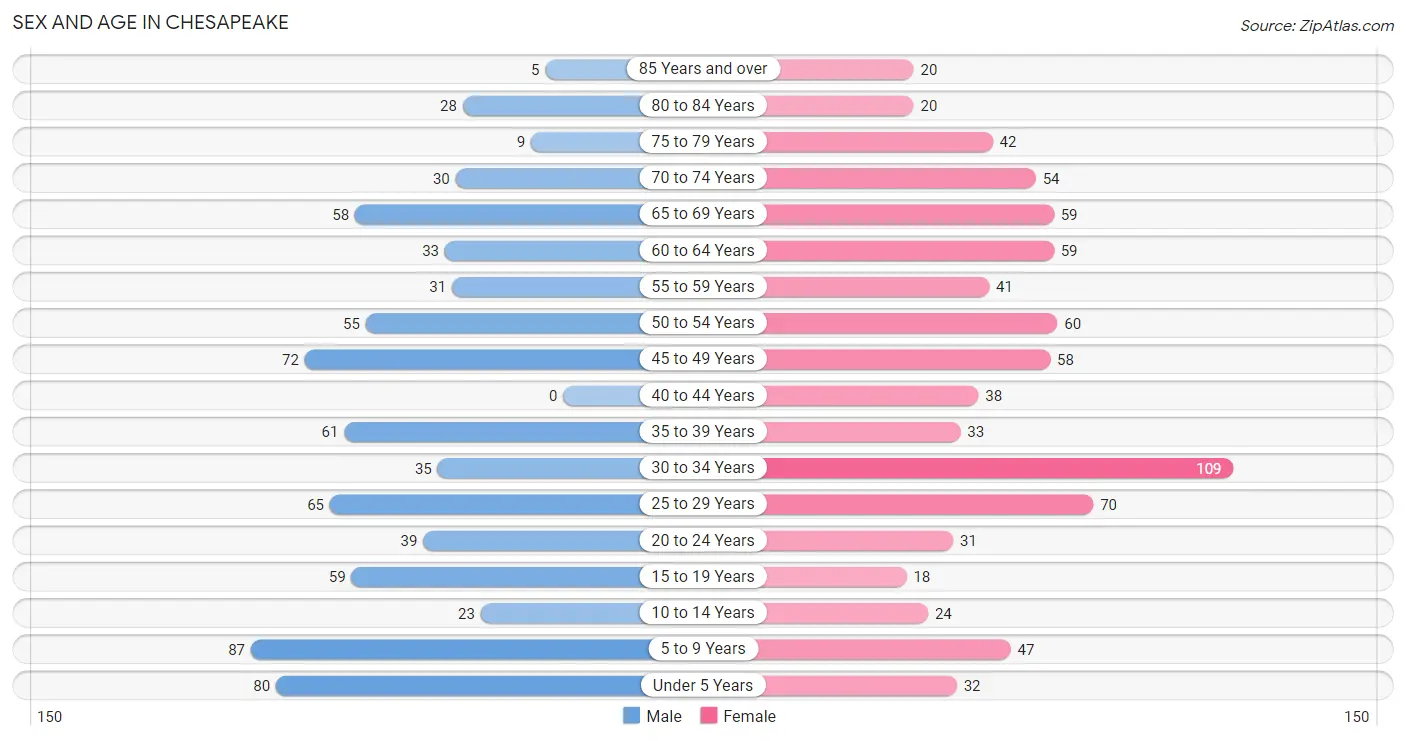
| Age Bracket | Male | Female |
| Under 5 Years | 80 (10.4%) | 32 (3.9%) |
| 5 to 9 Years | 87 (11.3%) | 47 (5.8%) |
| 10 to 14 Years | 23 (3.0%) | 24 (2.9%) |
| 15 to 19 Years | 59 (7.7%) | 18 (2.2%) |
| 20 to 24 Years | 39 (5.1%) | 31 (3.8%) |
| 25 to 29 Years | 65 (8.4%) | 70 (8.6%) |
| 30 to 34 Years | 35 (4.5%) | 109 (13.4%) |
| 35 to 39 Years | 61 (7.9%) | 33 (4.1%) |
| 40 to 44 Years | 0 (0.0%) | 38 (4.7%) |
| 45 to 49 Years | 72 (9.3%) | 58 (7.1%) |
| 50 to 54 Years | 55 (7.1%) | 60 (7.4%) |
| 55 to 59 Years | 31 (4.0%) | 41 (5.0%) |
| 60 to 64 Years | 33 (4.3%) | 59 (7.2%) |
| 65 to 69 Years | 58 (7.5%) | 59 (7.2%) |
| 70 to 74 Years | 30 (3.9%) | 54 (6.6%) |
| 75 to 79 Years | 9 (1.2%) | 42 (5.1%) |
| 80 to 84 Years | 28 (3.6%) | 20 (2.5%) |
| 85 Years and over | 5 (0.6%) | 20 (2.5%) |
| Total | 770 (100.0%) | 815 (100.0%) |
Families and Households in Chesapeake
Median Family Size in Chesapeake
The median family size in Chesapeake is 2.81 persons per family, with single male/father families (37 | 8.2%) accounting for the largest median family size of 3.05 persons per family. On the other hand, single female/mother families (111 | 24.4%) represent the smallest median family size with 2.68 persons per family.
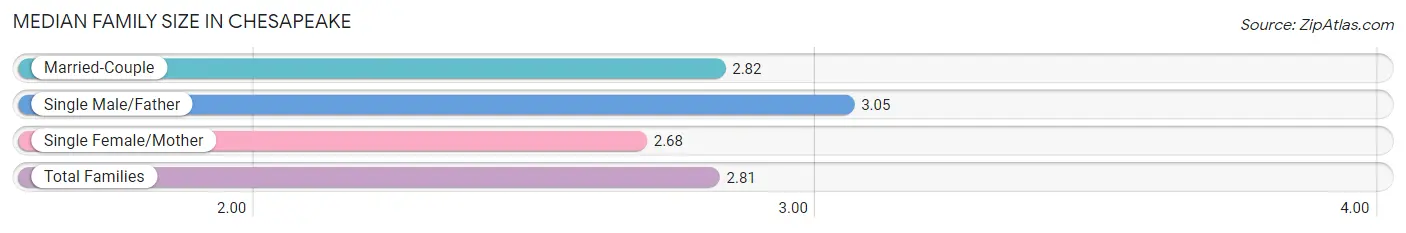
| Family Type | # Families | Family Size |
| Married-Couple | 306 (67.4%) | 2.82 |
| Single Male/Father | 37 (8.2%) | 3.05 |
| Single Female/Mother | 111 (24.4%) | 2.68 |
| Total Families | 454 (100.0%) | 2.81 |
Median Household Size in Chesapeake
The median household size in Chesapeake is 2.28 persons per household, with single male/father households (37 | 5.3%) accounting for the largest median household size of 3.16 persons per household. non-family households (240 | 34.6%) represent the smallest median household size with 1.07 persons per household.
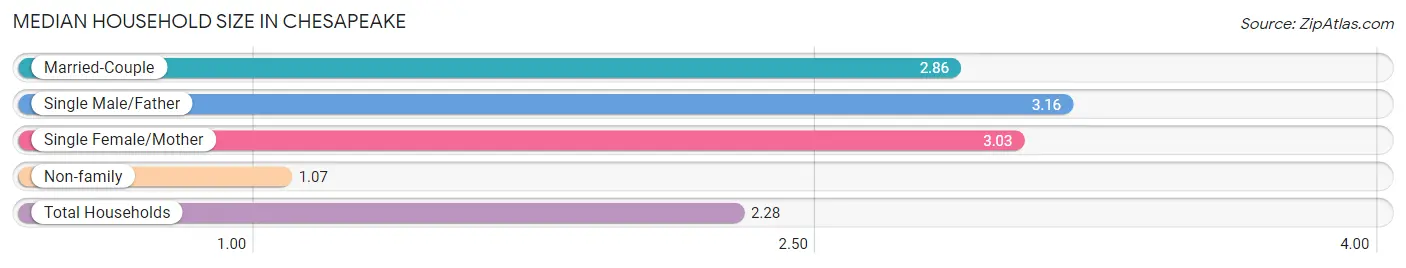
| Household Type | # Households | Household Size |
| Married-Couple | 306 (44.1%) | 2.86 |
| Single Male/Father | 37 (5.3%) | 3.16 |
| Single Female/Mother | 111 (16.0%) | 3.03 |
| Non-family | 240 (34.6%) | 1.07 |
| Total Households | 694 (100.0%) | 2.28 |
Household Size by Marriage Status in Chesapeake
Out of a total of 694 households in Chesapeake, 454 (65.4%) are family households, while 240 (34.6%) are nonfamily households. The most numerous type of family households are 2-person households, comprising 182, and the most common type of nonfamily households are 1-person households, comprising 227.
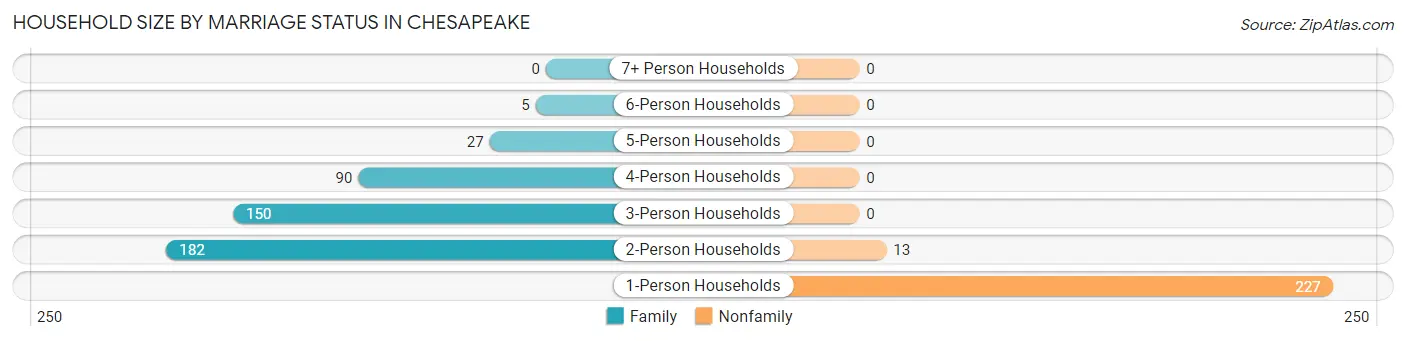
| Household Size | Family Households | Nonfamily Households |
| 1-Person Households | - | 227 (32.7%) |
| 2-Person Households | 182 (26.2%) | 13 (1.9%) |
| 3-Person Households | 150 (21.6%) | 0 (0.0%) |
| 4-Person Households | 90 (13.0%) | 0 (0.0%) |
| 5-Person Households | 27 (3.9%) | 0 (0.0%) |
| 6-Person Households | 5 (0.7%) | 0 (0.0%) |
| 7+ Person Households | 0 (0.0%) | 0 (0.0%) |
| Total | 454 (65.4%) | 240 (34.6%) |
Female Fertility in Chesapeake
Fertility by Age in Chesapeake
Average fertility rate in Chesapeake is 13.0 births per 1,000 women. Women in the age bracket of 20 to 34 years have the highest fertility rate with 24.0 births per 1,000 women. Women in the age bracket of 20 to 34 years acount for 100.0% of all women with births.
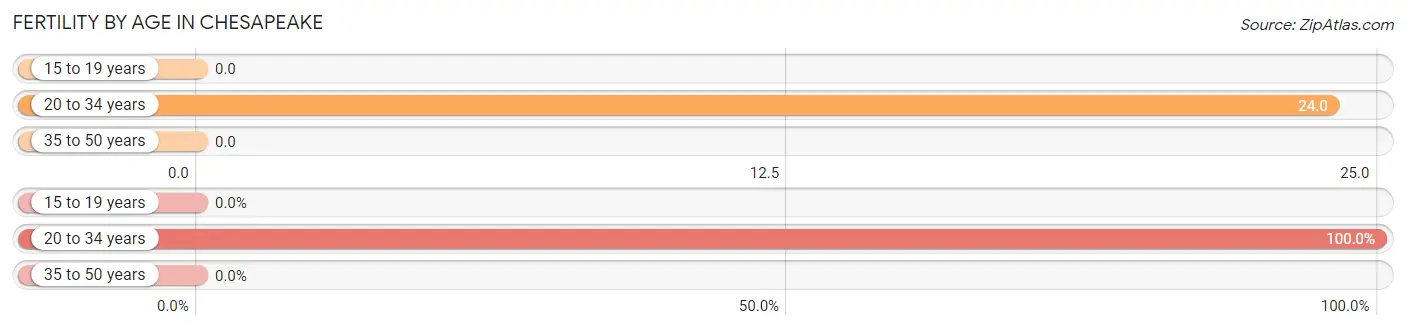
| Age Bracket | Women with Births | Births / 1,000 Women |
| 15 to 19 years | 0 (0.0%) | 0.0 |
| 20 to 34 years | 5 (100.0%) | 24.0 |
| 35 to 50 years | 0 (0.0%) | 0.0 |
| Total | 5 (100.0%) | 13.0 |
Fertility by Age by Marriage Status in Chesapeake
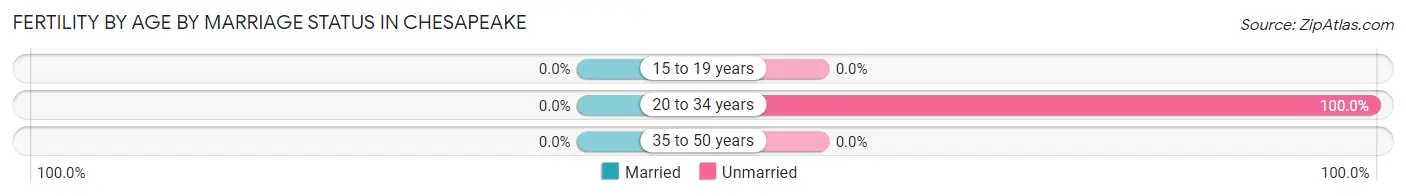
| Age Bracket | Married | Unmarried |
| 15 to 19 years | 0 (0.0%) | 0 (0.0%) |
| 20 to 34 years | 0 (0.0%) | 5 (100.0%) |
| 35 to 50 years | 0 (0.0%) | 0 (0.0%) |
| Total | 0 (0.0%) | 5 (100.0%) |
Fertility by Education in Chesapeake
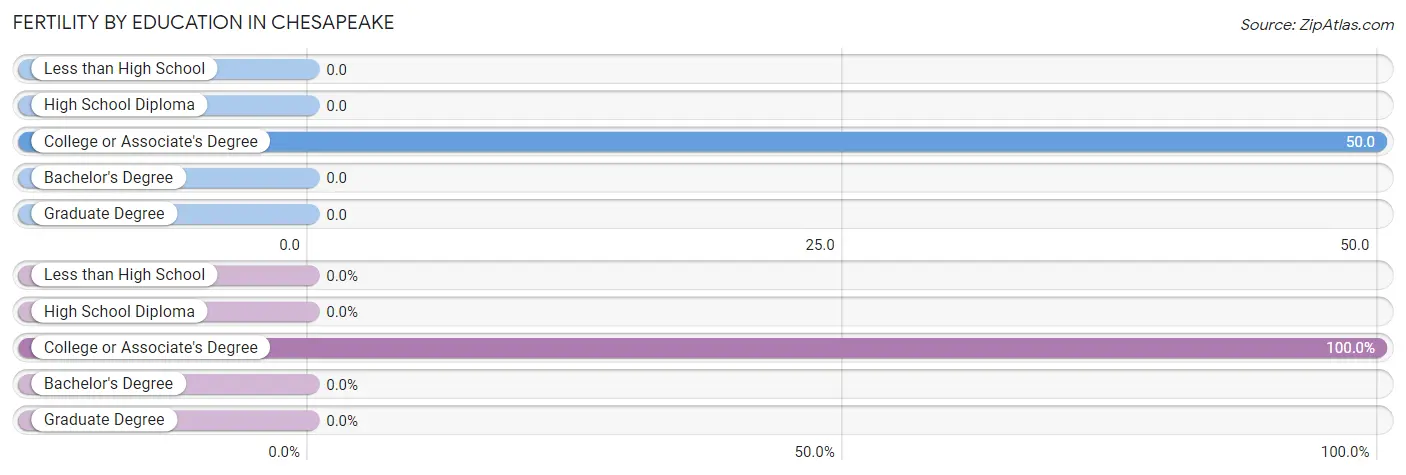
| Educational Attainment | Women with Births | Births / 1,000 Women |
| Less than High School | 0 (0.0%) | 0.0 |
| High School Diploma | 0 (0.0%) | 0.0 |
| College or Associate's Degree | 5 (100.0%) | 50.0 |
| Bachelor's Degree | 0 (0.0%) | 0.0 |
| Graduate Degree | 0 (0.0%) | 0.0 |
| Total | 5 (100.0%) | 13.0 |
Fertility by Education by Marriage Status in Chesapeake
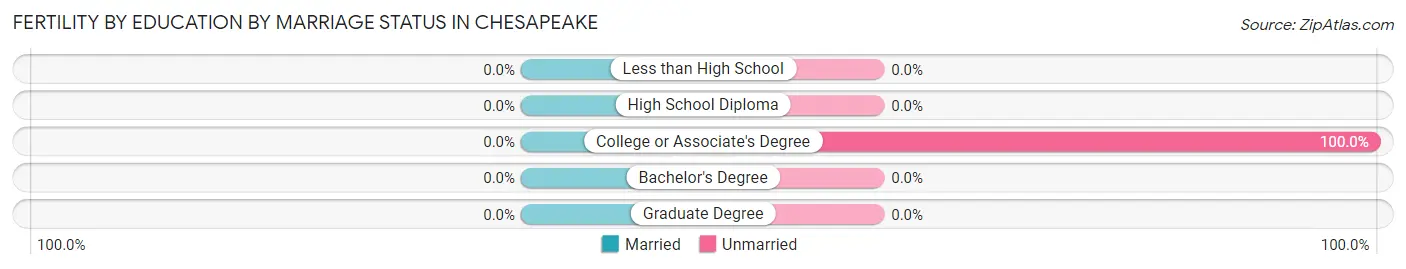
| Educational Attainment | Married | Unmarried |
| Less than High School | 0 (0.0%) | 0 (0.0%) |
| High School Diploma | 0 (0.0%) | 0 (0.0%) |
| College or Associate's Degree | 0 (0.0%) | 5 (100.0%) |
| Bachelor's Degree | 0 (0.0%) | 0 (0.0%) |
| Graduate Degree | 0 (0.0%) | 0 (0.0%) |
| Total | 0 (0.0%) | 5 (100.0%) |
Employment Characteristics in Chesapeake
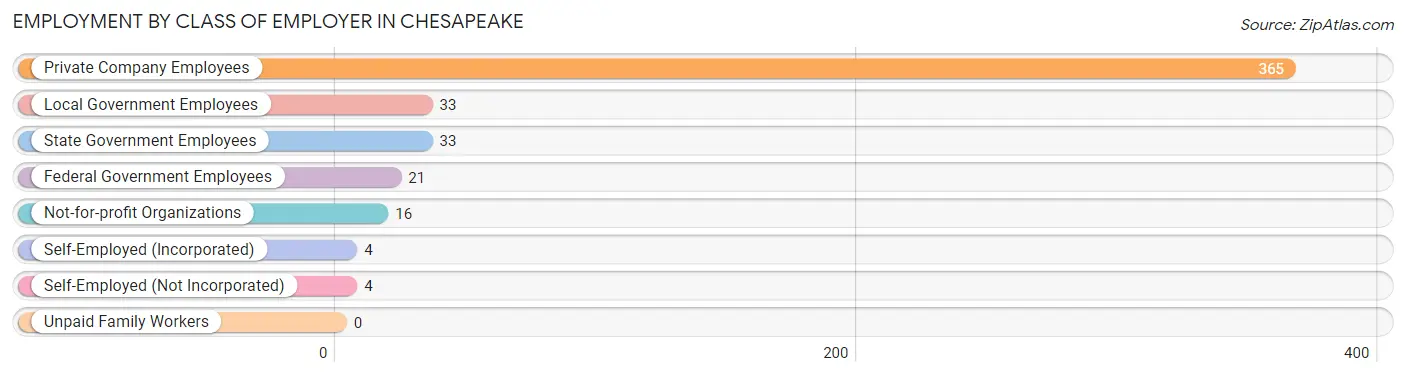
Employment by Class of Employer in Chesapeake
Among the 476 employed individuals in Chesapeake, private company employees (365 | 76.7%), local government employees (33 | 6.9%), and state government employees (33 | 6.9%) make up the most common classes of employment.
| Employer Class | # Employees | % Employees |
| Private Company Employees | 365 | 76.7% |
| Self-Employed (Incorporated) | 4 | 0.8% |
| Self-Employed (Not Incorporated) | 4 | 0.8% |
| Not-for-profit Organizations | 16 | 3.4% |
| Local Government Employees | 33 | 6.9% |
| State Government Employees | 33 | 6.9% |
| Federal Government Employees | 21 | 4.4% |
| Unpaid Family Workers | 0 | 0.0% |
| Total | 476 | 100.0% |
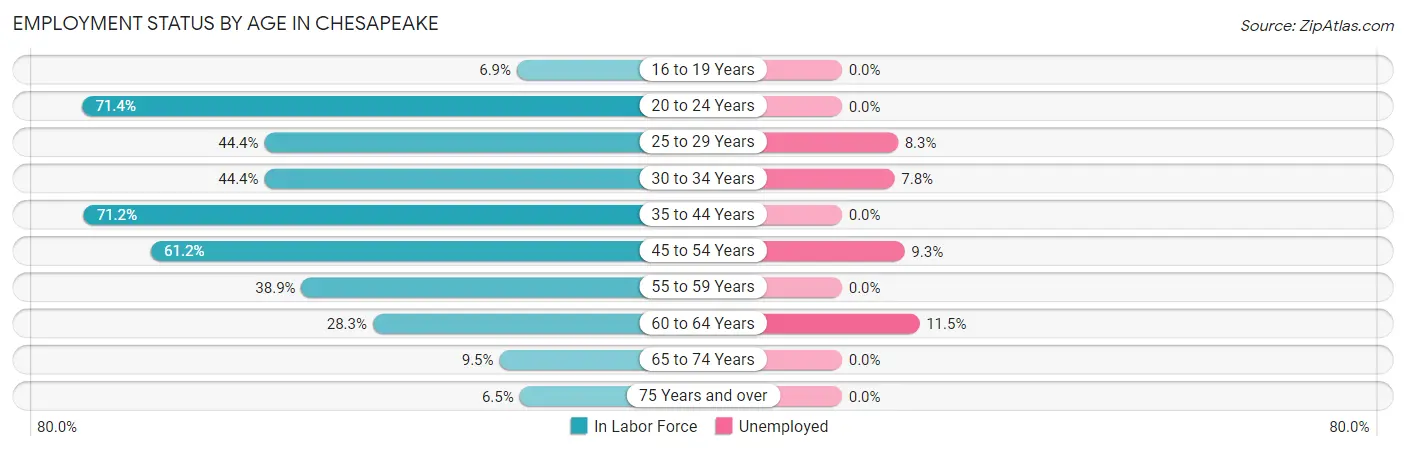
Employment Status by Age in Chesapeake
According to the labor force statistics for Chesapeake, out of the total population over 16 years of age (1,273), 39.5% or 503 individuals are in the labor force, with 5.4% or 27 of them unemployed. The age group with the highest labor force participation rate is 20 to 24 years, with 71.4% or 50 individuals in the labor force. Within the labor force, the 60 to 64 years age range has the highest percentage of unemployed individuals, with 11.5% or 3 of them being unemployed.
| Age Bracket | In Labor Force | Unemployed |
| 16 to 19 Years | 4 (6.9%) | 0 (0.0%) |
| 20 to 24 Years | 50 (71.4%) | 0 (0.0%) |
| 25 to 29 Years | 60 (44.4%) | 5 (8.3%) |
| 30 to 34 Years | 64 (44.4%) | 5 (7.8%) |
| 35 to 44 Years | 94 (71.2%) | 0 (0.0%) |
| 45 to 54 Years | 150 (61.2%) | 14 (9.3%) |
| 55 to 59 Years | 28 (38.9%) | 0 (0.0%) |
| 60 to 64 Years | 26 (28.3%) | 3 (11.5%) |
| 65 to 74 Years | 19 (9.5%) | 0 (0.0%) |
| 75 Years and over | 8 (6.5%) | 0 (0.0%) |
| Total | 503 (39.5%) | 27 (5.4%) |
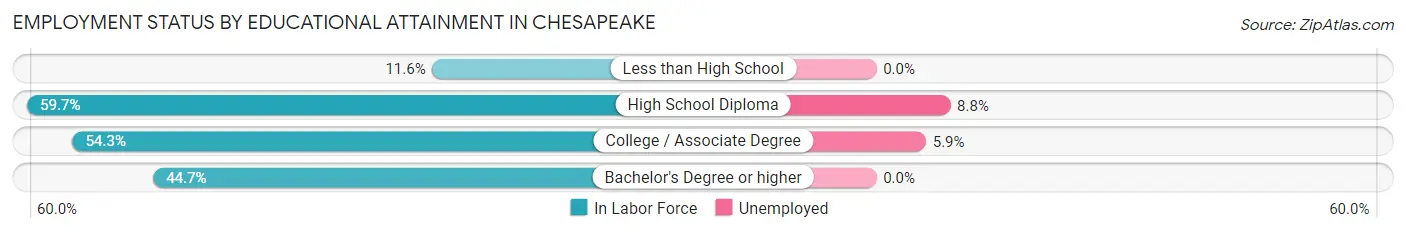
Employment Status by Educational Attainment in Chesapeake
According to labor force statistics for Chesapeake, 51.5% of individuals (422) out of the total population between 25 and 64 years of age (820) are in the labor force, with 6.4% or 27 of them being unemployed. The group with the highest labor force participation rate are those with the educational attainment of high school diploma, with 59.7% or 240 individuals in the labor force. Within the labor force, individuals with high school diploma education have the highest percentage of unemployment, with 8.8% or 21 of them being unemployed.
| Educational Attainment | In Labor Force | Unemployed |
| Less than High School | 8 (11.6%) | 0 (0.0%) |
| High School Diploma | 240 (59.7%) | 35 (8.8%) |
| College / Associate Degree | 102 (54.3%) | 11 (5.9%) |
| Bachelor's Degree or higher | 72 (44.7%) | 0 (0.0%) |
| Total | 422 (51.5%) | 52 (6.4%) |
Employment Occupations by Sex in Chesapeake
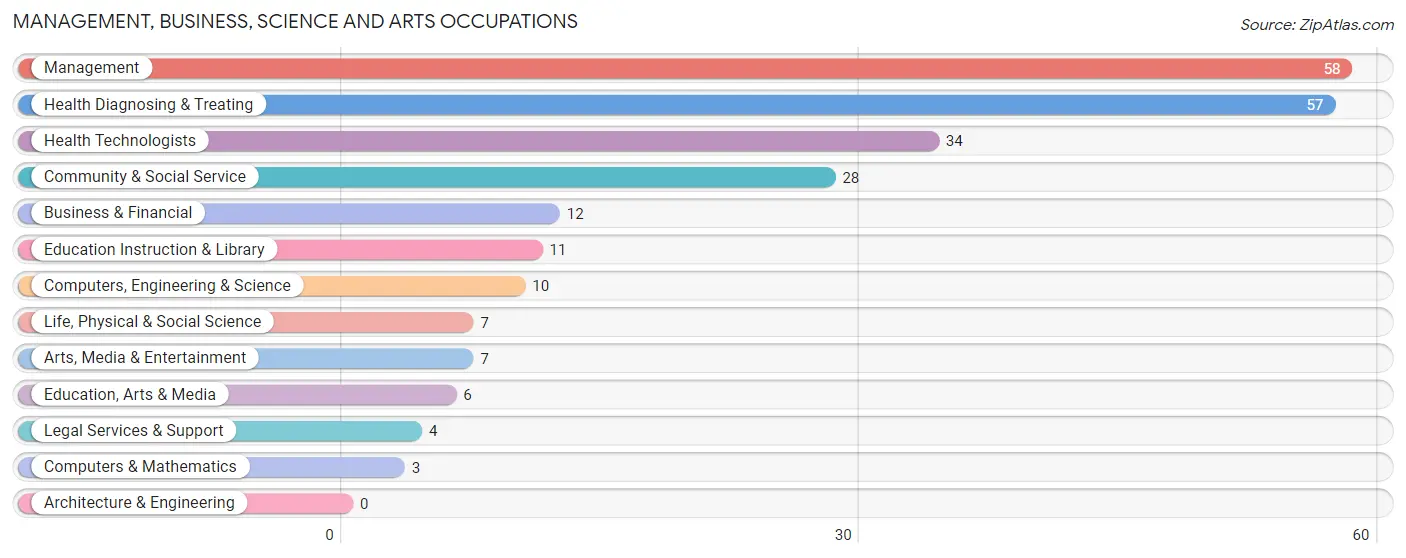
Management, Business, Science and Arts Occupations
The most common Management, Business, Science and Arts occupations in Chesapeake are Management (58 | 12.2%), Health Diagnosing & Treating (57 | 12.0%), Health Technologists (34 | 7.1%), Community & Social Service (28 | 5.9%), and Business & Financial (12 | 2.5%).
Management, Business, Science and Arts Occupations by Sex
Within the Management, Business, Science and Arts occupations in Chesapeake, the most male-oriented occupations are Computers & Mathematics (100.0%), Legal Services & Support (100.0%), and Arts, Media & Entertainment (100.0%), while the most female-oriented occupations are Business & Financial (100.0%), Life, Physical & Social Science (100.0%), and Health Technologists (88.2%).
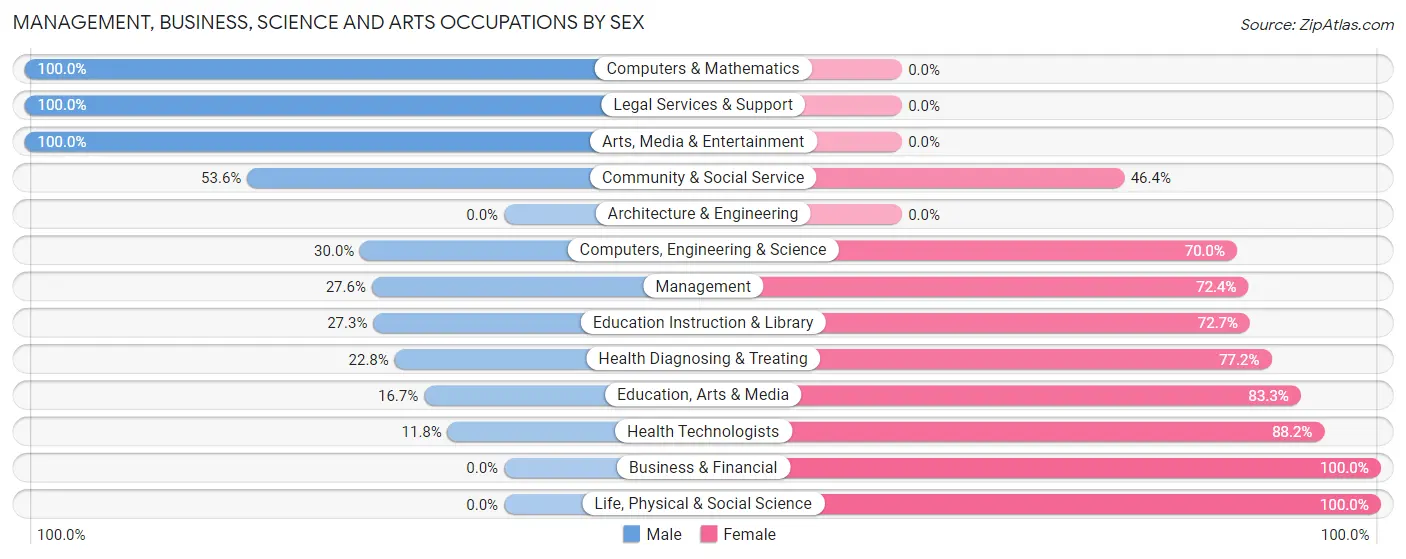
| Occupation | Male | Female |
| Management | 16 (27.6%) | 42 (72.4%) |
| Business & Financial | 0 (0.0%) | 12 (100.0%) |
| Computers, Engineering & Science | 3 (30.0%) | 7 (70.0%) |
| Computers & Mathematics | 3 (100.0%) | 0 (0.0%) |
| Architecture & Engineering | 0 (0.0%) | 0 (0.0%) |
| Life, Physical & Social Science | 0 (0.0%) | 7 (100.0%) |
| Community & Social Service | 15 (53.6%) | 13 (46.4%) |
| Education, Arts & Media | 1 (16.7%) | 5 (83.3%) |
| Legal Services & Support | 4 (100.0%) | 0 (0.0%) |
| Education Instruction & Library | 3 (27.3%) | 8 (72.7%) |
| Arts, Media & Entertainment | 7 (100.0%) | 0 (0.0%) |
| Health Diagnosing & Treating | 13 (22.8%) | 44 (77.2%) |
| Health Technologists | 4 (11.8%) | 30 (88.2%) |
| Total (Category) | 47 (28.5%) | 118 (71.5%) |
| Total (Overall) | 243 (51.0%) | 233 (48.9%) |
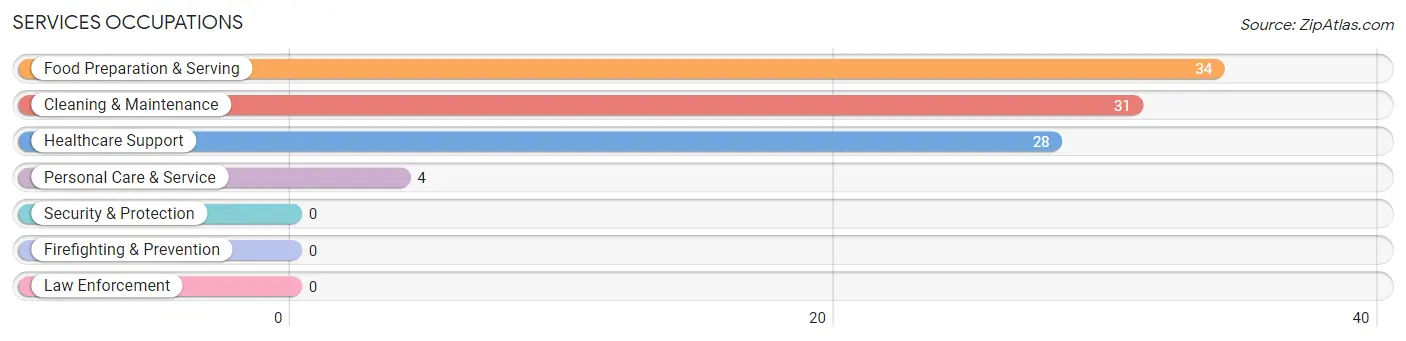
Services Occupations
The most common Services occupations in Chesapeake are Food Preparation & Serving (34 | 7.1%), Cleaning & Maintenance (31 | 6.5%), Healthcare Support (28 | 5.9%), and Personal Care & Service (4 | 0.8%).
Services Occupations by Sex
Within the Services occupations in Chesapeake, the most male-oriented occupations are Food Preparation & Serving (76.5%), Cleaning & Maintenance (71.0%), and Healthcare Support (10.7%), while the most female-oriented occupations are Personal Care & Service (100.0%), Healthcare Support (89.3%), and Cleaning & Maintenance (29.0%).
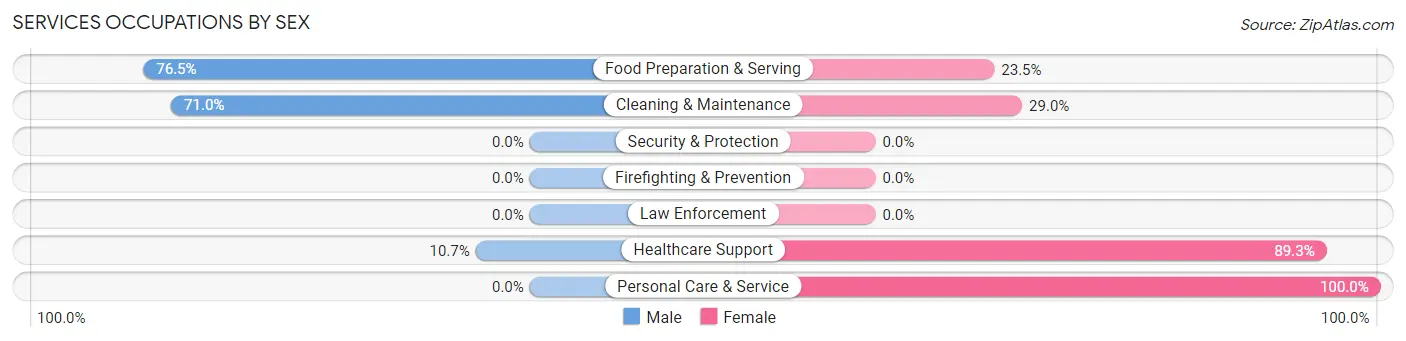
| Occupation | Male | Female |
| Healthcare Support | 3 (10.7%) | 25 (89.3%) |
| Security & Protection | 0 (0.0%) | 0 (0.0%) |
| Firefighting & Prevention | 0 (0.0%) | 0 (0.0%) |
| Law Enforcement | 0 (0.0%) | 0 (0.0%) |
| Food Preparation & Serving | 26 (76.5%) | 8 (23.5%) |
| Cleaning & Maintenance | 22 (71.0%) | 9 (29.0%) |
| Personal Care & Service | 0 (0.0%) | 4 (100.0%) |
| Total (Category) | 51 (52.6%) | 46 (47.4%) |
| Total (Overall) | 243 (51.0%) | 233 (48.9%) |
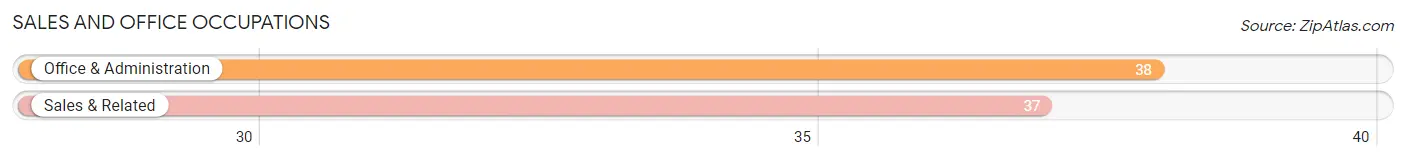
Sales and Office Occupations
The most common Sales and Office occupations in Chesapeake are Office & Administration (38 | 8.0%), and Sales & Related (37 | 7.8%).
Sales and Office Occupations by Sex
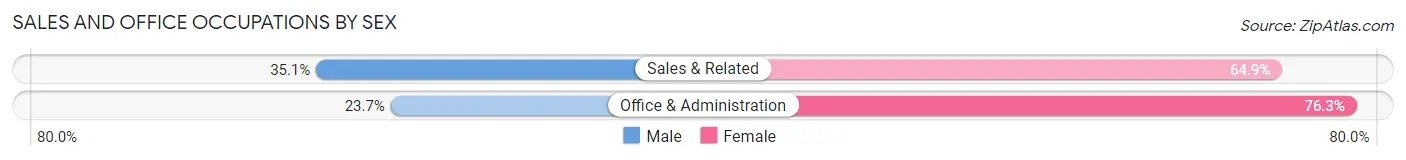
| Occupation | Male | Female |
| Sales & Related | 13 (35.1%) | 24 (64.9%) |
| Office & Administration | 9 (23.7%) | 29 (76.3%) |
| Total (Category) | 22 (29.3%) | 53 (70.7%) |
| Total (Overall) | 243 (51.0%) | 233 (48.9%) |
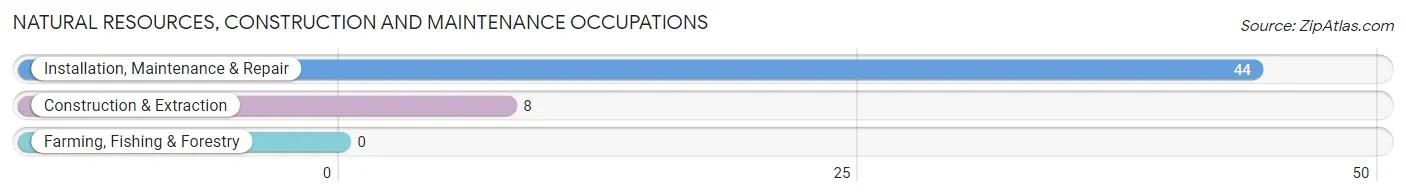
Natural Resources, Construction and Maintenance Occupations
The most common Natural Resources, Construction and Maintenance occupations in Chesapeake are Installation, Maintenance & Repair (44 | 9.2%), and Construction & Extraction (8 | 1.7%).
Natural Resources, Construction and Maintenance Occupations by Sex
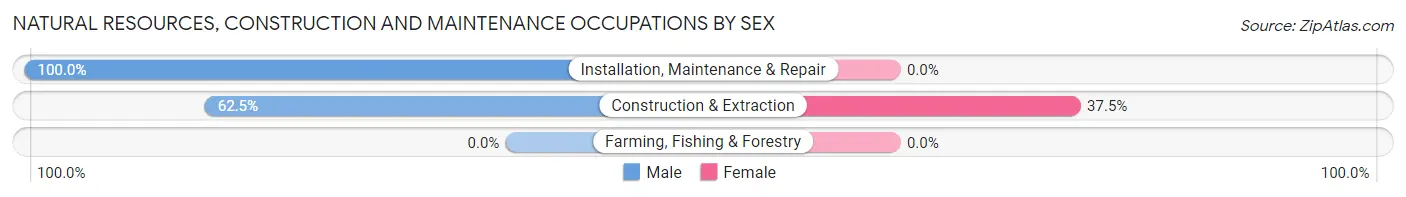
| Occupation | Male | Female |
| Farming, Fishing & Forestry | 0 (0.0%) | 0 (0.0%) |
| Construction & Extraction | 5 (62.5%) | 3 (37.5%) |
| Installation, Maintenance & Repair | 44 (100.0%) | 0 (0.0%) |
| Total (Category) | 49 (94.2%) | 3 (5.8%) |
| Total (Overall) | 243 (51.0%) | 233 (48.9%) |
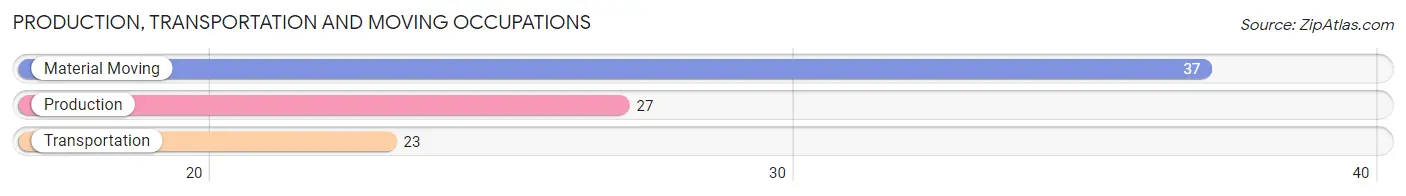
Production, Transportation and Moving Occupations
The most common Production, Transportation and Moving occupations in Chesapeake are Material Moving (37 | 7.8%), Production (27 | 5.7%), and Transportation (23 | 4.8%).
Production, Transportation and Moving Occupations by Sex
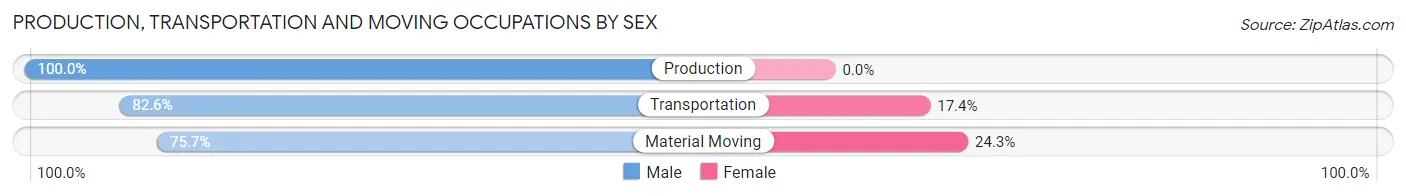
| Occupation | Male | Female |
| Production | 27 (100.0%) | 0 (0.0%) |
| Transportation | 19 (82.6%) | 4 (17.4%) |
| Material Moving | 28 (75.7%) | 9 (24.3%) |
| Total (Category) | 74 (85.1%) | 13 (14.9%) |
| Total (Overall) | 243 (51.0%) | 233 (48.9%) |
Employment Industries by Sex in Chesapeake
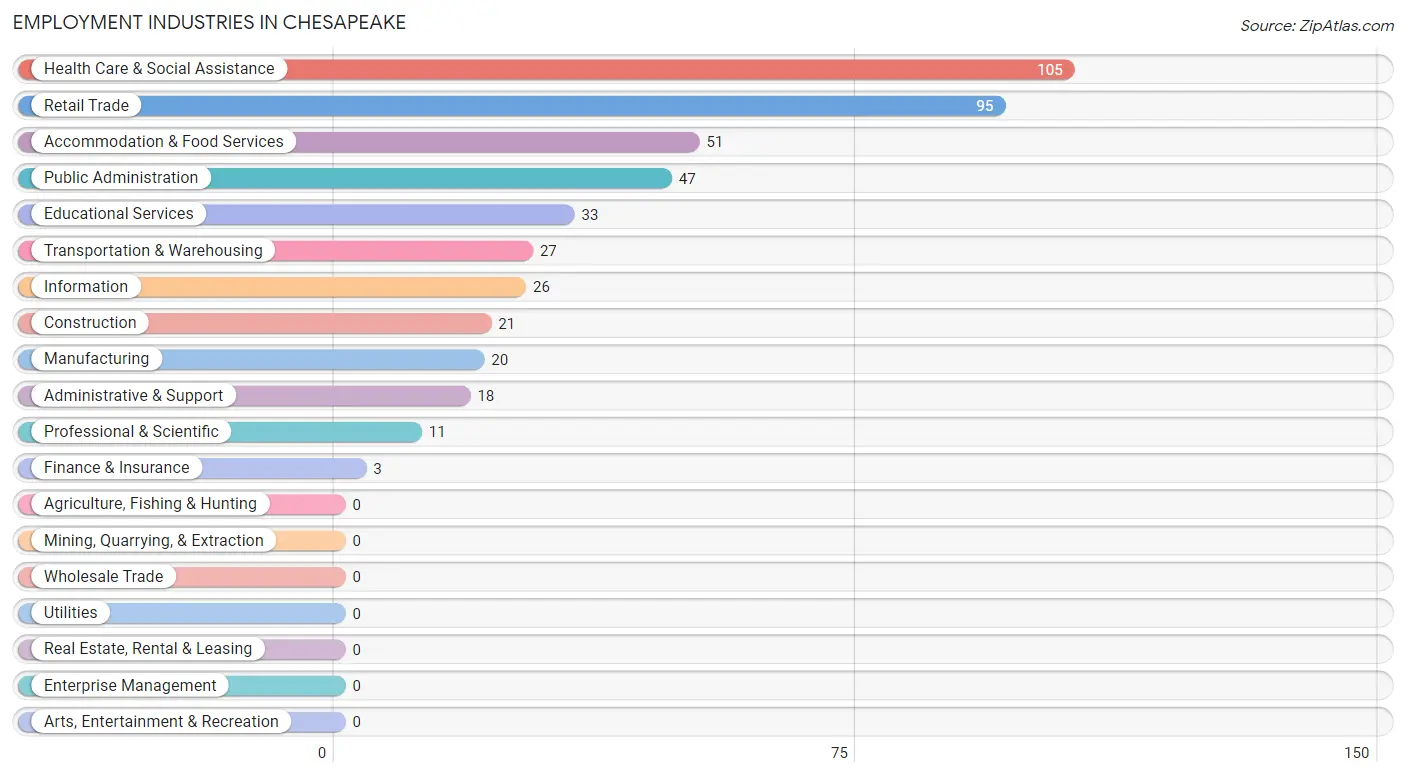
Employment Industries in Chesapeake
The major employment industries in Chesapeake include Health Care & Social Assistance (105 | 22.1%), Retail Trade (95 | 20.0%), Accommodation & Food Services (51 | 10.7%), Public Administration (47 | 9.9%), and Educational Services (33 | 6.9%).
Employment Industries by Sex in Chesapeake
The Chesapeake industries that see more men than women are Information (100.0%), Finance & Insurance (100.0%), and Transportation & Warehousing (81.5%), whereas the industries that tend to have a higher number of women are Health Care & Social Assistance (80.9%), Professional & Scientific (63.6%), and Public Administration (61.7%).
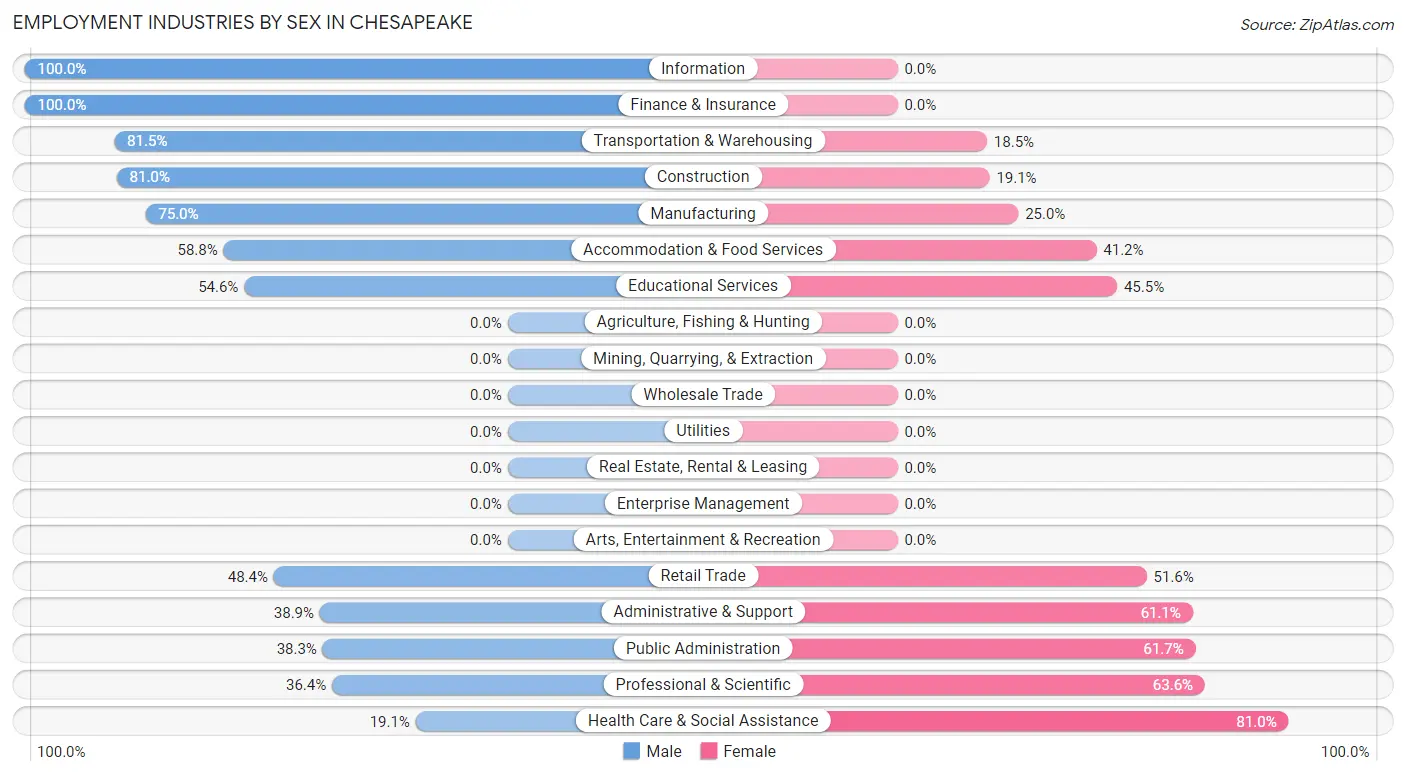
| Industry | Male | Female |
| Agriculture, Fishing & Hunting | 0 (0.0%) | 0 (0.0%) |
| Mining, Quarrying, & Extraction | 0 (0.0%) | 0 (0.0%) |
| Construction | 17 (80.9%) | 4 (19.1%) |
| Manufacturing | 15 (75.0%) | 5 (25.0%) |
| Wholesale Trade | 0 (0.0%) | 0 (0.0%) |
| Retail Trade | 46 (48.4%) | 49 (51.6%) |
| Transportation & Warehousing | 22 (81.5%) | 5 (18.5%) |
| Utilities | 0 (0.0%) | 0 (0.0%) |
| Information | 26 (100.0%) | 0 (0.0%) |
| Finance & Insurance | 3 (100.0%) | 0 (0.0%) |
| Real Estate, Rental & Leasing | 0 (0.0%) | 0 (0.0%) |
| Professional & Scientific | 4 (36.4%) | 7 (63.6%) |
| Enterprise Management | 0 (0.0%) | 0 (0.0%) |
| Administrative & Support | 7 (38.9%) | 11 (61.1%) |
| Educational Services | 18 (54.5%) | 15 (45.5%) |
| Health Care & Social Assistance | 20 (19.1%) | 85 (80.9%) |
| Arts, Entertainment & Recreation | 0 (0.0%) | 0 (0.0%) |
| Accommodation & Food Services | 30 (58.8%) | 21 (41.2%) |
| Public Administration | 18 (38.3%) | 29 (61.7%) |
| Total | 243 (51.0%) | 233 (48.9%) |
Education in Chesapeake
School Enrollment in Chesapeake
The most common levels of schooling among the 337 students in Chesapeake are elementary school (106 | 31.5%), high school (78 | 23.2%), and college / undergraduate (72 | 21.4%).
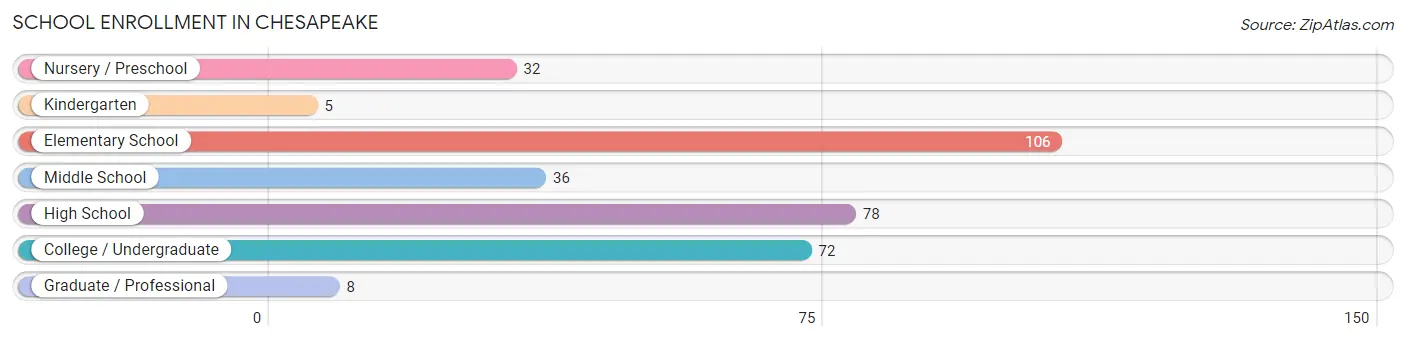
| School Level | # Students | % Students |
| Nursery / Preschool | 32 | 9.5% |
| Kindergarten | 5 | 1.5% |
| Elementary School | 106 | 31.5% |
| Middle School | 36 | 10.7% |
| High School | 78 | 23.2% |
| College / Undergraduate | 72 | 21.4% |
| Graduate / Professional | 8 | 2.4% |
| Total | 337 | 100.0% |
School Enrollment by Age by Funding Source in Chesapeake
Out of a total of 337 students who are enrolled in schools in Chesapeake, 4 (1.2%) attend a private institution, while the remaining 333 (98.8%) are enrolled in public schools. The age group of 35 years and over has the highest likelihood of being enrolled in private schools, with 4 (100.0% in the age bracket) enrolled. Conversely, the age group of 3 to 4 year olds has the lowest likelihood of being enrolled in a private school, with 14 (100.0% in the age bracket) attending a public institution.
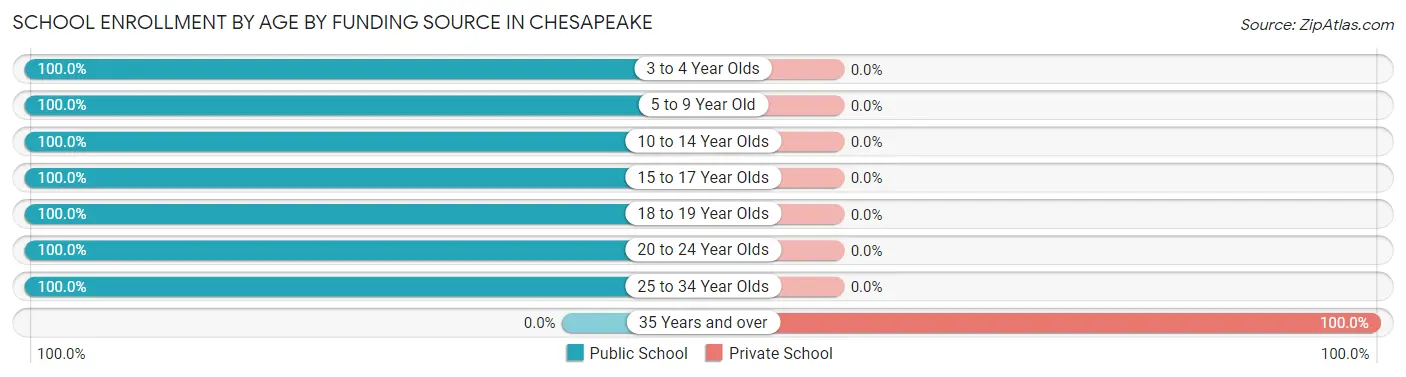
| Age Bracket | Public School | Private School |
| 3 to 4 Year Olds | 14 (100.0%) | 0 (0.0%) |
| 5 to 9 Year Old | 129 (100.0%) | 0 (0.0%) |
| 10 to 14 Year Olds | 40 (100.0%) | 0 (0.0%) |
| 15 to 17 Year Olds | 49 (100.0%) | 0 (0.0%) |
| 18 to 19 Year Olds | 28 (100.0%) | 0 (0.0%) |
| 20 to 24 Year Olds | 13 (100.0%) | 0 (0.0%) |
| 25 to 34 Year Olds | 60 (100.0%) | 0 (0.0%) |
| 35 Years and over | 0 (0.0%) | 4 (100.0%) |
| Total | 333 (98.8%) | 4 (1.2%) |
Educational Attainment by Field of Study in Chesapeake
Arts & humanities (70 | 37.4%), education (20 | 10.7%), business (19 | 10.2%), psychology (17 | 9.1%), and multidisciplinary studies (12 | 6.4%) are the most common fields of study among 187 individuals in Chesapeake who have obtained a bachelor's degree or higher.
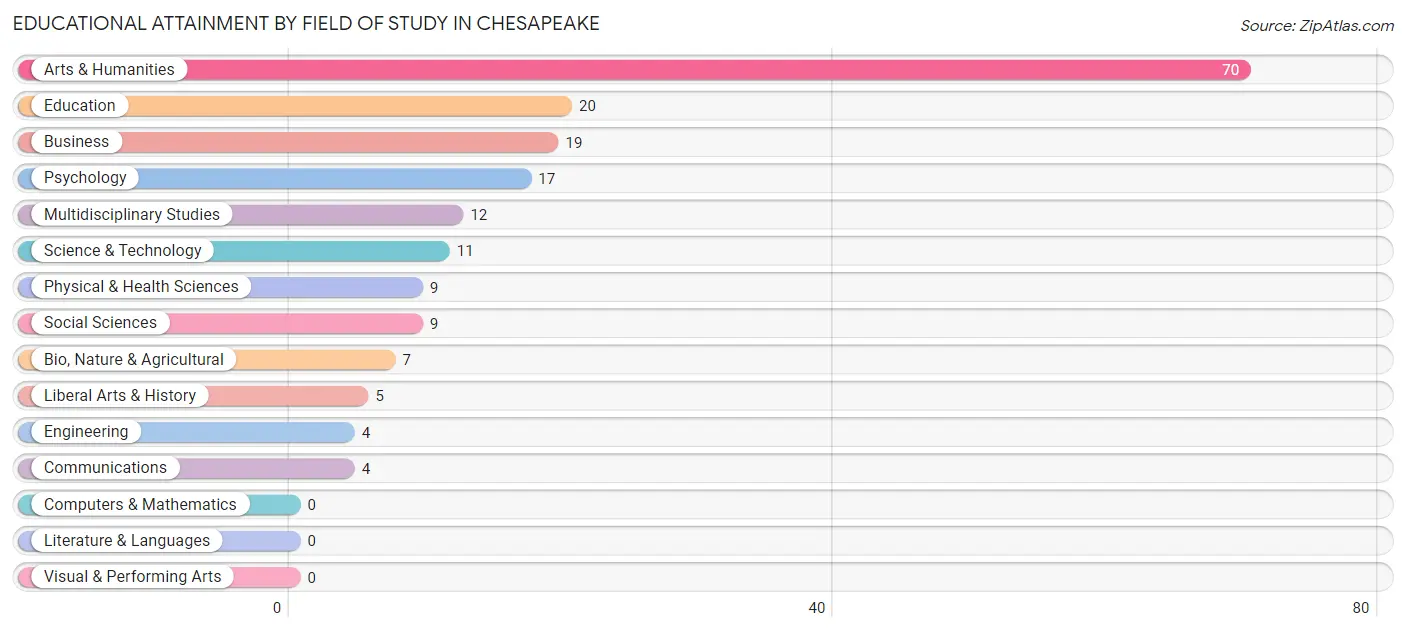
| Field of Study | # Graduates | % Graduates |
| Computers & Mathematics | 0 | 0.0% |
| Bio, Nature & Agricultural | 7 | 3.7% |
| Physical & Health Sciences | 9 | 4.8% |
| Psychology | 17 | 9.1% |
| Social Sciences | 9 | 4.8% |
| Engineering | 4 | 2.1% |
| Multidisciplinary Studies | 12 | 6.4% |
| Science & Technology | 11 | 5.9% |
| Business | 19 | 10.2% |
| Education | 20 | 10.7% |
| Literature & Languages | 0 | 0.0% |
| Liberal Arts & History | 5 | 2.7% |
| Visual & Performing Arts | 0 | 0.0% |
| Communications | 4 | 2.1% |
| Arts & Humanities | 70 | 37.4% |
| Total | 187 | 100.0% |
Transportation & Commute in Chesapeake
Vehicle Availability by Sex in Chesapeake
The most prevalent vehicle ownership categories in Chesapeake are males with 2 vehicles (108, accounting for 44.4%) and females with 2 vehicles (139, making up 46.4%).
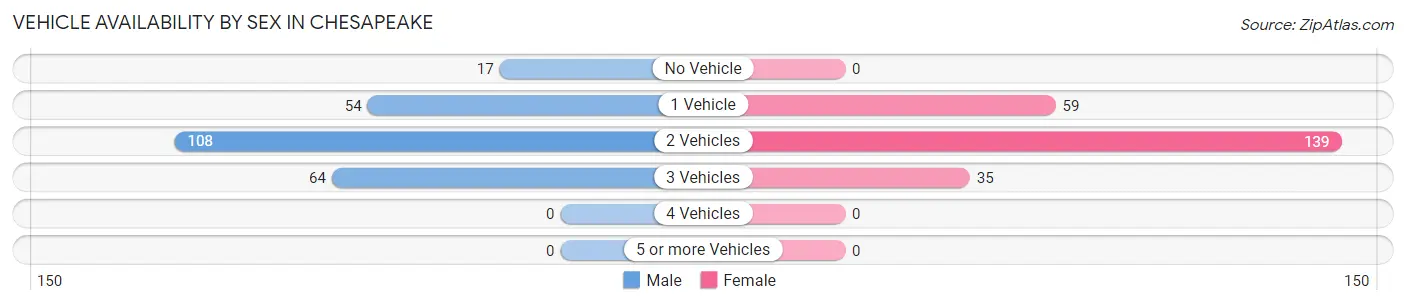
| Vehicles Available | Male | Female |
| No Vehicle | 17 (7.0%) | 0 (0.0%) |
| 1 Vehicle | 54 (22.2%) | 59 (25.3%) |
| 2 Vehicles | 108 (44.4%) | 139 (59.7%) |
| 3 Vehicles | 64 (26.3%) | 35 (15.0%) |
| 4 Vehicles | 0 (0.0%) | 0 (0.0%) |
| 5 or more Vehicles | 0 (0.0%) | 0 (0.0%) |
| Total | 243 (100.0%) | 233 (100.0%) |
Commute Time in Chesapeake
The most frequently occuring commute durations in Chesapeake are 15 to 19 minutes (120 commuters, 25.7%), 30 to 34 minutes (99 commuters, 21.2%), and 20 to 24 minutes (80 commuters, 17.1%).
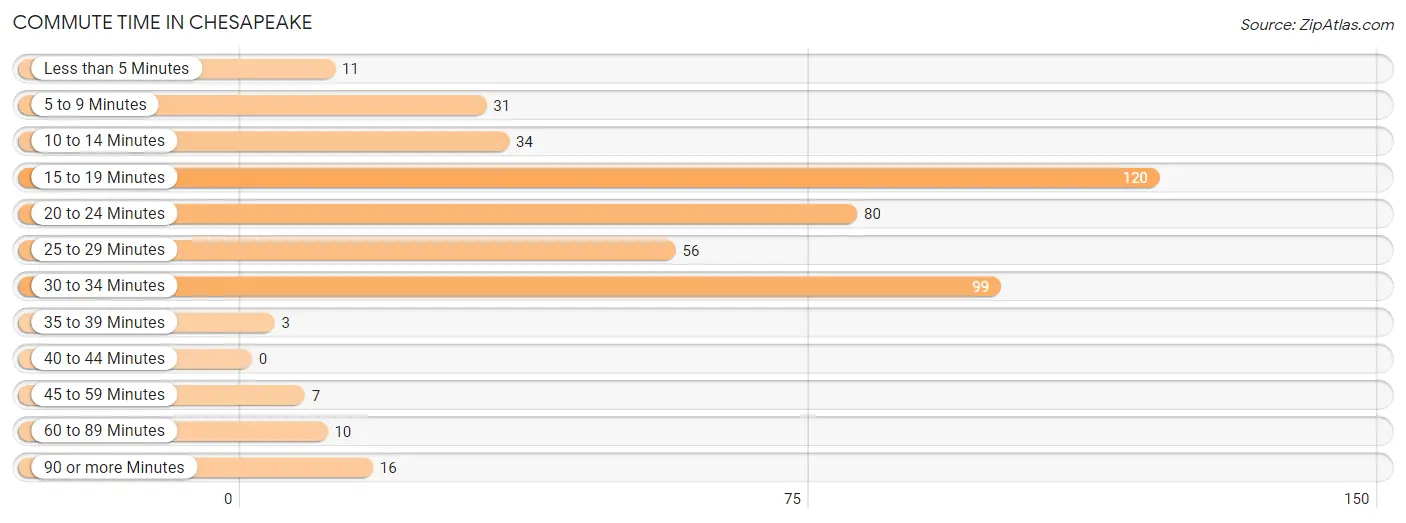
| Commute Time | # Commuters | % Commuters |
| Less than 5 Minutes | 11 | 2.4% |
| 5 to 9 Minutes | 31 | 6.6% |
| 10 to 14 Minutes | 34 | 7.3% |
| 15 to 19 Minutes | 120 | 25.7% |
| 20 to 24 Minutes | 80 | 17.1% |
| 25 to 29 Minutes | 56 | 12.0% |
| 30 to 34 Minutes | 99 | 21.2% |
| 35 to 39 Minutes | 3 | 0.6% |
| 40 to 44 Minutes | 0 | 0.0% |
| 45 to 59 Minutes | 7 | 1.5% |
| 60 to 89 Minutes | 10 | 2.1% |
| 90 or more Minutes | 16 | 3.4% |
Commute Time by Sex in Chesapeake
The most common commute times in Chesapeake are 30 to 34 minutes (85 commuters, 35.0%) for males and 15 to 19 minutes (84 commuters, 37.5%) for females.
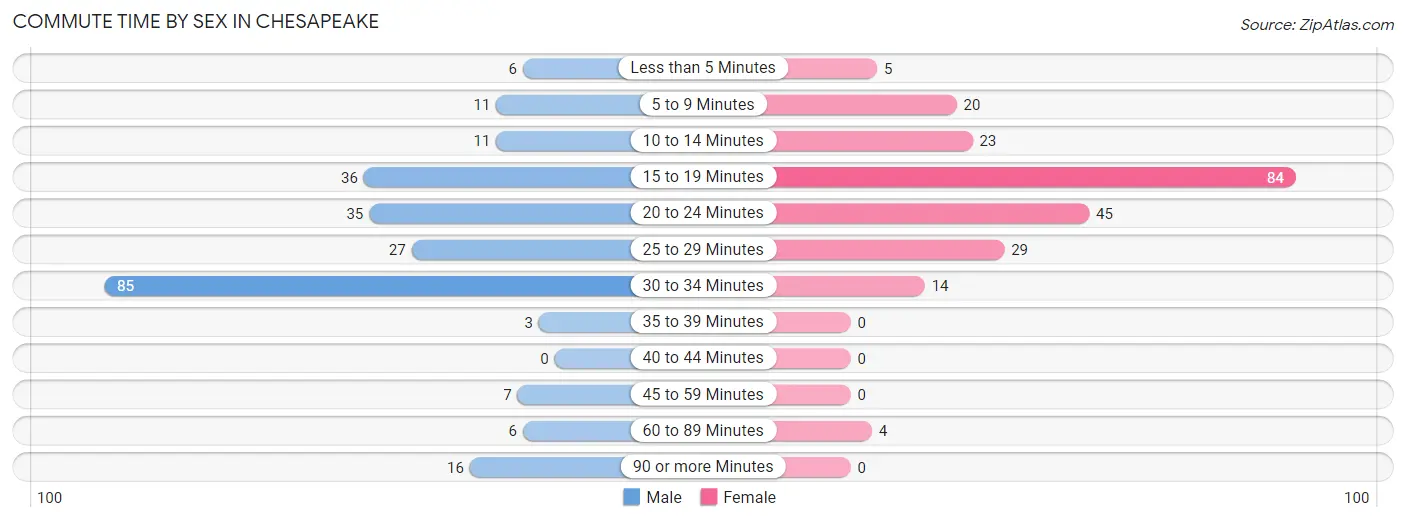
| Commute Time | Male | Female |
| Less than 5 Minutes | 6 (2.5%) | 5 (2.2%) |
| 5 to 9 Minutes | 11 (4.5%) | 20 (8.9%) |
| 10 to 14 Minutes | 11 (4.5%) | 23 (10.3%) |
| 15 to 19 Minutes | 36 (14.8%) | 84 (37.5%) |
| 20 to 24 Minutes | 35 (14.4%) | 45 (20.1%) |
| 25 to 29 Minutes | 27 (11.1%) | 29 (13.0%) |
| 30 to 34 Minutes | 85 (35.0%) | 14 (6.2%) |
| 35 to 39 Minutes | 3 (1.2%) | 0 (0.0%) |
| 40 to 44 Minutes | 0 (0.0%) | 0 (0.0%) |
| 45 to 59 Minutes | 7 (2.9%) | 0 (0.0%) |
| 60 to 89 Minutes | 6 (2.5%) | 4 (1.8%) |
| 90 or more Minutes | 16 (6.6%) | 0 (0.0%) |
Time of Departure to Work by Sex in Chesapeake
The most frequent times of departure to work in Chesapeake are 6:30 AM to 6:59 AM (51, 21.0%) for males and 6:30 AM to 6:59 AM (51, 22.8%) for females.
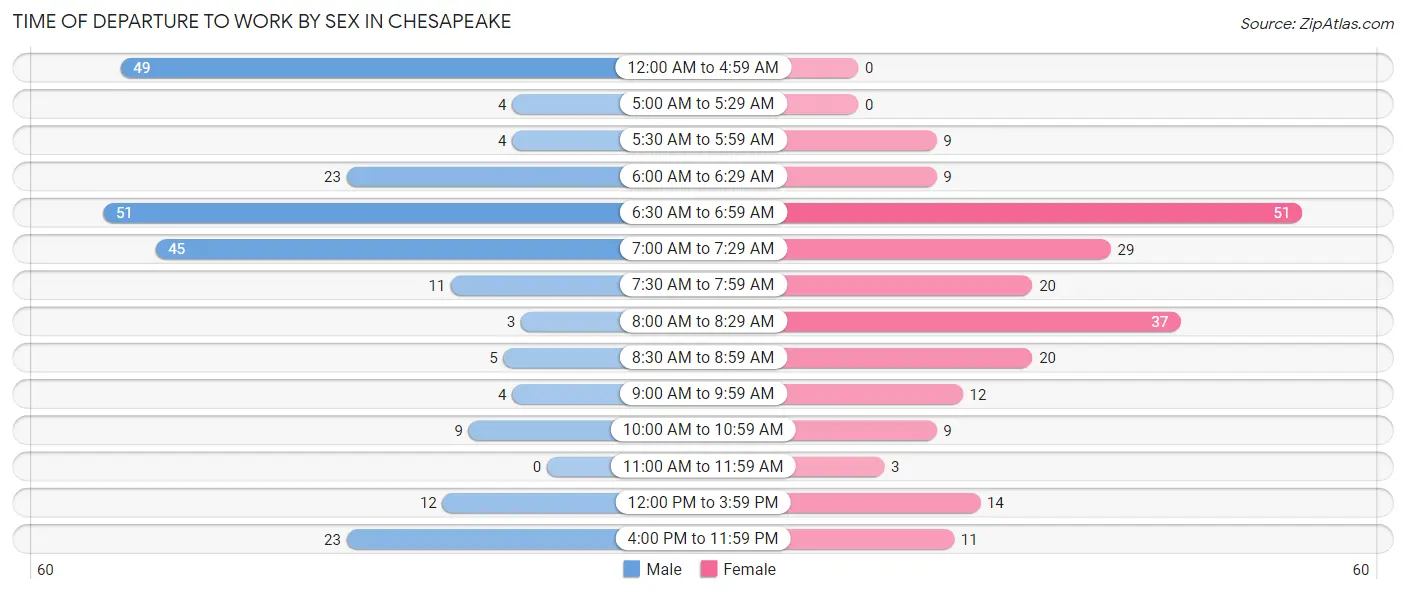
| Time of Departure | Male | Female |
| 12:00 AM to 4:59 AM | 49 (20.2%) | 0 (0.0%) |
| 5:00 AM to 5:29 AM | 4 (1.7%) | 0 (0.0%) |
| 5:30 AM to 5:59 AM | 4 (1.7%) | 9 (4.0%) |
| 6:00 AM to 6:29 AM | 23 (9.5%) | 9 (4.0%) |
| 6:30 AM to 6:59 AM | 51 (21.0%) | 51 (22.8%) |
| 7:00 AM to 7:29 AM | 45 (18.5%) | 29 (13.0%) |
| 7:30 AM to 7:59 AM | 11 (4.5%) | 20 (8.9%) |
| 8:00 AM to 8:29 AM | 3 (1.2%) | 37 (16.5%) |
| 8:30 AM to 8:59 AM | 5 (2.1%) | 20 (8.9%) |
| 9:00 AM to 9:59 AM | 4 (1.7%) | 12 (5.4%) |
| 10:00 AM to 10:59 AM | 9 (3.7%) | 9 (4.0%) |
| 11:00 AM to 11:59 AM | 0 (0.0%) | 3 (1.3%) |
| 12:00 PM to 3:59 PM | 12 (4.9%) | 14 (6.2%) |
| 4:00 PM to 11:59 PM | 23 (9.5%) | 11 (4.9%) |
| Total | 243 (100.0%) | 224 (100.0%) |
Housing Occupancy in Chesapeake
Occupancy by Ownership in Chesapeake
Of the total 694 dwellings in Chesapeake, owner-occupied units account for 484 (69.7%), while renter-occupied units make up 210 (30.3%).
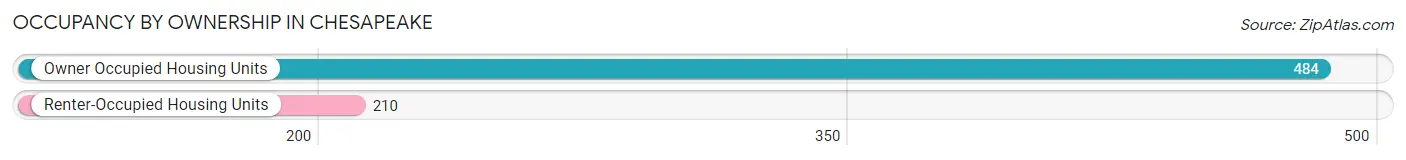
| Occupancy | # Housing Units | % Housing Units |
| Owner Occupied Housing Units | 484 | 69.7% |
| Renter-Occupied Housing Units | 210 | 30.3% |
| Total Occupied Housing Units | 694 | 100.0% |
Occupancy by Household Size in Chesapeake
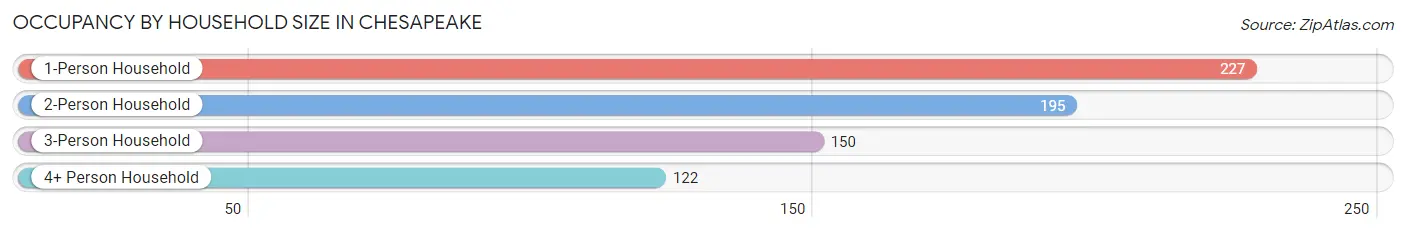
| Household Size | # Housing Units | % Housing Units |
| 1-Person Household | 227 | 32.7% |
| 2-Person Household | 195 | 28.1% |
| 3-Person Household | 150 | 21.6% |
| 4+ Person Household | 122 | 17.6% |
| Total Housing Units | 694 | 100.0% |
Occupancy by Ownership by Household Size in Chesapeake
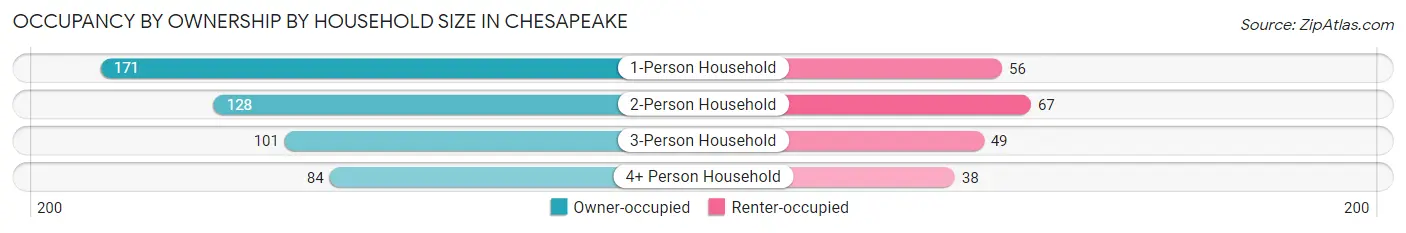
| Household Size | Owner-occupied | Renter-occupied |
| 1-Person Household | 171 (75.3%) | 56 (24.7%) |
| 2-Person Household | 128 (65.6%) | 67 (34.4%) |
| 3-Person Household | 101 (67.3%) | 49 (32.7%) |
| 4+ Person Household | 84 (68.9%) | 38 (31.1%) |
| Total Housing Units | 484 (69.7%) | 210 (30.3%) |
Occupancy by Educational Attainment in Chesapeake
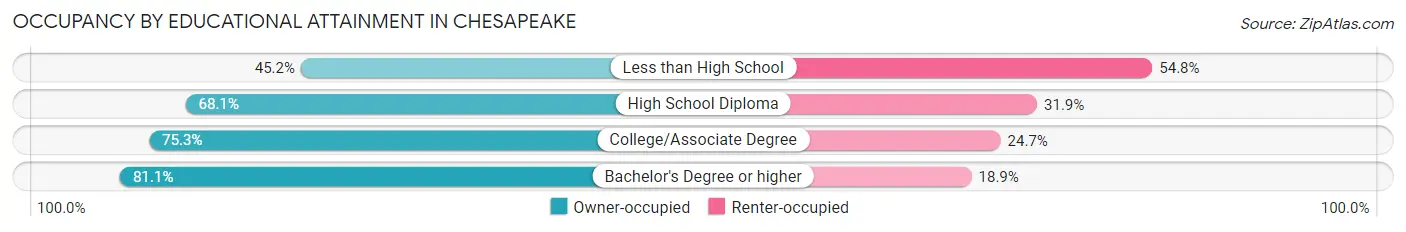
| Household Size | Owner-occupied | Renter-occupied |
| Less than High School | 38 (45.2%) | 46 (54.8%) |
| High School Diploma | 207 (68.1%) | 97 (31.9%) |
| College/Associate Degree | 119 (75.3%) | 39 (24.7%) |
| Bachelor's Degree or higher | 120 (81.1%) | 28 (18.9%) |
Occupancy by Age of Householder in Chesapeake
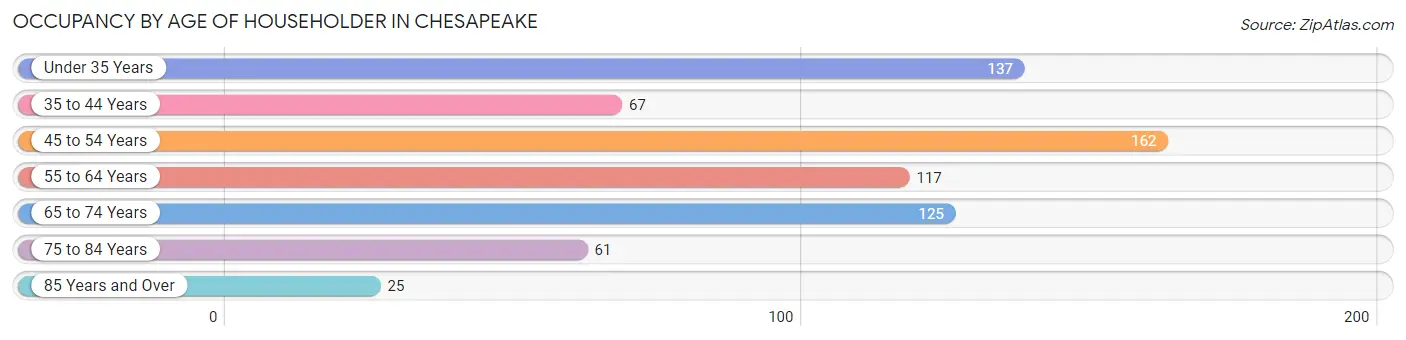
| Age Bracket | # Households | % Households |
| Under 35 Years | 137 | 19.7% |
| 35 to 44 Years | 67 | 9.7% |
| 45 to 54 Years | 162 | 23.3% |
| 55 to 64 Years | 117 | 16.9% |
| 65 to 74 Years | 125 | 18.0% |
| 75 to 84 Years | 61 | 8.8% |
| 85 Years and Over | 25 | 3.6% |
| Total | 694 | 100.0% |
Housing Finances in Chesapeake
Median Income by Occupancy in Chesapeake
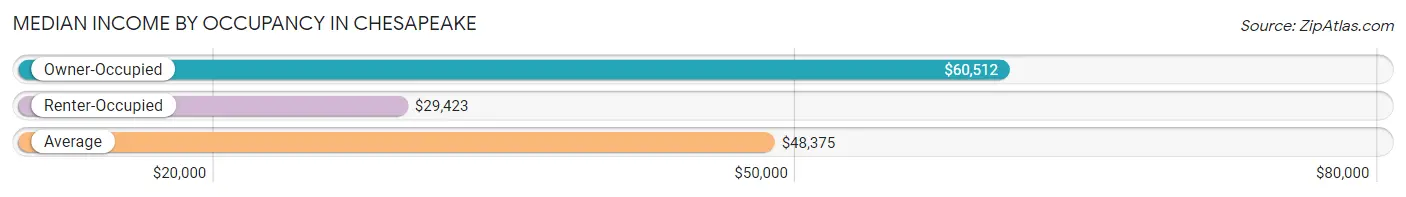
| Occupancy Type | # Households | Median Income |
| Owner-Occupied | 484 (69.7%) | $60,512 |
| Renter-Occupied | 210 (30.3%) | $29,423 |
| Average | 694 (100.0%) | $48,375 |
Occupancy by Householder Income Bracket in Chesapeake
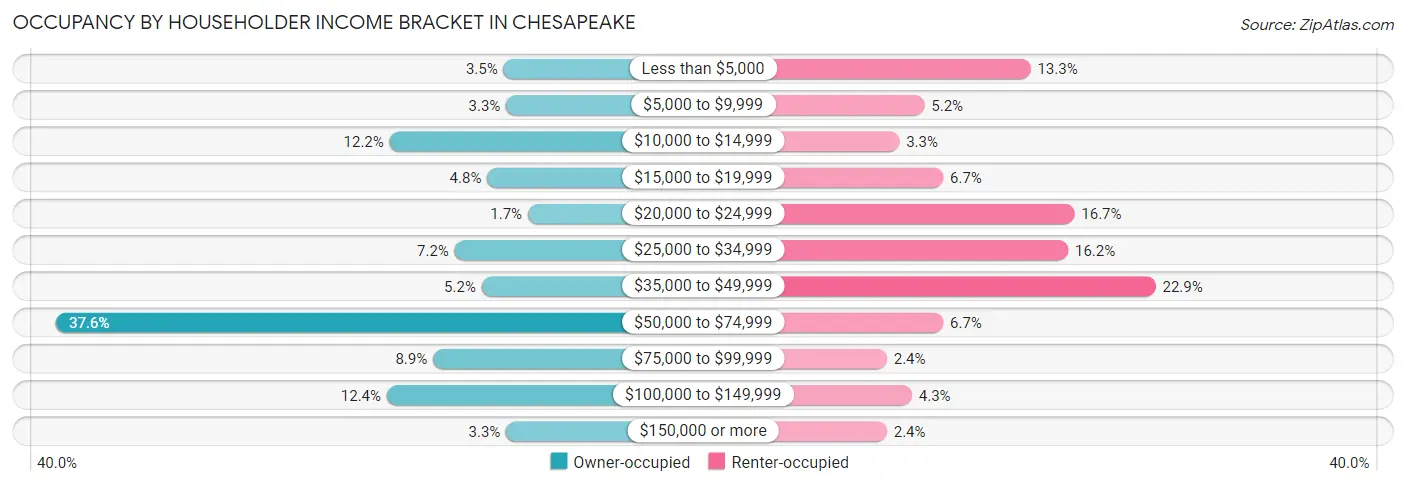
| Income Bracket | Owner-occupied | Renter-occupied |
| Less than $5,000 | 17 (3.5%) | 28 (13.3%) |
| $5,000 to $9,999 | 16 (3.3%) | 11 (5.2%) |
| $10,000 to $14,999 | 59 (12.2%) | 7 (3.3%) |
| $15,000 to $19,999 | 23 (4.8%) | 14 (6.7%) |
| $20,000 to $24,999 | 8 (1.7%) | 35 (16.7%) |
| $25,000 to $34,999 | 35 (7.2%) | 34 (16.2%) |
| $35,000 to $49,999 | 25 (5.2%) | 48 (22.9%) |
| $50,000 to $74,999 | 182 (37.6%) | 14 (6.7%) |
| $75,000 to $99,999 | 43 (8.9%) | 5 (2.4%) |
| $100,000 to $149,999 | 60 (12.4%) | 9 (4.3%) |
| $150,000 or more | 16 (3.3%) | 5 (2.4%) |
| Total | 484 (100.0%) | 210 (100.0%) |
Monthly Housing Cost Tiers in Chesapeake
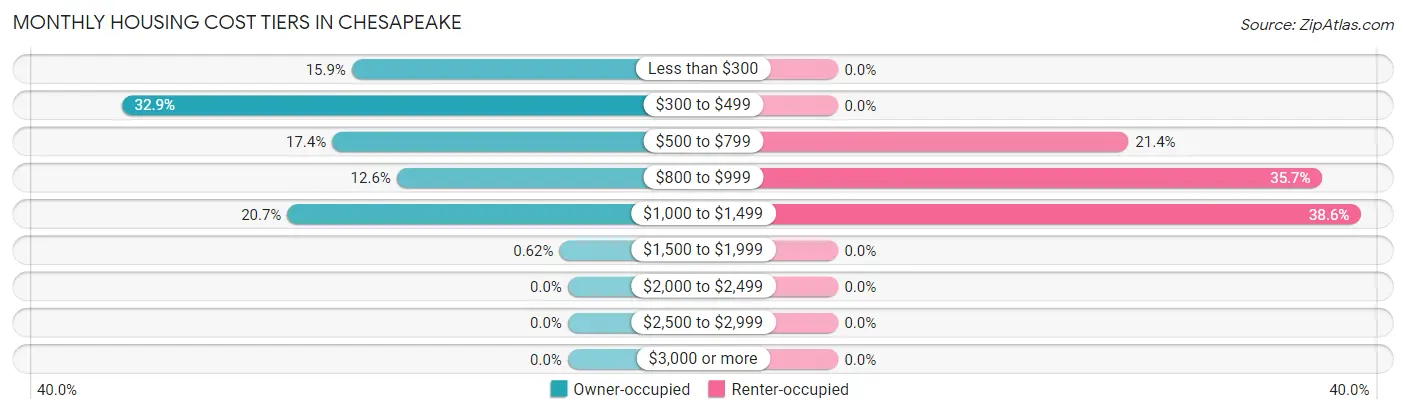
| Monthly Cost | Owner-occupied | Renter-occupied |
| Less than $300 | 77 (15.9%) | 0 (0.0%) |
| $300 to $499 | 159 (32.9%) | 0 (0.0%) |
| $500 to $799 | 84 (17.4%) | 45 (21.4%) |
| $800 to $999 | 61 (12.6%) | 75 (35.7%) |
| $1,000 to $1,499 | 100 (20.7%) | 81 (38.6%) |
| $1,500 to $1,999 | 3 (0.6%) | 0 (0.0%) |
| $2,000 to $2,499 | 0 (0.0%) | 0 (0.0%) |
| $2,500 to $2,999 | 0 (0.0%) | 0 (0.0%) |
| $3,000 or more | 0 (0.0%) | 0 (0.0%) |
| Total | 484 (100.0%) | 210 (100.0%) |
Physical Housing Characteristics in Chesapeake
Housing Structures in Chesapeake
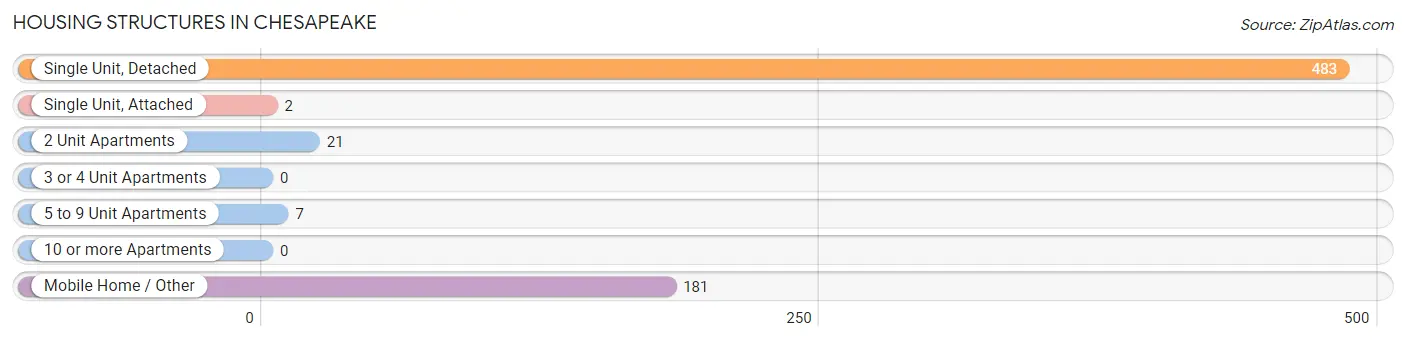
| Structure Type | # Housing Units | % Housing Units |
| Single Unit, Detached | 483 | 69.6% |
| Single Unit, Attached | 2 | 0.3% |
| 2 Unit Apartments | 21 | 3.0% |
| 3 or 4 Unit Apartments | 0 | 0.0% |
| 5 to 9 Unit Apartments | 7 | 1.0% |
| 10 or more Apartments | 0 | 0.0% |
| Mobile Home / Other | 181 | 26.1% |
| Total | 694 | 100.0% |
Housing Structures by Occupancy in Chesapeake
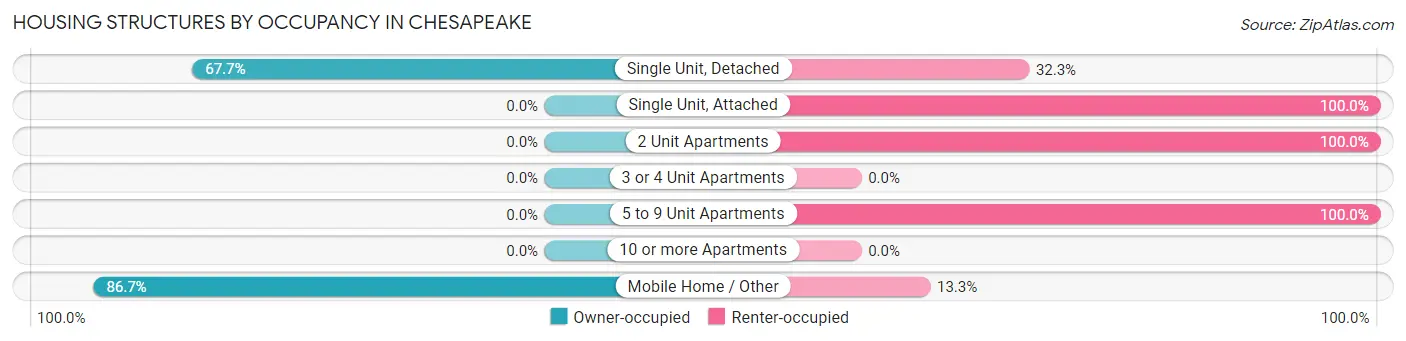
| Structure Type | Owner-occupied | Renter-occupied |
| Single Unit, Detached | 327 (67.7%) | 156 (32.3%) |
| Single Unit, Attached | 0 (0.0%) | 2 (100.0%) |
| 2 Unit Apartments | 0 (0.0%) | 21 (100.0%) |
| 3 or 4 Unit Apartments | 0 (0.0%) | 0 (0.0%) |
| 5 to 9 Unit Apartments | 0 (0.0%) | 7 (100.0%) |
| 10 or more Apartments | 0 (0.0%) | 0 (0.0%) |
| Mobile Home / Other | 157 (86.7%) | 24 (13.3%) |
| Total | 484 (69.7%) | 210 (30.3%) |
Housing Structures by Number of Rooms in Chesapeake
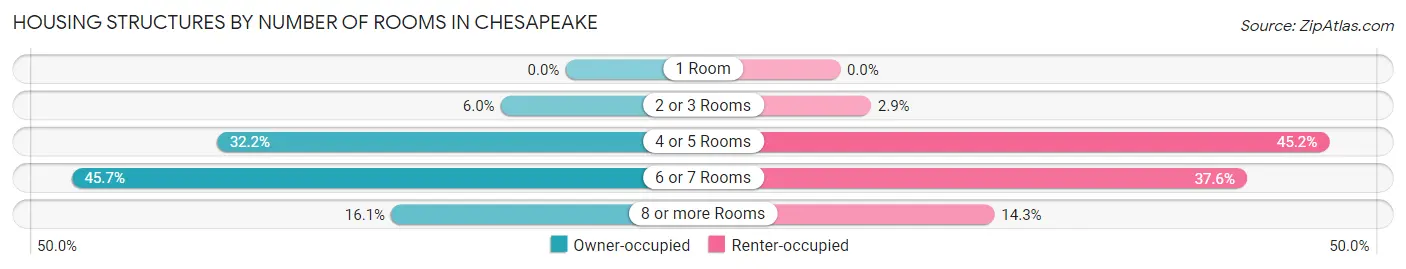
| Number of Rooms | Owner-occupied | Renter-occupied |
| 1 Room | 0 (0.0%) | 0 (0.0%) |
| 2 or 3 Rooms | 29 (6.0%) | 6 (2.9%) |
| 4 or 5 Rooms | 156 (32.2%) | 95 (45.2%) |
| 6 or 7 Rooms | 221 (45.7%) | 79 (37.6%) |
| 8 or more Rooms | 78 (16.1%) | 30 (14.3%) |
| Total | 484 (100.0%) | 210 (100.0%) |
Housing Structure by Heating Type in Chesapeake
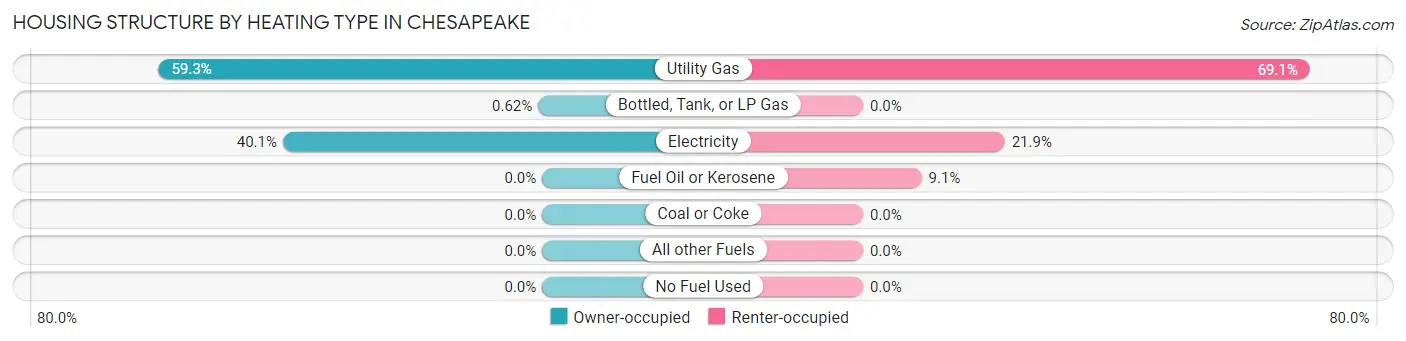
| Heating Type | Owner-occupied | Renter-occupied |
| Utility Gas | 287 (59.3%) | 145 (69.1%) |
| Bottled, Tank, or LP Gas | 3 (0.6%) | 0 (0.0%) |
| Electricity | 194 (40.1%) | 46 (21.9%) |
| Fuel Oil or Kerosene | 0 (0.0%) | 19 (9.0%) |
| Coal or Coke | 0 (0.0%) | 0 (0.0%) |
| All other Fuels | 0 (0.0%) | 0 (0.0%) |
| No Fuel Used | 0 (0.0%) | 0 (0.0%) |
| Total | 484 (100.0%) | 210 (100.0%) |
Household Vehicle Usage in Chesapeake
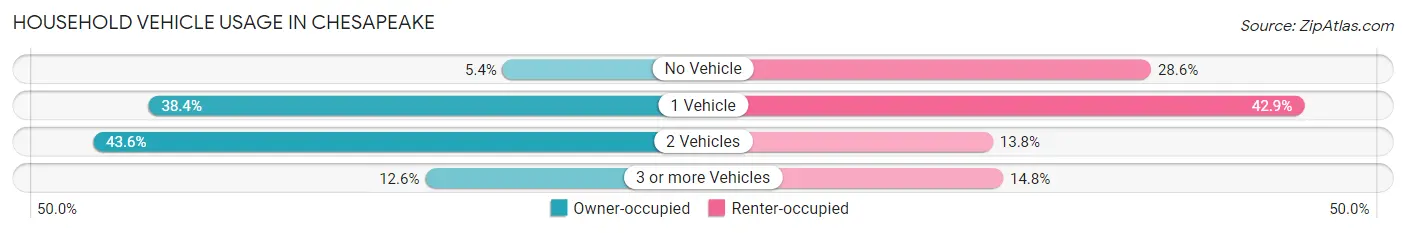
| Vehicles per Household | Owner-occupied | Renter-occupied |
| No Vehicle | 26 (5.4%) | 60 (28.6%) |
| 1 Vehicle | 186 (38.4%) | 90 (42.9%) |
| 2 Vehicles | 211 (43.6%) | 29 (13.8%) |
| 3 or more Vehicles | 61 (12.6%) | 31 (14.8%) |
| Total | 484 (100.0%) | 210 (100.0%) |
Real Estate & Mortgages in Chesapeake
Real Estate and Mortgage Overview in Chesapeake
| Characteristic | Without Mortgage | With Mortgage |
| Housing Units | 292 | 192 |
| Median Property Value | $56,900 | $104,900 |
| Median Household Income | $47,000 | $5 |
| Monthly Housing Costs | $370 | $0 |
| Real Estate Taxes | $567 | $17 |
Property Value by Mortgage Status in Chesapeake
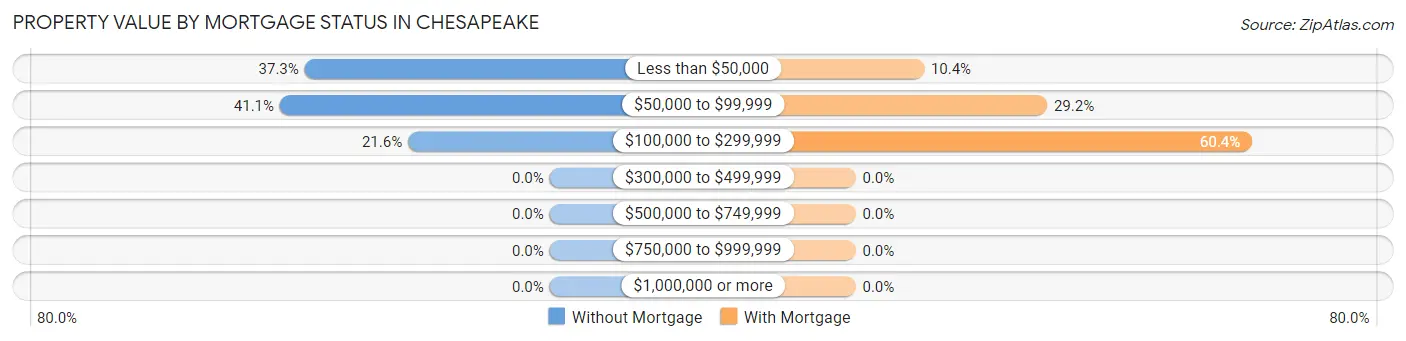
| Property Value | Without Mortgage | With Mortgage |
| Less than $50,000 | 109 (37.3%) | 20 (10.4%) |
| $50,000 to $99,999 | 120 (41.1%) | 56 (29.2%) |
| $100,000 to $299,999 | 63 (21.6%) | 116 (60.4%) |
| $300,000 to $499,999 | 0 (0.0%) | 0 (0.0%) |
| $500,000 to $749,999 | 0 (0.0%) | 0 (0.0%) |
| $750,000 to $999,999 | 0 (0.0%) | 0 (0.0%) |
| $1,000,000 or more | 0 (0.0%) | 0 (0.0%) |
| Total | 292 (100.0%) | 192 (100.0%) |
Household Income by Mortgage Status in Chesapeake
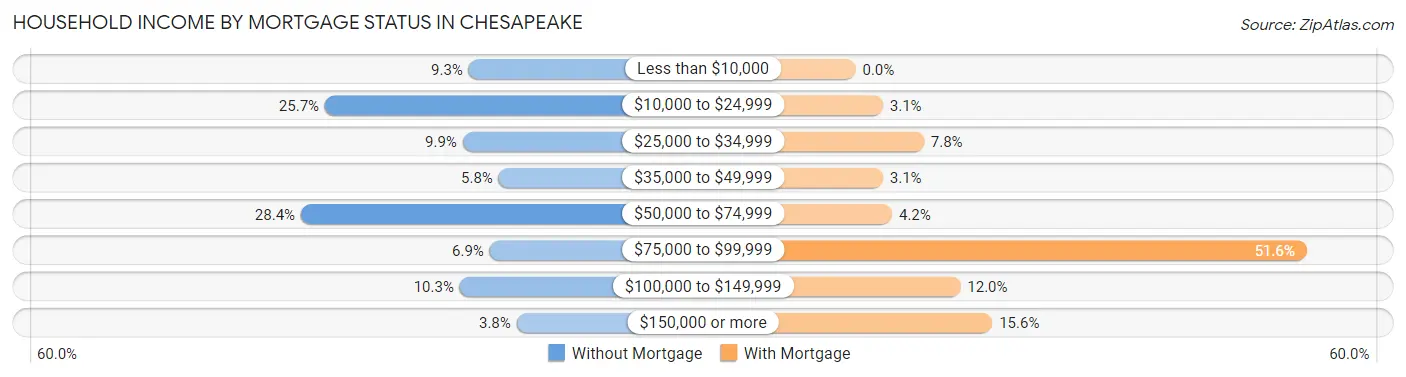
| Household Income | Without Mortgage | With Mortgage |
| Less than $10,000 | 27 (9.2%) | 0 (0.0%) |
| $10,000 to $24,999 | 75 (25.7%) | 6 (3.1%) |
| $25,000 to $34,999 | 29 (9.9%) | 15 (7.8%) |
| $35,000 to $49,999 | 17 (5.8%) | 6 (3.1%) |
| $50,000 to $74,999 | 83 (28.4%) | 8 (4.2%) |
| $75,000 to $99,999 | 20 (6.9%) | 99 (51.6%) |
| $100,000 to $149,999 | 30 (10.3%) | 23 (12.0%) |
| $150,000 or more | 11 (3.8%) | 30 (15.6%) |
| Total | 292 (100.0%) | 192 (100.0%) |
Property Value to Household Income Ratio in Chesapeake
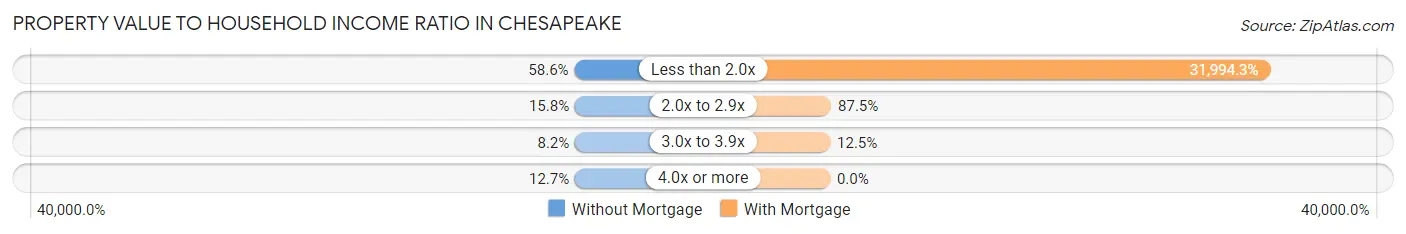
| Value-to-Income Ratio | Without Mortgage | With Mortgage |
| Less than 2.0x | 171 (58.6%) | 61,429 (31,994.3%) |
| 2.0x to 2.9x | 46 (15.8%) | 168 (87.5%) |
| 3.0x to 3.9x | 24 (8.2%) | 24 (12.5%) |
| 4.0x or more | 37 (12.7%) | 0 (0.0%) |
| Total | 292 (100.0%) | 192 (100.0%) |
Real Estate Taxes by Mortgage Status in Chesapeake
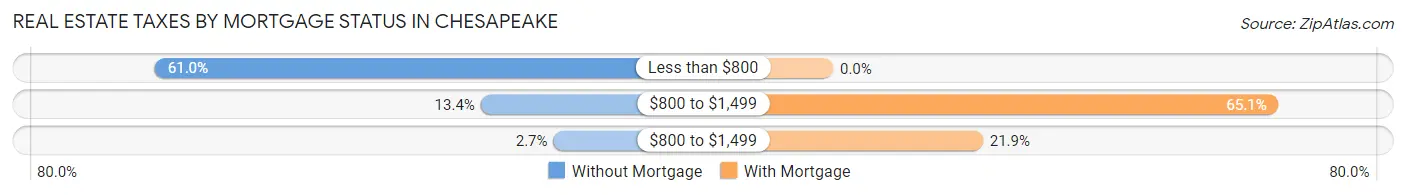
| Property Taxes | Without Mortgage | With Mortgage |
| Less than $800 | 178 (61.0%) | 0 (0.0%) |
| $800 to $1,499 | 39 (13.4%) | 125 (65.1%) |
| $800 to $1,499 | 8 (2.7%) | 42 (21.9%) |
| Total | 292 (100.0%) | 192 (100.0%) |
Health & Disability in Chesapeake
Health Insurance Coverage by Age in Chesapeake
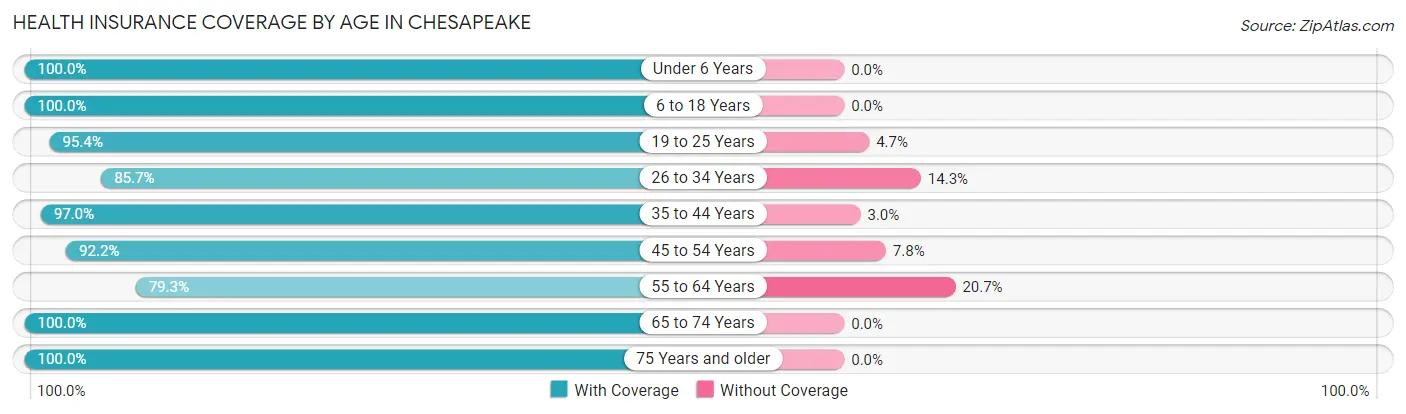
| Age Bracket | With Coverage | Without Coverage |
| Under 6 Years | 130 (100.0%) | 0 (0.0%) |
| 6 to 18 Years | 237 (100.0%) | 0 (0.0%) |
| 19 to 25 Years | 82 (95.4%) | 4 (4.6%) |
| 26 to 34 Years | 228 (85.7%) | 38 (14.3%) |
| 35 to 44 Years | 128 (97.0%) | 4 (3.0%) |
| 45 to 54 Years | 226 (92.2%) | 19 (7.8%) |
| 55 to 64 Years | 130 (79.3%) | 34 (20.7%) |
| 65 to 74 Years | 201 (100.0%) | 0 (0.0%) |
| 75 Years and older | 124 (100.0%) | 0 (0.0%) |
| Total | 1,486 (93.8%) | 99 (6.2%) |
Health Insurance Coverage by Citizenship Status in Chesapeake
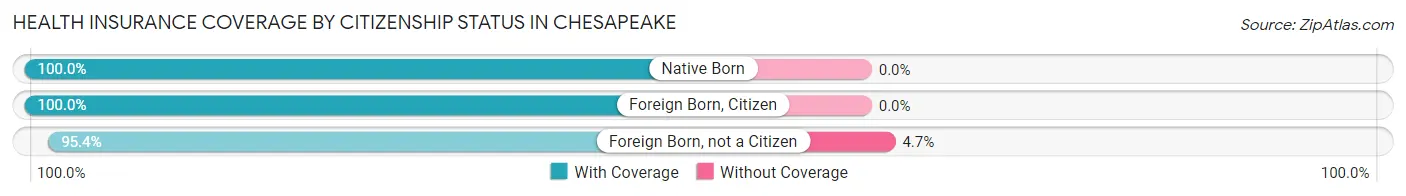
| Citizenship Status | With Coverage | Without Coverage |
| Native Born | 130 (100.0%) | 0 (0.0%) |
| Foreign Born, Citizen | 237 (100.0%) | 0 (0.0%) |
| Foreign Born, not a Citizen | 82 (95.4%) | 4 (4.6%) |
Health Insurance Coverage by Household Income in Chesapeake
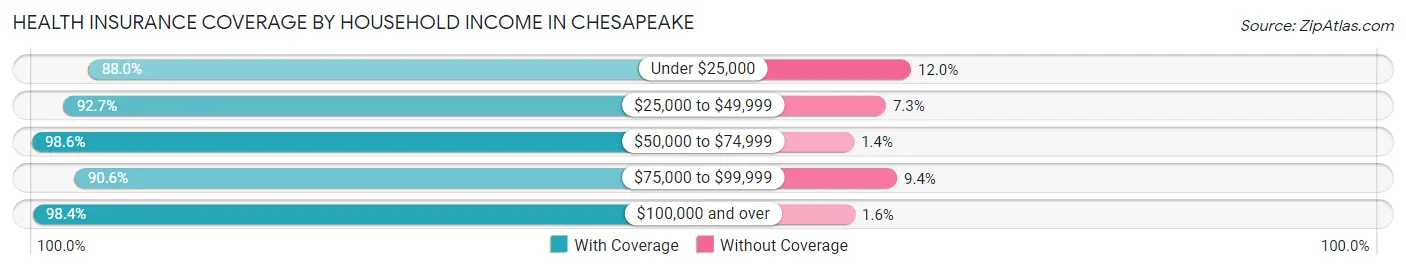
| Household Income | With Coverage | Without Coverage |
| Under $25,000 | 380 (88.0%) | 52 (12.0%) |
| $25,000 to $49,999 | 303 (92.7%) | 24 (7.3%) |
| $50,000 to $74,999 | 425 (98.6%) | 6 (1.4%) |
| $75,000 to $99,999 | 125 (90.6%) | 13 (9.4%) |
| $100,000 and over | 253 (98.4%) | 4 (1.6%) |
Public vs Private Health Insurance Coverage by Age in Chesapeake
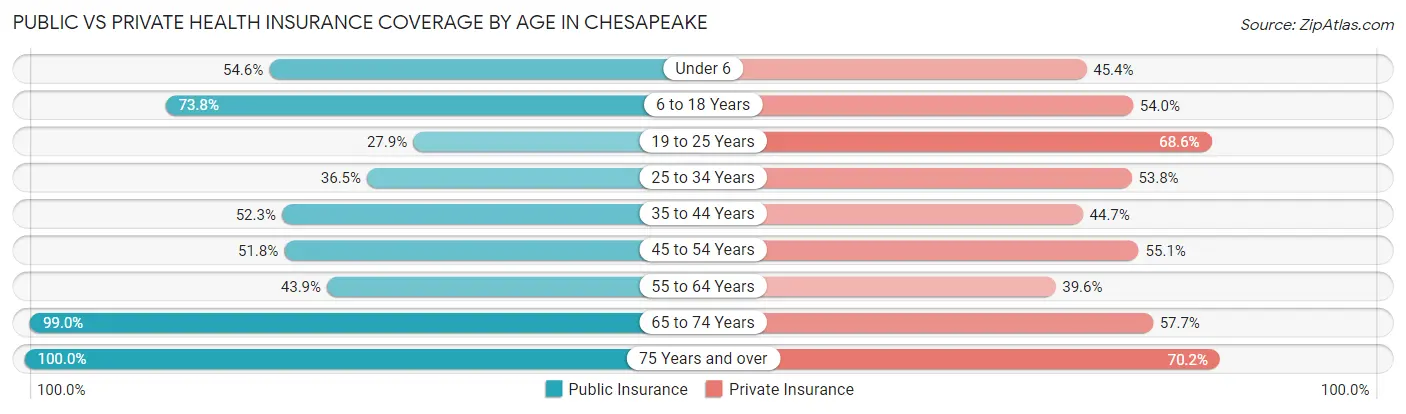
| Age Bracket | Public Insurance | Private Insurance |
| Under 6 | 71 (54.6%) | 59 (45.4%) |
| 6 to 18 Years | 175 (73.8%) | 128 (54.0%) |
| 19 to 25 Years | 24 (27.9%) | 59 (68.6%) |
| 25 to 34 Years | 97 (36.5%) | 143 (53.8%) |
| 35 to 44 Years | 69 (52.3%) | 59 (44.7%) |
| 45 to 54 Years | 127 (51.8%) | 135 (55.1%) |
| 55 to 64 Years | 72 (43.9%) | 65 (39.6%) |
| 65 to 74 Years | 199 (99.0%) | 116 (57.7%) |
| 75 Years and over | 124 (100.0%) | 87 (70.2%) |
| Total | 958 (60.4%) | 851 (53.7%) |
Disability Status by Sex by Age in Chesapeake
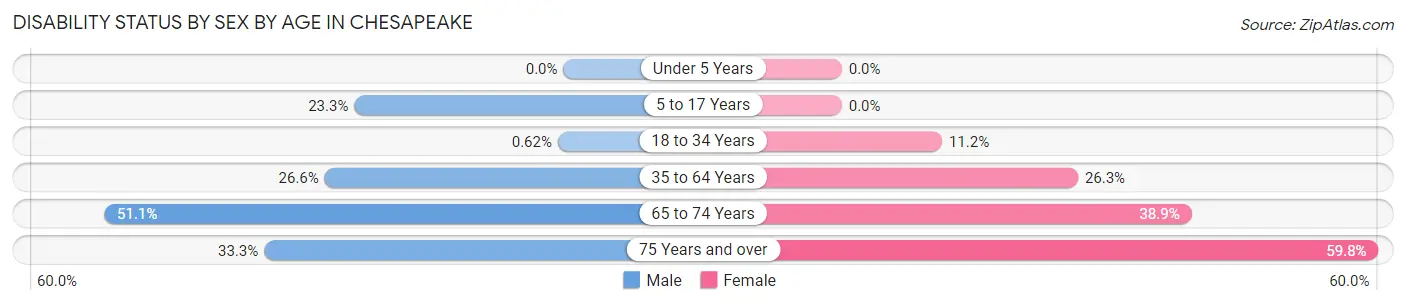
| Age Bracket | Male | Female |
| Under 5 Years | 0 (0.0%) | 0 (0.0%) |
| 5 to 17 Years | 34 (23.3%) | 0 (0.0%) |
| 18 to 34 Years | 1 (0.6%) | 24 (11.2%) |
| 35 to 64 Years | 67 (26.6%) | 76 (26.3%) |
| 65 to 74 Years | 45 (51.1%) | 44 (38.9%) |
| 75 Years and over | 14 (33.3%) | 49 (59.8%) |
Disability Class by Sex by Age in Chesapeake
Disability Class: Hearing Difficulty
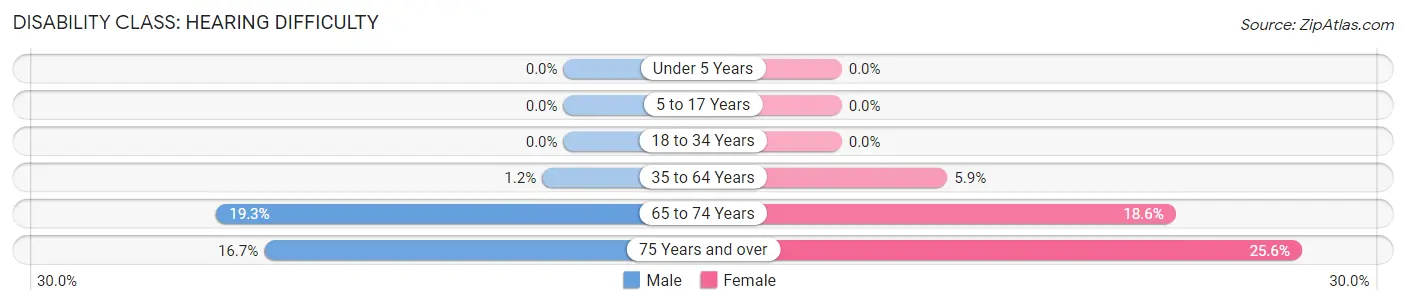
| Age Bracket | Male | Female |
| Under 5 Years | 0 (0.0%) | 0 (0.0%) |
| 5 to 17 Years | 0 (0.0%) | 0 (0.0%) |
| 18 to 34 Years | 0 (0.0%) | 0 (0.0%) |
| 35 to 64 Years | 3 (1.2%) | 17 (5.9%) |
| 65 to 74 Years | 17 (19.3%) | 21 (18.6%) |
| 75 Years and over | 7 (16.7%) | 21 (25.6%) |
Disability Class: Vision Difficulty
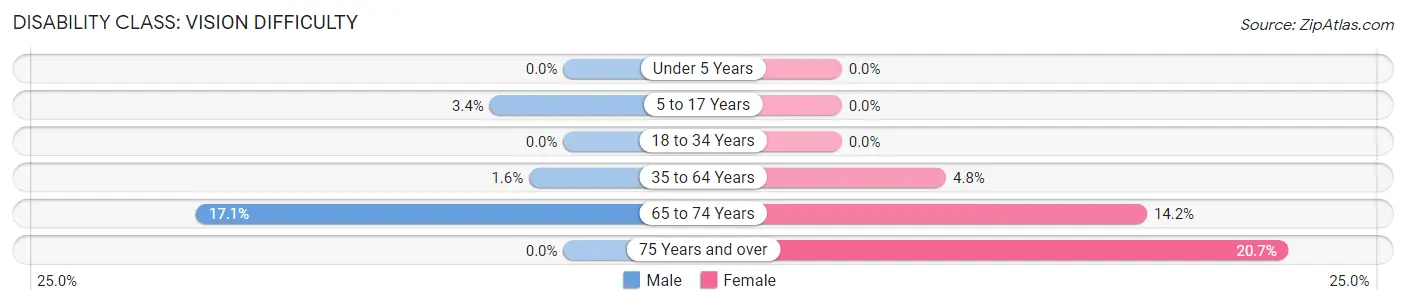
| Age Bracket | Male | Female |
| Under 5 Years | 0 (0.0%) | 0 (0.0%) |
| 5 to 17 Years | 5 (3.4%) | 0 (0.0%) |
| 18 to 34 Years | 0 (0.0%) | 0 (0.0%) |
| 35 to 64 Years | 4 (1.6%) | 14 (4.8%) |
| 65 to 74 Years | 15 (17.1%) | 16 (14.2%) |
| 75 Years and over | 0 (0.0%) | 17 (20.7%) |
Disability Class: Cognitive Difficulty
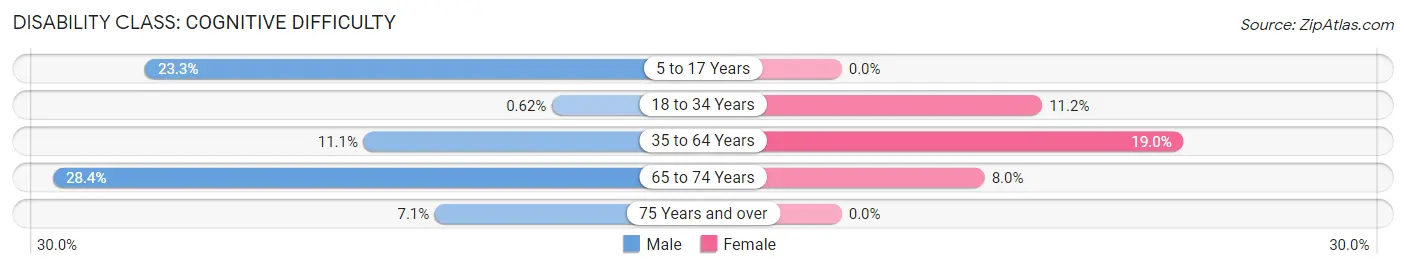
| Age Bracket | Male | Female |
| 5 to 17 Years | 34 (23.3%) | 0 (0.0%) |
| 18 to 34 Years | 1 (0.6%) | 24 (11.2%) |
| 35 to 64 Years | 28 (11.1%) | 55 (19.0%) |
| 65 to 74 Years | 25 (28.4%) | 9 (8.0%) |
| 75 Years and over | 3 (7.1%) | 0 (0.0%) |
Disability Class: Ambulatory Difficulty
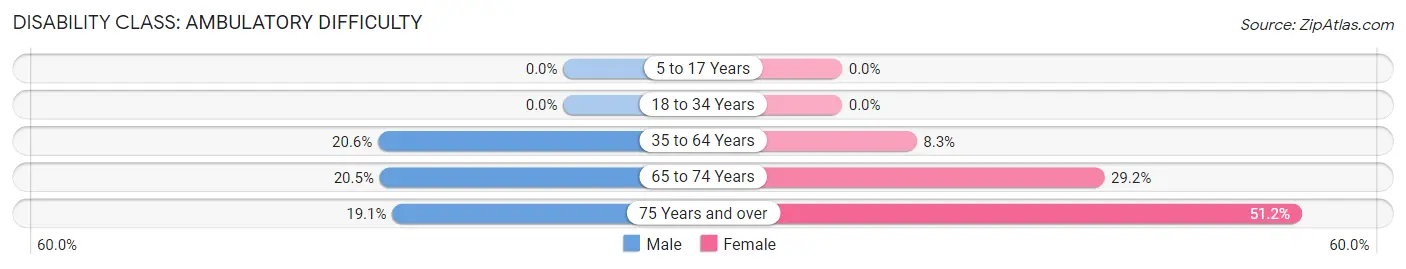
| Age Bracket | Male | Female |
| 5 to 17 Years | 0 (0.0%) | 0 (0.0%) |
| 18 to 34 Years | 0 (0.0%) | 0 (0.0%) |
| 35 to 64 Years | 52 (20.6%) | 24 (8.3%) |
| 65 to 74 Years | 18 (20.4%) | 33 (29.2%) |
| 75 Years and over | 8 (19.1%) | 42 (51.2%) |
Disability Class: Self-Care Difficulty
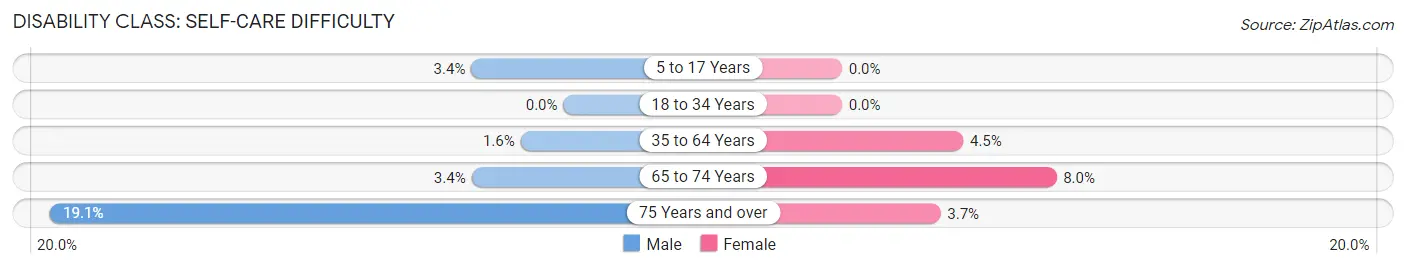
| Age Bracket | Male | Female |
| 5 to 17 Years | 5 (3.4%) | 0 (0.0%) |
| 18 to 34 Years | 0 (0.0%) | 0 (0.0%) |
| 35 to 64 Years | 4 (1.6%) | 13 (4.5%) |
| 65 to 74 Years | 3 (3.4%) | 9 (8.0%) |
| 75 Years and over | 8 (19.1%) | 3 (3.7%) |
Technology Access in Chesapeake
Computing Device Access in Chesapeake
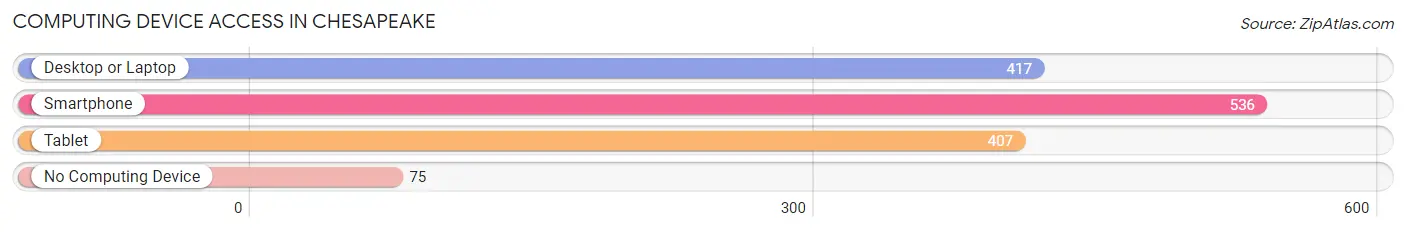
| Device Type | # Households | % Households |
| Desktop or Laptop | 417 | 60.1% |
| Smartphone | 536 | 77.2% |
| Tablet | 407 | 58.7% |
| No Computing Device | 75 | 10.8% |
| Total | 694 | 100.0% |
Internet Access in Chesapeake
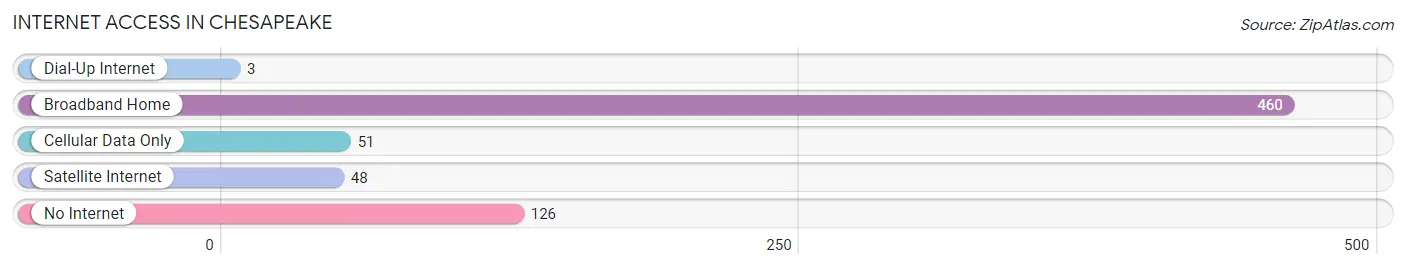
| Internet Type | # Households | % Households |
| Dial-Up Internet | 3 | 0.4% |
| Broadband Home | 460 | 66.3% |
| Cellular Data Only | 51 | 7.3% |
| Satellite Internet | 48 | 6.9% |
| No Internet | 126 | 18.2% |
| Total | 694 | 100.0% |
Chesapeake Summary
Chesapeake, West Virginia is a small town located in the southwestern part of the state, in Kanawha County. It is situated along the Kanawha River, and is part of the Charleston metropolitan area. The town has a population of approximately 1,500 people, and is known for its small-town charm and friendly atmosphere.
History
Chesapeake was founded in 1883 by a group of settlers from the nearby town of Clendenin. The town was named after the Chesapeake and Ohio Railway, which ran through the area. The town was incorporated in 1891, and the first post office was established in 1892.
The town grew slowly over the years, and by the early 1900s, it had become a popular destination for tourists. The town was known for its scenic beauty, and it was a popular spot for fishing and hunting.
In the 1950s, the town began to experience a period of growth, as the coal industry in the area began to expand. The town was home to several coal mines, and the population began to increase.
Geography
Chesapeake is located in the southwestern part of West Virginia, in Kanawha County. It is situated along the Kanawha River, and is part of the Charleston metropolitan area. The town is located at an elevation of 845 feet above sea level.
The town is surrounded by rolling hills and forests, and is home to several parks and recreational areas. The town is also home to several historic sites, including the Chesapeake and Ohio Railway Depot, which was built in 1891.
Economy
The economy of Chesapeake is largely based on the coal industry. The town is home to several coal mines, and the coal industry is the main source of employment in the area. The town is also home to several small businesses, including restaurants, shops, and other services.
Demographics
As of the 2010 census, the population of Chesapeake was 1,500 people. The racial makeup of the town was 97.3% White, 0.7% African American, 0.3% Native American, 0.3% Asian, and 1.3% from other races. The median household income was $30,000, and the median family income was $35,000.
Conclusion
Chesapeake, West Virginia is a small town located in the southwestern part of the state, in Kanawha County. It is situated along the Kanawha River, and is part of the Charleston metropolitan area. The town has a population of approximately 1,500 people, and is known for its small-town charm and friendly atmosphere. The economy of Chesapeake is largely based on the coal industry, and the town is home to several small businesses. The racial makeup of the town is predominantly White, with a small percentage of African American, Native American, and Asian residents.
Common Questions
What is Per Capita Income in Chesapeake?
Per Capita income in Chesapeake is $21,790.
What is the Median Family Income in Chesapeake?
Median Family Income in Chesapeake is $60,781.
What is the Median Household income in Chesapeake?
Median Household Income in Chesapeake is $48,375.
What is Income or Wage Gap in Chesapeake?
Income or Wage Gap in Chesapeake is 22.0%.
Women in Chesapeake earn 78.0 cents for every dollar earned by a man.
What is Inequality or Gini Index in Chesapeake?
Inequality or Gini Index in Chesapeake is 0.42.
What is the Total Population of Chesapeake?
Total Population of Chesapeake is 1,585.
What is the Total Male Population of Chesapeake?
Total Male Population of Chesapeake is 770.
What is the Total Female Population of Chesapeake?
Total Female Population of Chesapeake is 815.
What is the Ratio of Males per 100 Females in Chesapeake?
There are 94.48 Males per 100 Females in Chesapeake.
What is the Ratio of Females per 100 Males in Chesapeake?
There are 105.84 Females per 100 Males in Chesapeake.
What is the Median Population Age in Chesapeake?
Median Population Age in Chesapeake is 39.2 Years.
What is the Average Family Size in Chesapeake
Average Family Size in Chesapeake is 2.8 People.
What is the Average Household Size in Chesapeake
Average Household Size in Chesapeake is 2.3 People.
How Large is the Labor Force in Chesapeake?
There are 503 People in the Labor Forcein in Chesapeake.
What is the Percentage of People in the Labor Force in Chesapeake?
39.5% of People are in the Labor Force in Chesapeake.
What is the Unemployment Rate in Chesapeake?
Unemployment Rate in Chesapeake is 5.4%.