Coal Fork, WV Map & Demographics
Coal Fork Map
Coal Fork Overview
$30,044
PER CAPITA INCOME
$60,812
AVG FAMILY INCOME
$60,534
AVG HOUSEHOLD INCOME
31.3%
WAGE / INCOME GAP [ % ]
68.7¢/ $1
WAGE / INCOME GAP [ $ ]
0.42
INEQUALITY / GINI INDEX
1,278
TOTAL POPULATION
598
MALE POPULATION
680
FEMALE POPULATION
87.94
MALES / 100 FEMALES
113.71
FEMALES / 100 MALES
49.5
MEDIAN AGE
2.8
AVG FAMILY SIZE
2.5
AVG HOUSEHOLD SIZE
759
LABOR FORCE [ PEOPLE ]
66.0%
PERCENT IN LABOR FORCE
34.0%
UNEMPLOYMENT RATE
Income in Coal Fork
Income Overview in Coal Fork
Per Capita Income in Coal Fork is $30,044, while median incomes of families and households are $60,812 and $60,534 respectively.
| Characteristic | Number | Measure |
| Per Capita Income | 1,278 | $30,044 |
| Median Family Income | 381 | $60,812 |
| Mean Family Income | 381 | $71,424 |
| Median Household Income | 518 | $60,534 |
| Mean Household Income | 518 | $66,112 |
| Income Deficit | 381 | $0 |
| Wage / Income Gap (%) | 1,278 | 31.33% |
| Wage / Income Gap ($) | 1,278 | 68.67¢ per $1 |
| Gini / Inequality Index | 1,278 | 0.42 |
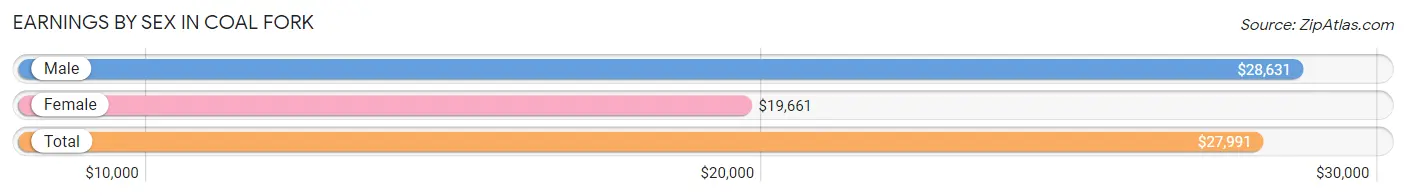
Earnings by Sex in Coal Fork
Average Earnings in Coal Fork are $27,991, $28,631 for men and $19,661 for women, a difference of 31.3%.
| Sex | Number | Average Earnings |
| Male | 447 (56.3%) | $28,631 |
| Female | 347 (43.7%) | $19,661 |
| Total | 794 (100.0%) | $27,991 |
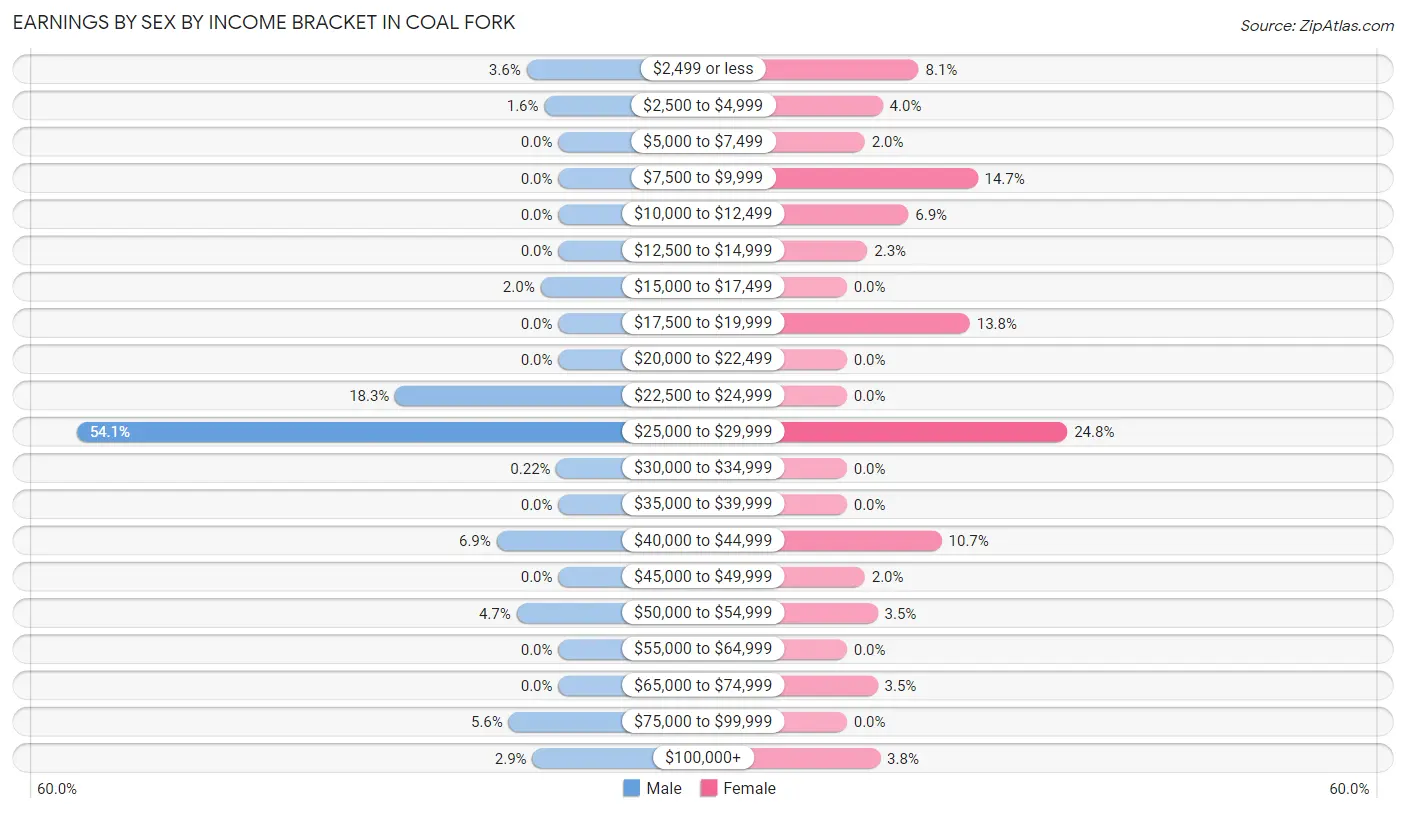
Earnings by Sex by Income Bracket in Coal Fork
The most common earnings brackets in Coal Fork are $25,000 to $29,999 for men (242 | 54.1%) and $25,000 to $29,999 for women (86 | 24.8%).
| Income | Male | Female |
| $2,499 or less | 16 (3.6%) | 28 (8.1%) |
| $2,500 to $4,999 | 7 (1.6%) | 14 (4.0%) |
| $5,000 to $7,499 | 0 (0.0%) | 7 (2.0%) |
| $7,500 to $9,999 | 0 (0.0%) | 51 (14.7%) |
| $10,000 to $12,499 | 0 (0.0%) | 24 (6.9%) |
| $12,500 to $14,999 | 0 (0.0%) | 8 (2.3%) |
| $15,000 to $17,499 | 9 (2.0%) | 0 (0.0%) |
| $17,500 to $19,999 | 0 (0.0%) | 48 (13.8%) |
| $20,000 to $22,499 | 0 (0.0%) | 0 (0.0%) |
| $22,500 to $24,999 | 82 (18.3%) | 0 (0.0%) |
| $25,000 to $29,999 | 242 (54.1%) | 86 (24.8%) |
| $30,000 to $34,999 | 1 (0.2%) | 0 (0.0%) |
| $35,000 to $39,999 | 0 (0.0%) | 0 (0.0%) |
| $40,000 to $44,999 | 31 (6.9%) | 37 (10.7%) |
| $45,000 to $49,999 | 0 (0.0%) | 7 (2.0%) |
| $50,000 to $54,999 | 21 (4.7%) | 12 (3.5%) |
| $55,000 to $64,999 | 0 (0.0%) | 0 (0.0%) |
| $65,000 to $74,999 | 0 (0.0%) | 12 (3.5%) |
| $75,000 to $99,999 | 25 (5.6%) | 0 (0.0%) |
| $100,000+ | 13 (2.9%) | 13 (3.7%) |
| Total | 447 (100.0%) | 347 (100.0%) |
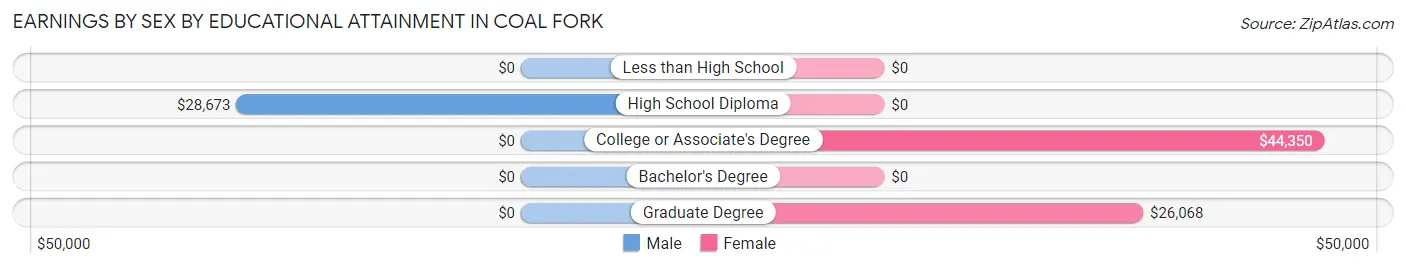
Earnings by Sex by Educational Attainment in Coal Fork
Average earnings in Coal Fork are $28,900 for men and $19,870 for women, a difference of 31.2%. Men with an educational attainment of high school diploma enjoy the highest average annual earnings of $28,673, while those with high school diploma education earn the least with $28,673. Women with an educational attainment of college or associate's degree earn the most with the average annual earnings of $44,350, while those with graduate degree education have the smallest earnings of $26,068.
| Educational Attainment | Male Income | Female Income |
| Less than High School | - | - |
| High School Diploma | $28,673 | $0 |
| College or Associate's Degree | - | - |
| Bachelor's Degree | - | - |
| Graduate Degree | - | - |
| Total | $28,900 | $19,870 |
Family Income in Coal Fork
Family Income Brackets in Coal Fork
According to the Coal Fork family income data, there are 143 families falling into the $50,000 to $74,999 income range, which is the most common income bracket and makes up 37.5% of all families.
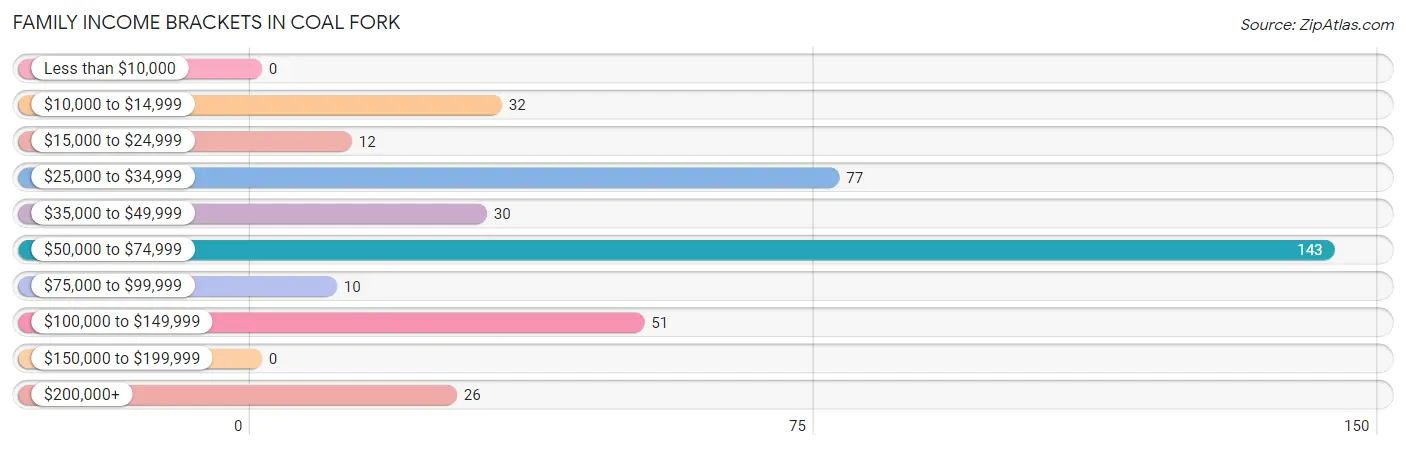
| Income Bracket | # Families | % Families |
| Less than $10,000 | 0 | 0.0% |
| $10,000 to $14,999 | 32 | 8.4% |
| $15,000 to $24,999 | 12 | 3.1% |
| $25,000 to $34,999 | 77 | 20.2% |
| $35,000 to $49,999 | 30 | 7.9% |
| $50,000 to $74,999 | 143 | 37.5% |
| $75,000 to $99,999 | 10 | 2.6% |
| $100,000 to $149,999 | 51 | 13.4% |
| $150,000 to $199,999 | 0 | 0.0% |
| $200,000+ | 26 | 6.8% |
Family Income by Famaliy Size in Coal Fork
3-person families (88 | 23.1%) account for the highest median family income in Coal Fork with $101,667 per family, while 3-person families (88 | 23.1%) have the highest median income of $33,889 per family member.
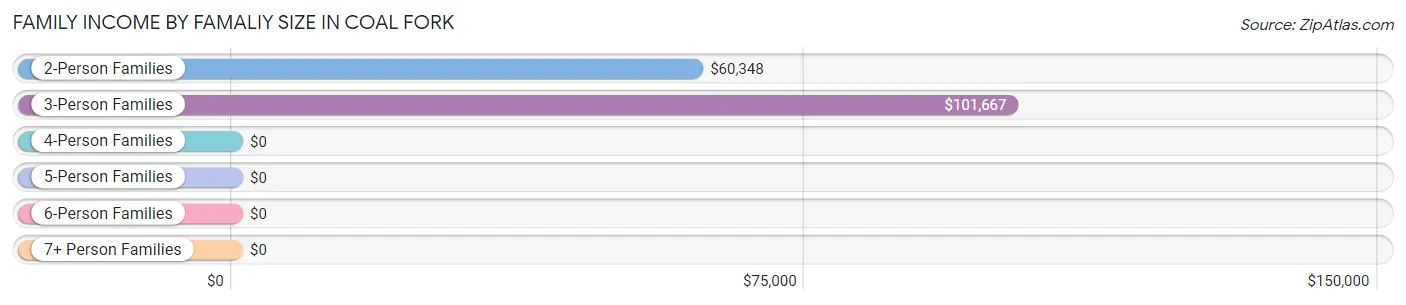
| Income Bracket | # Families | Median Income |
| 2-Person Families | 293 (76.9%) | $60,348 |
| 3-Person Families | 88 (23.1%) | $101,667 |
| 4-Person Families | 0 (0.0%) | $0 |
| 5-Person Families | 0 (0.0%) | $0 |
| 6-Person Families | 0 (0.0%) | $0 |
| 7+ Person Families | 0 (0.0%) | $0 |
| Total | 381 (100.0%) | $60,812 |
Family Income by Number of Earners in Coal Fork
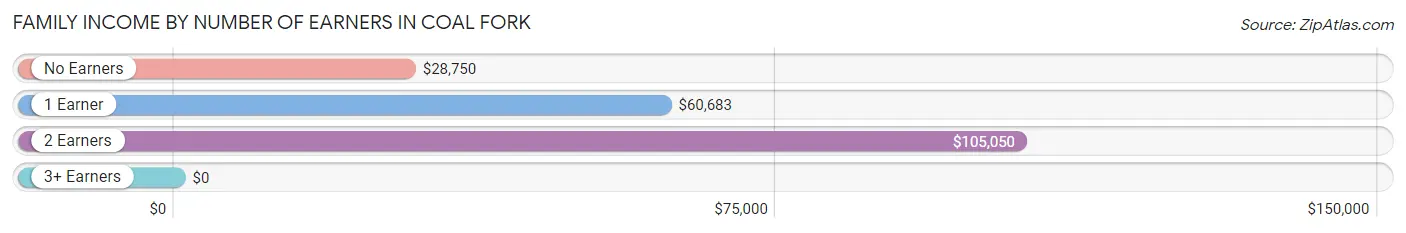
| Number of Earners | # Families | Median Income |
| No Earners | 43 (11.3%) | $28,750 |
| 1 Earner | 223 (58.5%) | $60,683 |
| 2 Earners | 101 (26.5%) | $105,050 |
| 3+ Earners | 14 (3.7%) | $0 |
| Total | 381 (100.0%) | $60,812 |
Household Income in Coal Fork
Household Income Brackets in Coal Fork
With 165 households falling in the category, the $50,000 to $74,999 income range is the most frequent in Coal Fork, accounting for 31.9% of all households.
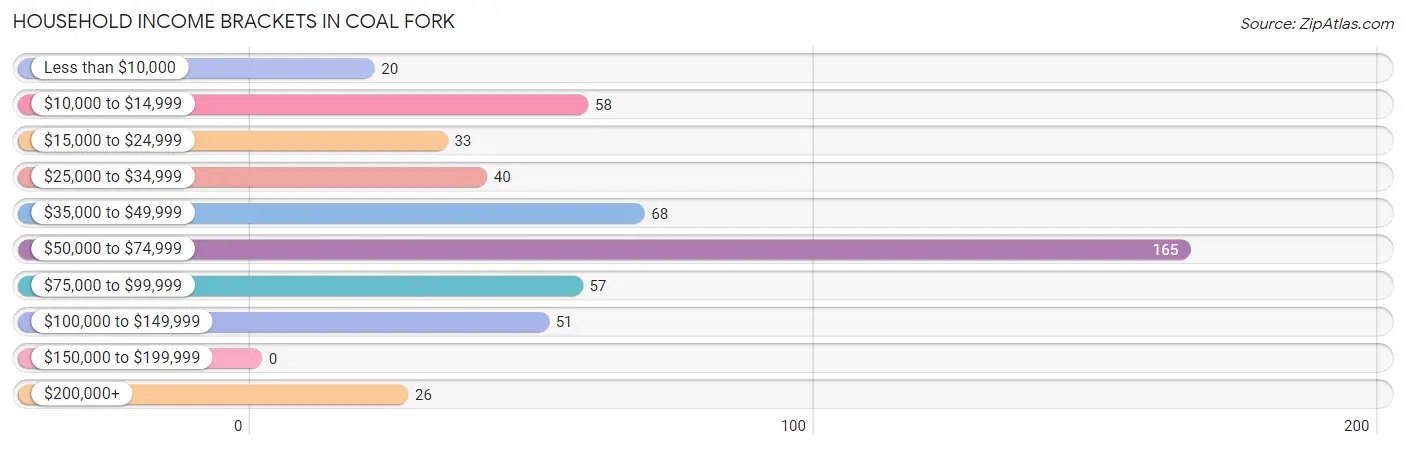
| Income Bracket | # Households | % Households |
| Less than $10,000 | 20 | 3.9% |
| $10,000 to $14,999 | 58 | 11.2% |
| $15,000 to $24,999 | 33 | 6.4% |
| $25,000 to $34,999 | 40 | 7.7% |
| $35,000 to $49,999 | 68 | 13.1% |
| $50,000 to $74,999 | 165 | 31.9% |
| $75,000 to $99,999 | 57 | 11.0% |
| $100,000 to $149,999 | 51 | 9.8% |
| $150,000 to $199,999 | 0 | 0.0% |
| $200,000+ | 26 | 5.0% |
Household Income by Householder Age in Coal Fork
The median household income in Coal Fork is $60,534, with the highest median household income of $74,115 found in the 45 to 64 years age bracket for the primary householder. A total of 181 households (34.9%) fall into this category.
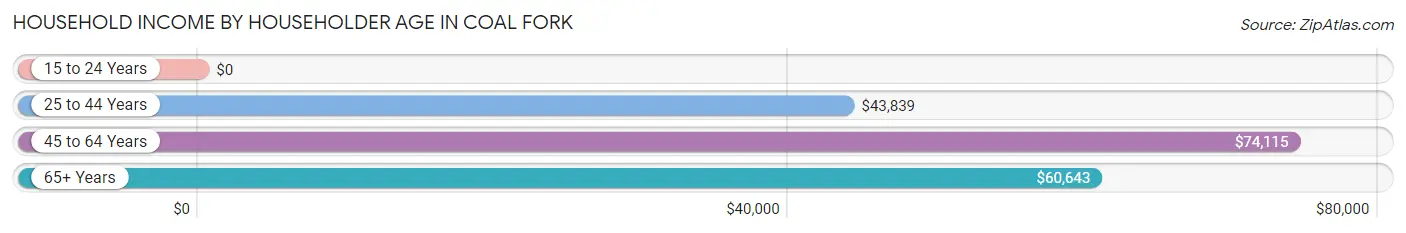
| Income Bracket | # Households | Median Income |
| 15 to 24 Years | 0 (0.0%) | $0 |
| 25 to 44 Years | 116 (22.4%) | $43,839 |
| 45 to 64 Years | 181 (34.9%) | $74,115 |
| 65+ Years | 221 (42.7%) | $60,643 |
| Total | 518 (100.0%) | $60,534 |
Poverty in Coal Fork
Income Below Poverty by Sex and Age in Coal Fork
With 13.0% poverty level for males and 7.3% for females among the residents of Coal Fork, 35 to 44 year old males and 12 to 14 year old females are the most vulnerable to poverty, with 20 males (100.0%) and 7 females (100.0%) in their respective age groups living below the poverty level.
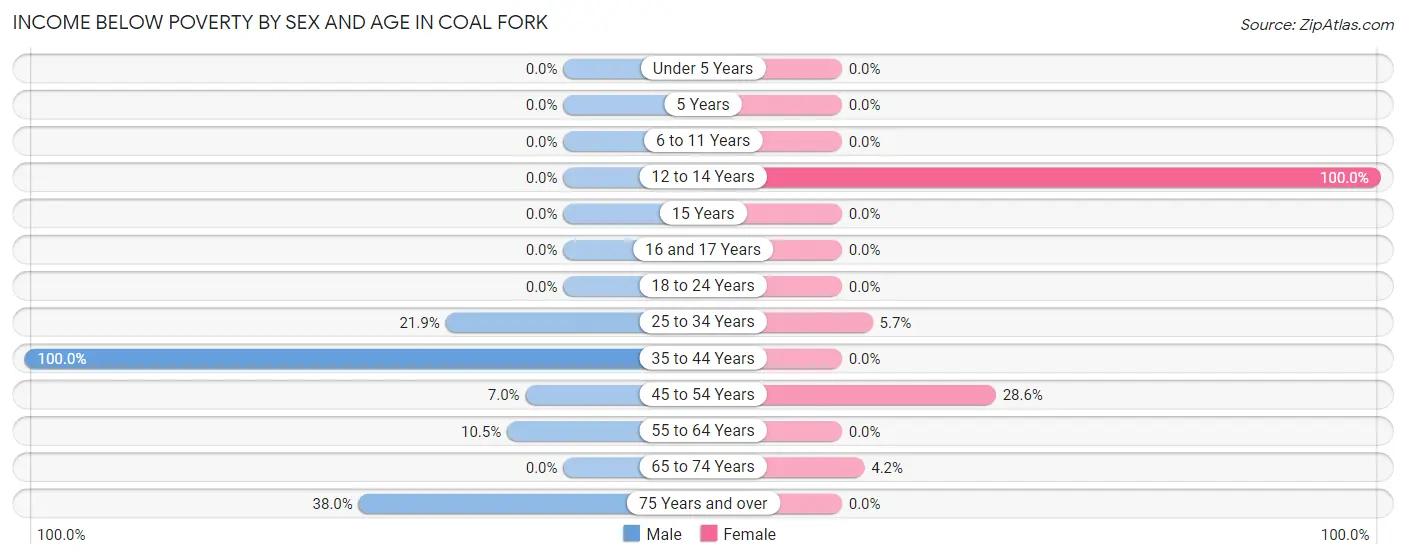
| Age Bracket | Male | Female |
| Under 5 Years | 0 (0.0%) | 0 (0.0%) |
| 5 Years | 0 (0.0%) | 0 (0.0%) |
| 6 to 11 Years | 0 (0.0%) | 0 (0.0%) |
| 12 to 14 Years | 0 (0.0%) | 7 (100.0%) |
| 15 Years | 0 (0.0%) | 0 (0.0%) |
| 16 and 17 Years | 0 (0.0%) | 0 (0.0%) |
| 18 to 24 Years | 0 (0.0%) | 0 (0.0%) |
| 25 to 34 Years | 7 (21.9%) | 8 (5.7%) |
| 35 to 44 Years | 20 (100.0%) | 0 (0.0%) |
| 45 to 54 Years | 25 (7.0%) | 28 (28.6%) |
| 55 to 64 Years | 7 (10.4%) | 0 (0.0%) |
| 65 to 74 Years | 0 (0.0%) | 7 (4.2%) |
| 75 Years and over | 19 (38.0%) | 0 (0.0%) |
| Total | 78 (13.0%) | 50 (7.3%) |
Income Above Poverty by Sex and Age in Coal Fork
According to the poverty statistics in Coal Fork, males aged 6 to 11 years and females aged under 5 years are the age groups that are most secure financially, with 100.0% of males and 100.0% of females in these age groups living above the poverty line.
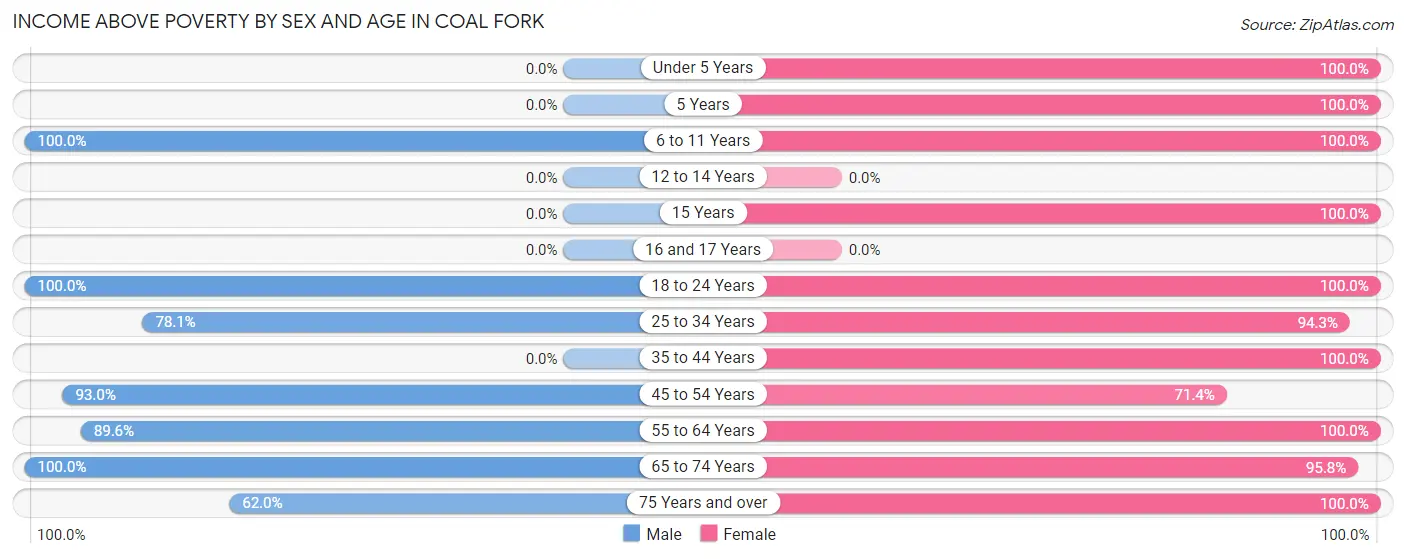
| Age Bracket | Male | Female |
| Under 5 Years | 0 (0.0%) | 22 (100.0%) |
| 5 Years | 0 (0.0%) | 55 (100.0%) |
| 6 to 11 Years | 16 (100.0%) | 17 (100.0%) |
| 12 to 14 Years | 0 (0.0%) | 0 (0.0%) |
| 15 Years | 0 (0.0%) | 11 (100.0%) |
| 16 and 17 Years | 0 (0.0%) | 0 (0.0%) |
| 18 to 24 Years | 52 (100.0%) | 24 (100.0%) |
| 25 to 34 Years | 25 (78.1%) | 132 (94.3%) |
| 35 to 44 Years | 0 (0.0%) | 7 (100.0%) |
| 45 to 54 Years | 330 (93.0%) | 70 (71.4%) |
| 55 to 64 Years | 60 (89.5%) | 83 (100.0%) |
| 65 to 74 Years | 6 (100.0%) | 161 (95.8%) |
| 75 Years and over | 31 (62.0%) | 48 (100.0%) |
| Total | 520 (87.0%) | 630 (92.6%) |
Income Below Poverty Among Married-Couple Families in Coal Fork
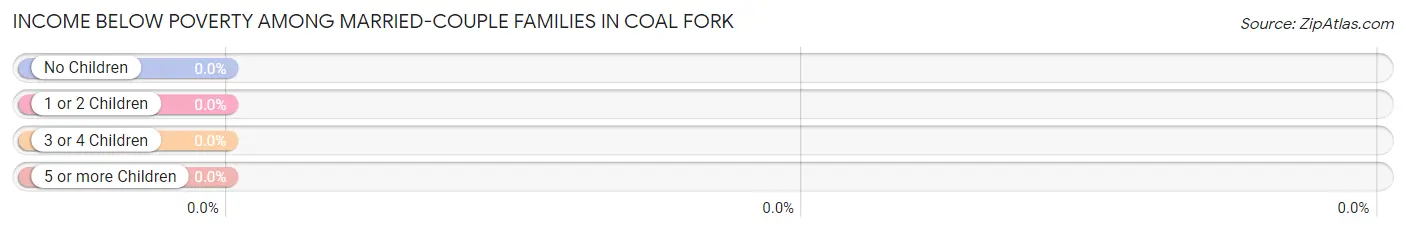
| Children | Above Poverty | Below Poverty |
| No Children | 66 (100.0%) | 0 (0.0%) |
| 1 or 2 Children | 25 (100.0%) | 0 (0.0%) |
| 3 or 4 Children | 0 (0.0%) | 0 (0.0%) |
| 5 or more Children | 0 (0.0%) | 0 (0.0%) |
| Total | 91 (100.0%) | 0 (0.0%) |
Income Below Poverty Among Single-Parent Households in Coal Fork
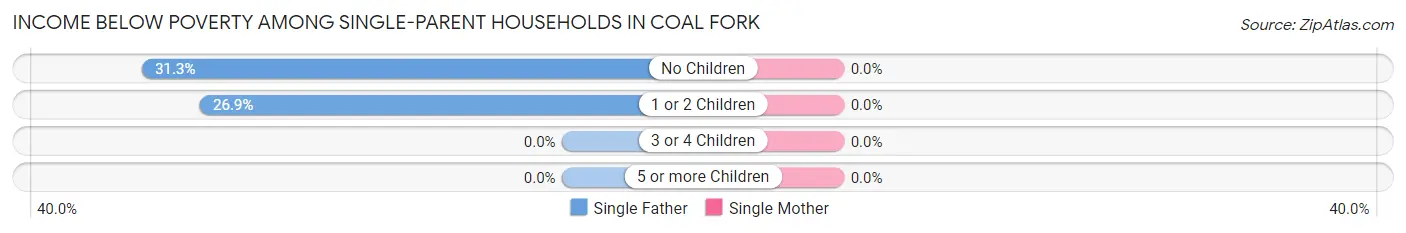
| Children | Single Father | Single Mother |
| No Children | 25 (31.2%) | 0 (0.0%) |
| 1 or 2 Children | 7 (26.9%) | 0 (0.0%) |
| 3 or 4 Children | 0 (0.0%) | 0 (0.0%) |
| 5 or more Children | 0 (0.0%) | 0 (0.0%) |
| Total | 32 (30.2%) | 0 (0.0%) |
Income Below Poverty Among Married-Couple vs Single-Parent Households in Coal Fork
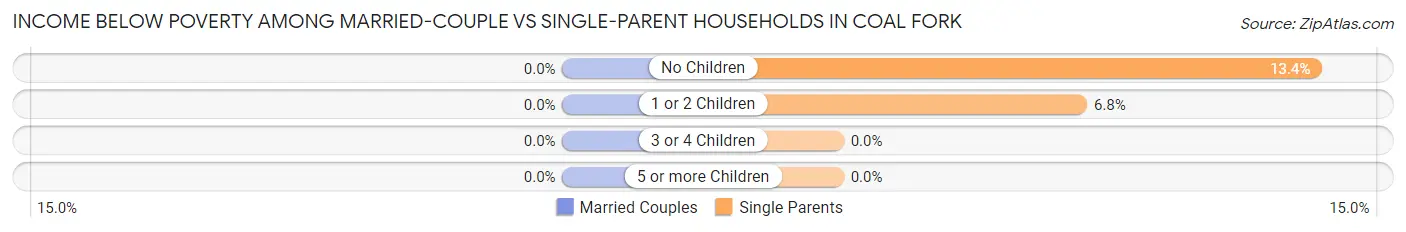
| Children | Married-Couple Families | Single-Parent Households |
| No Children | 0 (0.0%) | 25 (13.4%) |
| 1 or 2 Children | 0 (0.0%) | 7 (6.8%) |
| 3 or 4 Children | 0 (0.0%) | 0 (0.0%) |
| 5 or more Children | 0 (0.0%) | 0 (0.0%) |
| Total | 0 (0.0%) | 32 (11.0%) |
Race in Coal Fork
The most populous races in Coal Fork are White / Caucasian (1,192 | 93.3%), Two or more Races (84 | 6.6%), and Hispanic or Latino (76 | 5.9%).
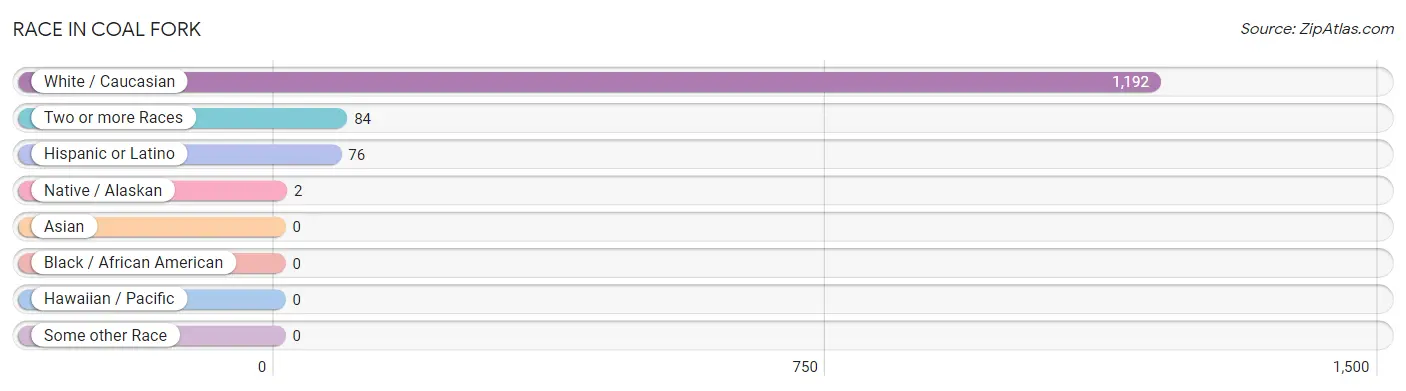
| Race | # Population | % Population |
| Asian | 0 | 0.0% |
| Black / African American | 0 | 0.0% |
| Hawaiian / Pacific | 0 | 0.0% |
| Hispanic or Latino | 76 | 5.9% |
| Native / Alaskan | 2 | 0.2% |
| White / Caucasian | 1,192 | 93.3% |
| Two or more Races | 84 | 6.6% |
| Some other Race | 0 | 0.0% |
| Total | 1,278 | 100.0% |
Ancestry in Coal Fork
The most populous ancestries reported in Coal Fork are English (155 | 12.1%), German (139 | 10.9%), Irish (94 | 7.4%), Mexican (76 | 5.9%), and American (68 | 5.3%), together accounting for 41.6% of all Coal Fork residents.
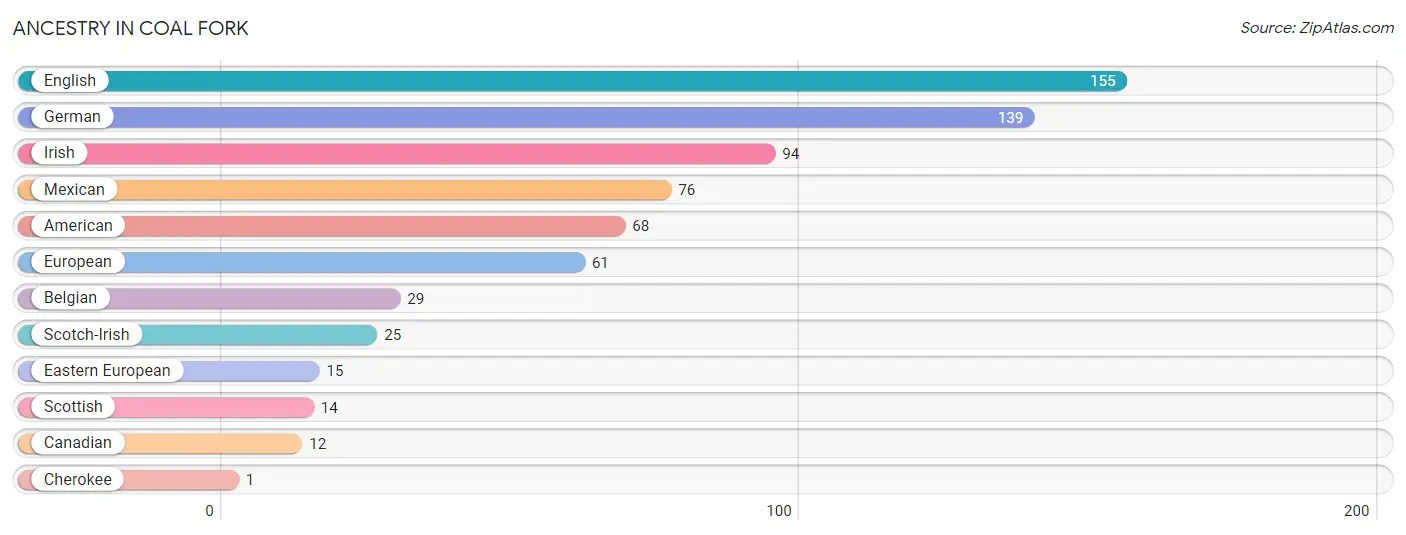
| Ancestry | # Population | % Population |
| American | 68 | 5.3% |
| Belgian | 29 | 2.3% |
| Canadian | 12 | 0.9% |
| Cherokee | 1 | 0.1% |
| Eastern European | 15 | 1.2% |
| English | 155 | 12.1% |
| European | 61 | 4.8% |
| German | 139 | 10.9% |
| Irish | 94 | 7.4% |
| Mexican | 76 | 5.9% |
| Scotch-Irish | 25 | 2.0% |
| Scottish | 14 | 1.1% | View All 12 Rows |
Immigrants in Coal Fork

| Immigration Origin | # Population | % Population | View All 0 Rows |
Sex and Age in Coal Fork
Sex and Age in Coal Fork
The most populous age groups in Coal Fork are 45 to 49 Years (281 | 47.0%) for men and 70 to 74 Years (161 | 23.7%) for women.
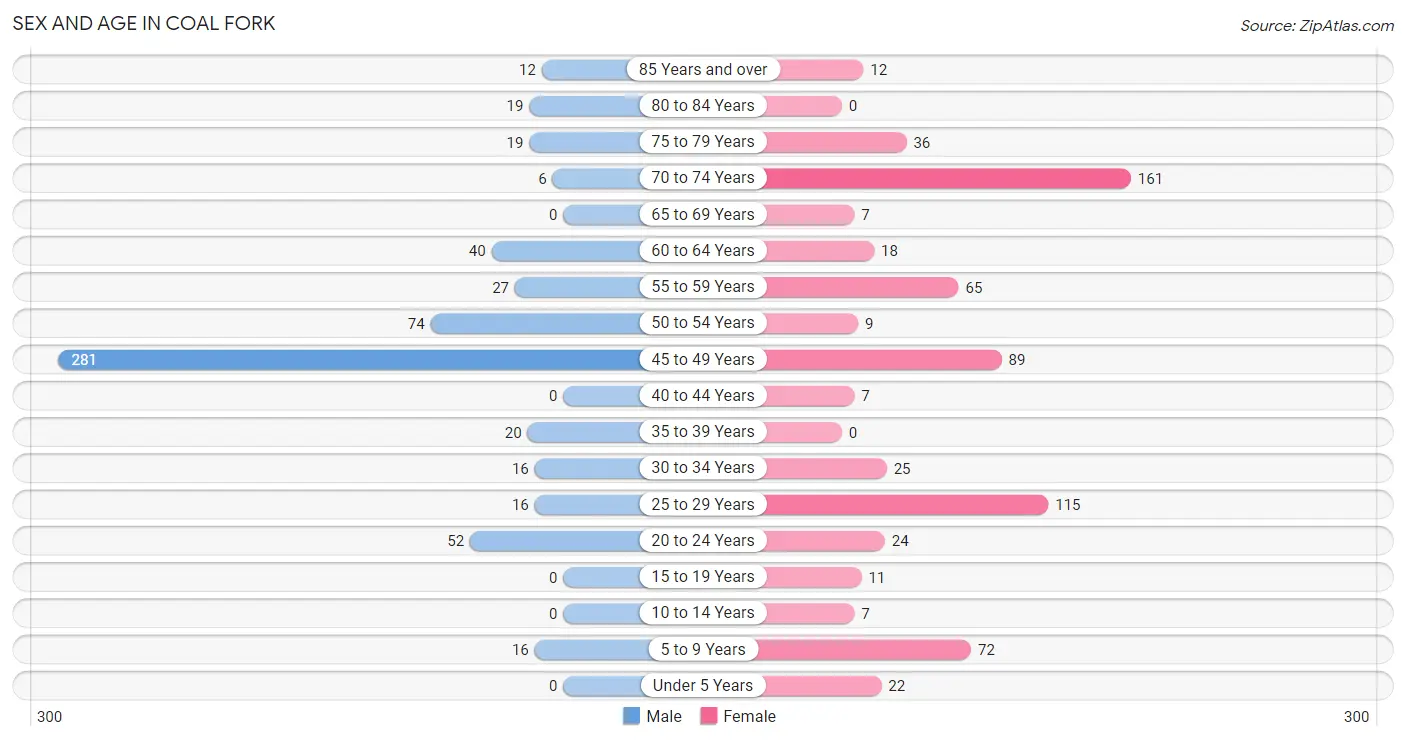
| Age Bracket | Male | Female |
| Under 5 Years | 0 (0.0%) | 22 (3.2%) |
| 5 to 9 Years | 16 (2.7%) | 72 (10.6%) |
| 10 to 14 Years | 0 (0.0%) | 7 (1.0%) |
| 15 to 19 Years | 0 (0.0%) | 11 (1.6%) |
| 20 to 24 Years | 52 (8.7%) | 24 (3.5%) |
| 25 to 29 Years | 16 (2.7%) | 115 (16.9%) |
| 30 to 34 Years | 16 (2.7%) | 25 (3.7%) |
| 35 to 39 Years | 20 (3.3%) | 0 (0.0%) |
| 40 to 44 Years | 0 (0.0%) | 7 (1.0%) |
| 45 to 49 Years | 281 (47.0%) | 89 (13.1%) |
| 50 to 54 Years | 74 (12.4%) | 9 (1.3%) |
| 55 to 59 Years | 27 (4.5%) | 65 (9.6%) |
| 60 to 64 Years | 40 (6.7%) | 18 (2.6%) |
| 65 to 69 Years | 0 (0.0%) | 7 (1.0%) |
| 70 to 74 Years | 6 (1.0%) | 161 (23.7%) |
| 75 to 79 Years | 19 (3.2%) | 36 (5.3%) |
| 80 to 84 Years | 19 (3.2%) | 0 (0.0%) |
| 85 Years and over | 12 (2.0%) | 12 (1.8%) |
| Total | 598 (100.0%) | 680 (100.0%) |
Families and Households in Coal Fork
Median Family Size in Coal Fork
The median family size in Coal Fork is 2.79 persons per family, with married-couple families (91 | 23.9%) accounting for the largest median family size of 3.12 persons per family. On the other hand, single male/father families (106 | 27.8%) represent the smallest median family size with 2.54 persons per family.
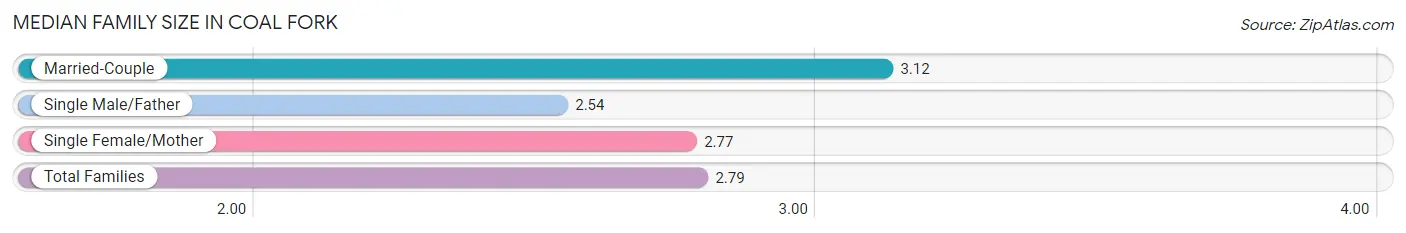
| Family Type | # Families | Family Size |
| Married-Couple | 91 (23.9%) | 3.12 |
| Single Male/Father | 106 (27.8%) | 2.54 |
| Single Female/Mother | 184 (48.3%) | 2.77 |
| Total Families | 381 (100.0%) | 2.79 |
Median Household Size in Coal Fork
The median household size in Coal Fork is 2.47 persons per household, with married-couple households (91 | 17.6%) accounting for the largest median household size of 3.12 persons per household. non-family households (137 | 26.5%) represent the smallest median household size with 1.19 persons per household.
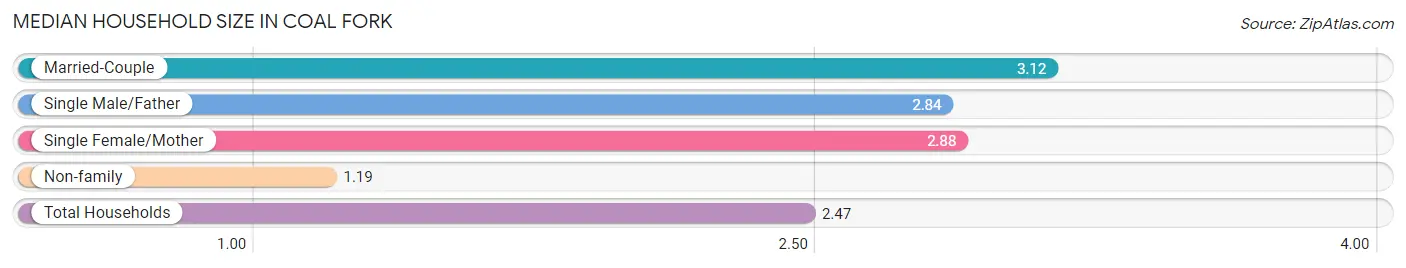
| Household Type | # Households | Household Size |
| Married-Couple | 91 (17.6%) | 3.12 |
| Single Male/Father | 106 (20.5%) | 2.84 |
| Single Female/Mother | 184 (35.5%) | 2.88 |
| Non-family | 137 (26.5%) | 1.19 |
| Total Households | 518 (100.0%) | 2.47 |
Household Size by Marriage Status in Coal Fork
Out of a total of 518 households in Coal Fork, 381 (73.6%) are family households, while 137 (26.5%) are nonfamily households. The most numerous type of family households are 3-person households, comprising 194, and the most common type of nonfamily households are 1-person households, comprising 112.
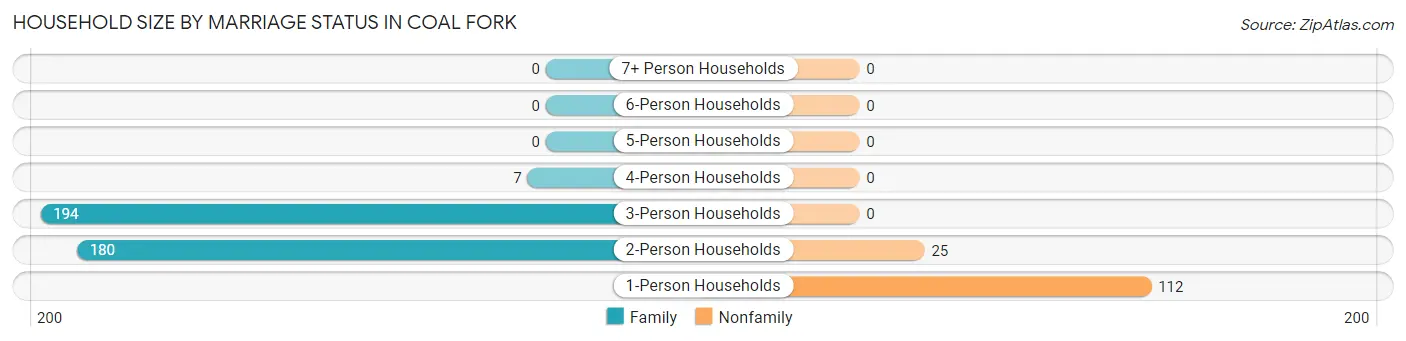
| Household Size | Family Households | Nonfamily Households |
| 1-Person Households | - | 112 (21.6%) |
| 2-Person Households | 180 (34.7%) | 25 (4.8%) |
| 3-Person Households | 194 (37.4%) | 0 (0.0%) |
| 4-Person Households | 7 (1.3%) | 0 (0.0%) |
| 5-Person Households | 0 (0.0%) | 0 (0.0%) |
| 6-Person Households | 0 (0.0%) | 0 (0.0%) |
| 7+ Person Households | 0 (0.0%) | 0 (0.0%) |
| Total | 381 (73.6%) | 137 (26.5%) |
Female Fertility in Coal Fork
Fertility by Age in Coal Fork
Average fertility rate in Coal Fork is 44.0 births per 1,000 women. Women in the age bracket of 35 to 50 years have the highest fertility rate with 125.0 births per 1,000 women. Women in the age bracket of 35 to 50 years acount for 100.0% of all women with births.
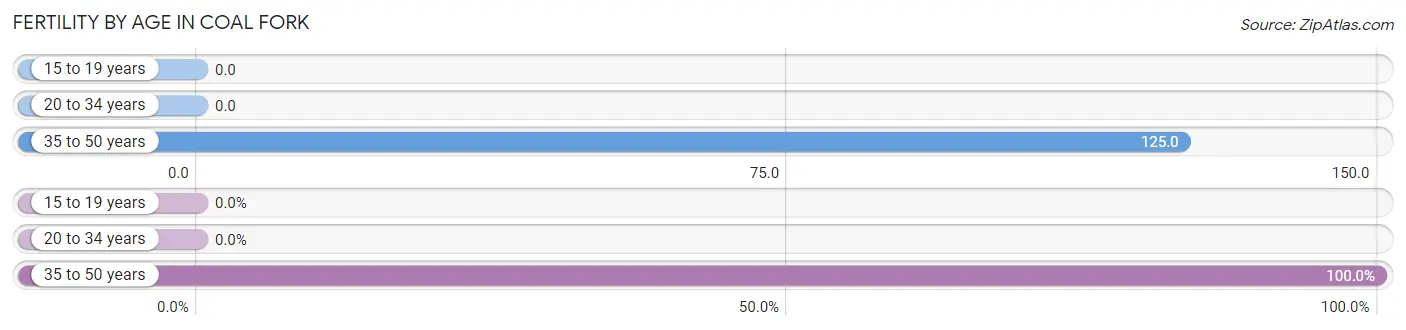
| Age Bracket | Women with Births | Births / 1,000 Women |
| 15 to 19 years | 0 (0.0%) | 0.0 |
| 20 to 34 years | 0 (0.0%) | 0.0 |
| 35 to 50 years | 12 (100.0%) | 125.0 |
| Total | 12 (100.0%) | 44.0 |
Fertility by Age by Marriage Status in Coal Fork
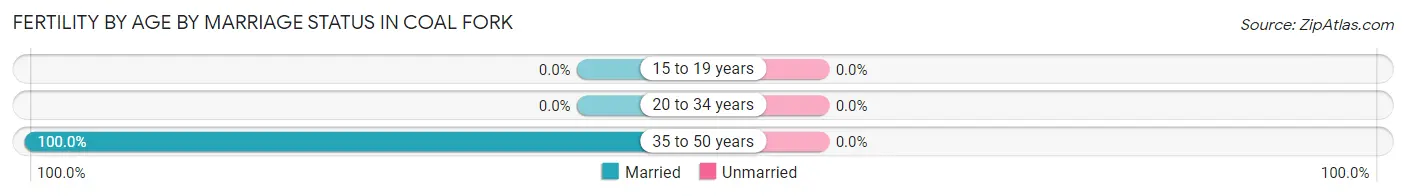
| Age Bracket | Married | Unmarried |
| 15 to 19 years | 0 (0.0%) | 0 (0.0%) |
| 20 to 34 years | 0 (0.0%) | 0 (0.0%) |
| 35 to 50 years | 12 (100.0%) | 0 (0.0%) |
| Total | 12 (100.0%) | 0 (0.0%) |
Fertility by Education in Coal Fork
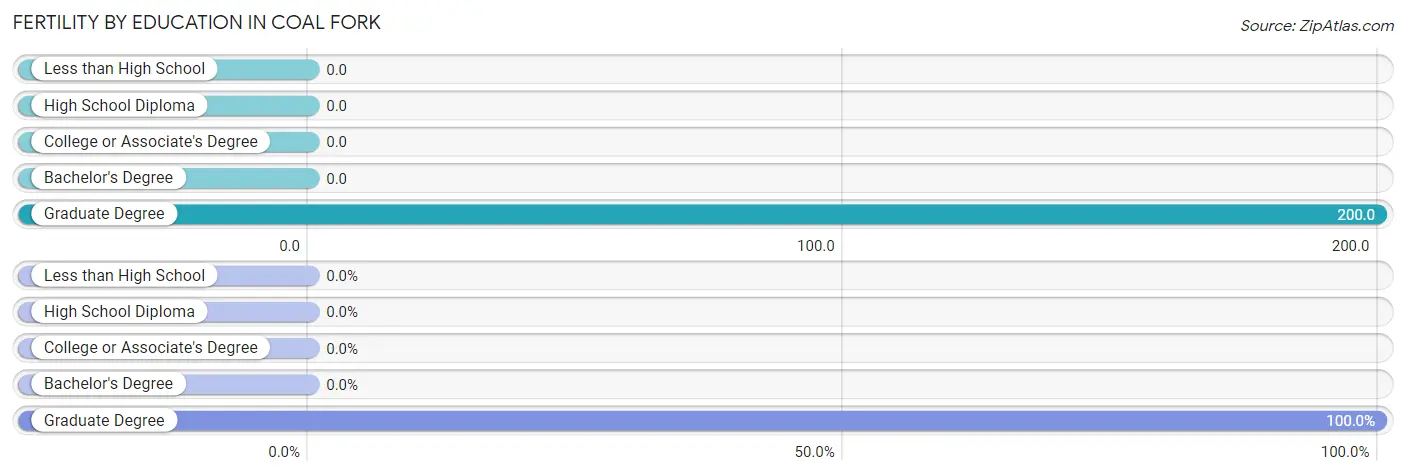
| Educational Attainment | Women with Births | Births / 1,000 Women |
| Less than High School | 0 (0.0%) | 0.0 |
| High School Diploma | 0 (0.0%) | 0.0 |
| College or Associate's Degree | 0 (0.0%) | 0.0 |
| Bachelor's Degree | 0 (0.0%) | 0.0 |
| Graduate Degree | 12 (100.0%) | 200.0 |
| Total | 12 (100.0%) | 44.0 |
Fertility by Education by Marriage Status in Coal Fork
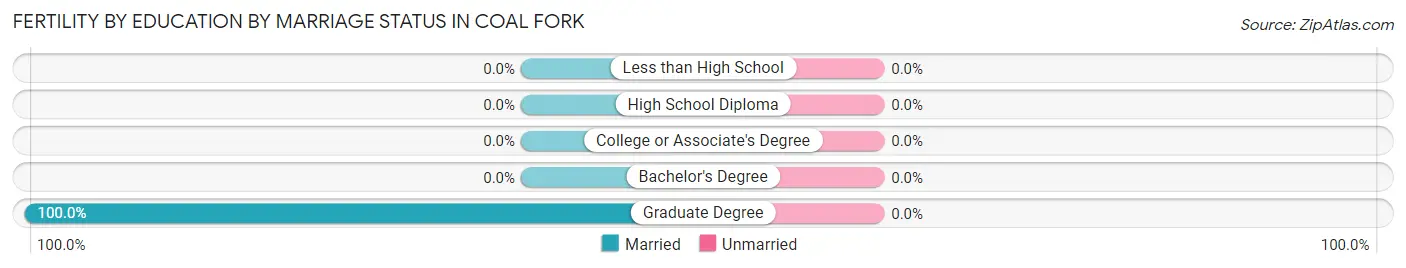
| Educational Attainment | Married | Unmarried |
| Less than High School | 0 (0.0%) | 0 (0.0%) |
| High School Diploma | 0 (0.0%) | 0 (0.0%) |
| College or Associate's Degree | 0 (0.0%) | 0 (0.0%) |
| Bachelor's Degree | 0 (0.0%) | 0 (0.0%) |
| Graduate Degree | 12 (100.0%) | 0 (0.0%) |
| Total | 12 (100.0%) | 0 (0.0%) |
Employment Characteristics in Coal Fork
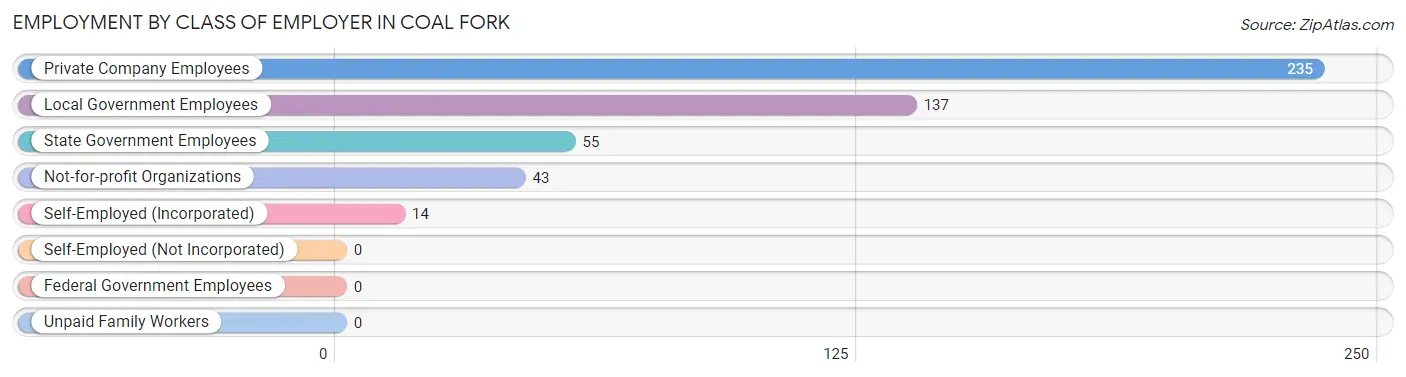
Employment by Class of Employer in Coal Fork
Among the 484 employed individuals in Coal Fork, private company employees (235 | 48.5%), local government employees (137 | 28.3%), and state government employees (55 | 11.4%) make up the most common classes of employment.
| Employer Class | # Employees | % Employees |
| Private Company Employees | 235 | 48.5% |
| Self-Employed (Incorporated) | 14 | 2.9% |
| Self-Employed (Not Incorporated) | 0 | 0.0% |
| Not-for-profit Organizations | 43 | 8.9% |
| Local Government Employees | 137 | 28.3% |
| State Government Employees | 55 | 11.4% |
| Federal Government Employees | 0 | 0.0% |
| Unpaid Family Workers | 0 | 0.0% |
| Total | 484 | 100.0% |
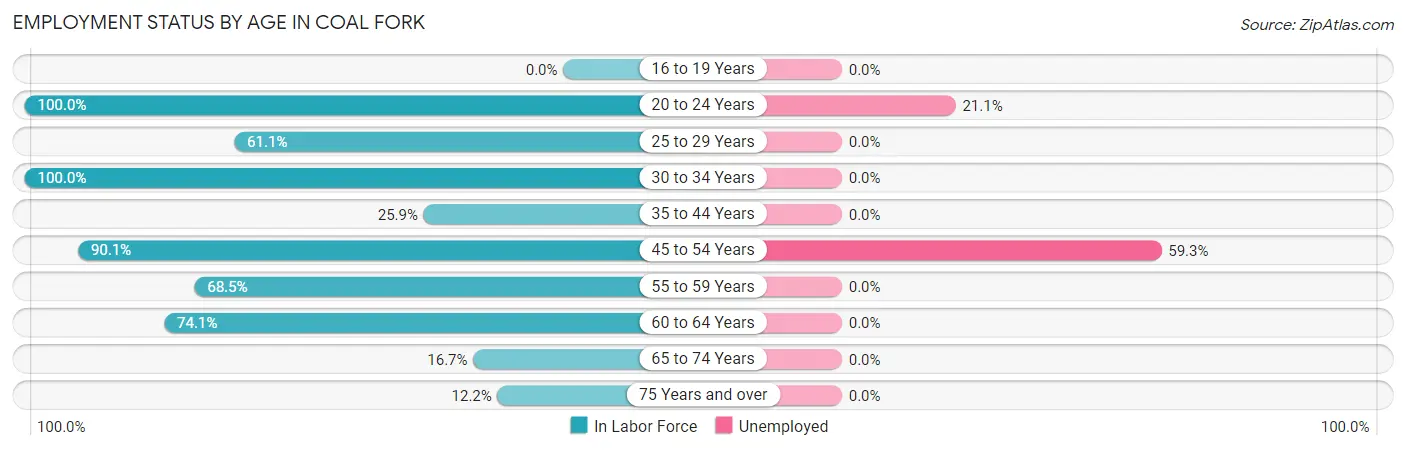
Employment Status by Age in Coal Fork
According to the labor force statistics for Coal Fork, out of the total population over 16 years of age (1,150), 66.0% or 759 individuals are in the labor force, with 34.0% or 258 of them unemployed. The age group with the highest labor force participation rate is 20 to 24 years, with 100.0% or 76 individuals in the labor force. Within the labor force, the 45 to 54 years age range has the highest percentage of unemployed individuals, with 59.3% or 242 of them being unemployed.
| Age Bracket | In Labor Force | Unemployed |
| 16 to 19 Years | 0 (0.0%) | 0 (0.0%) |
| 20 to 24 Years | 76 (100.0%) | 16 (21.1%) |
| 25 to 29 Years | 80 (61.1%) | 0 (0.0%) |
| 30 to 34 Years | 41 (100.0%) | 0 (0.0%) |
| 35 to 44 Years | 7 (25.9%) | 0 (0.0%) |
| 45 to 54 Years | 408 (90.1%) | 242 (59.3%) |
| 55 to 59 Years | 63 (68.5%) | 0 (0.0%) |
| 60 to 64 Years | 43 (74.1%) | 0 (0.0%) |
| 65 to 74 Years | 29 (16.7%) | 0 (0.0%) |
| 75 Years and over | 12 (12.2%) | 0 (0.0%) |
| Total | 759 (66.0%) | 258 (34.0%) |
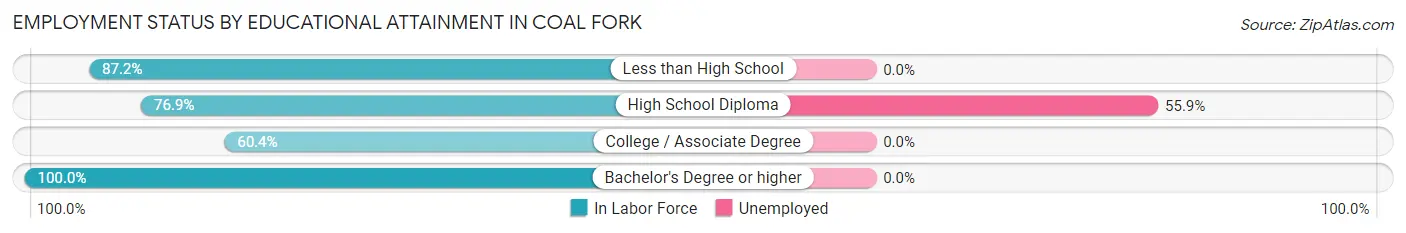
Employment Status by Educational Attainment in Coal Fork
According to labor force statistics for Coal Fork, 80.0% of individuals (642) out of the total population between 25 and 64 years of age (802) are in the labor force, with 37.7% or 242 of them being unemployed. The group with the highest labor force participation rate are those with the educational attainment of bachelor's degree or higher, with 100.0% or 105 individuals in the labor force. Within the labor force, individuals with high school diploma education have the highest percentage of unemployment, with 55.9% or 242 of them being unemployed.
| Educational Attainment | In Labor Force | Unemployed |
| Less than High School | 75 (87.2%) | 0 (0.0%) |
| High School Diploma | 433 (76.9%) | 315 (55.9%) |
| College / Associate Degree | 29 (60.4%) | 0 (0.0%) |
| Bachelor's Degree or higher | 105 (100.0%) | 0 (0.0%) |
| Total | 642 (80.0%) | 302 (37.7%) |
Employment Occupations by Sex in Coal Fork
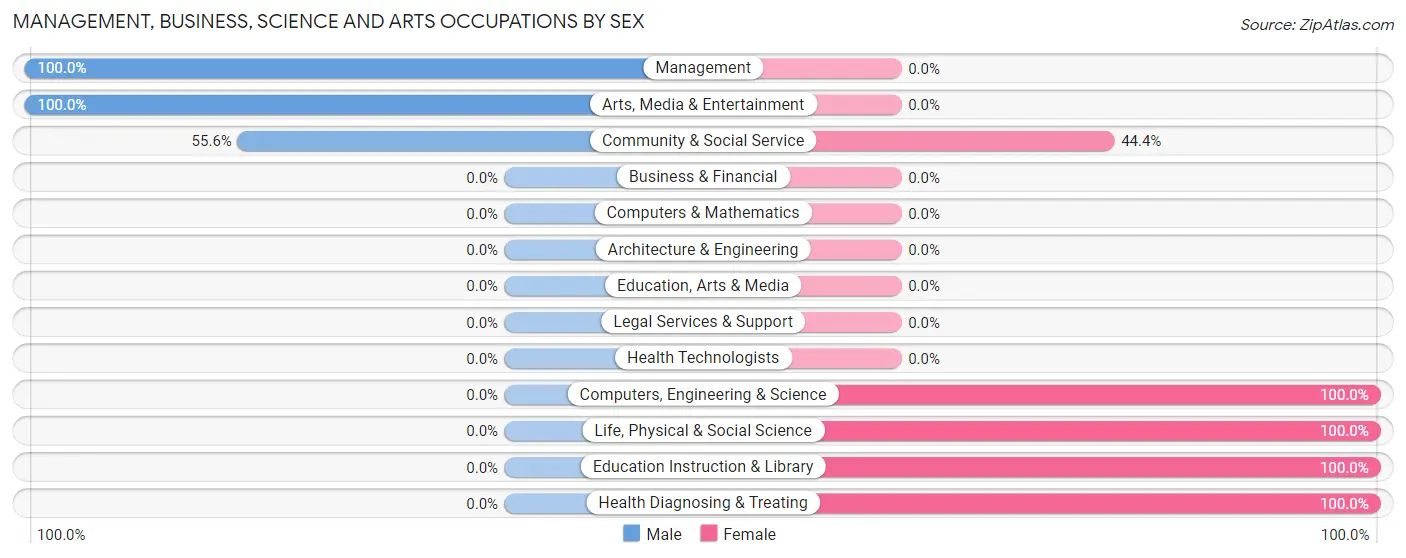
Management, Business, Science and Arts Occupations
The most common Management, Business, Science and Arts occupations in Coal Fork are Community & Social Service (45 | 9.0%), Arts, Media & Entertainment (25 | 5.0%), Education Instruction & Library (20 | 4.0%), Health Diagnosing & Treating (15 | 3.0%), and Management (13 | 2.6%).
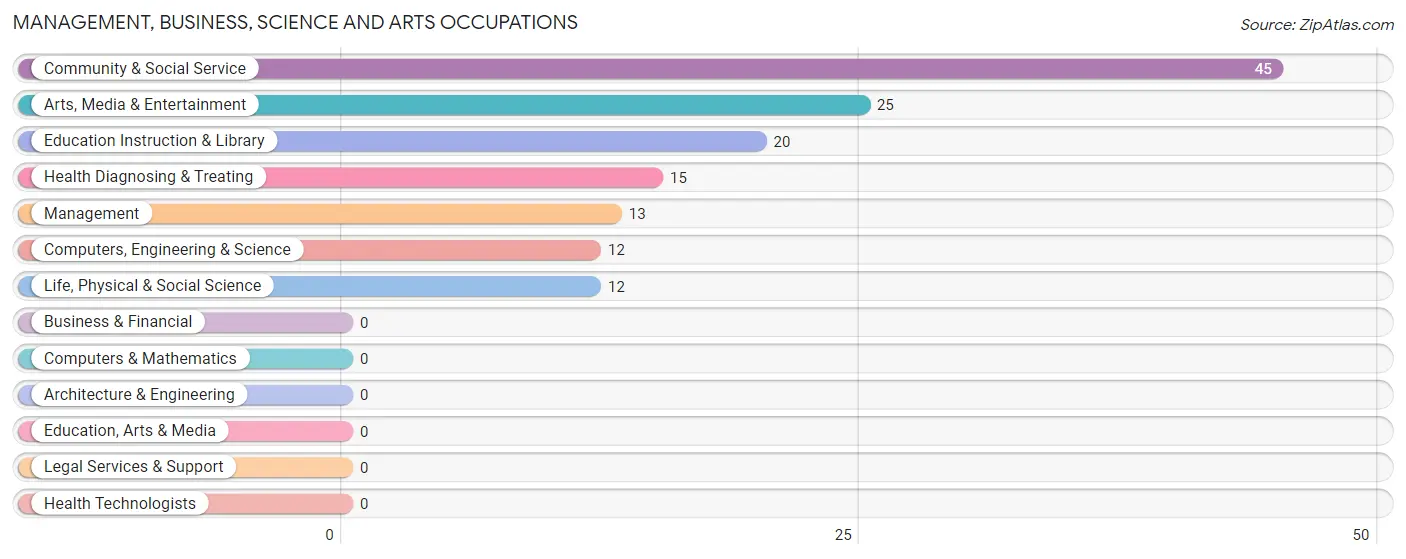
Management, Business, Science and Arts Occupations by Sex
Within the Management, Business, Science and Arts occupations in Coal Fork, the most male-oriented occupations are Management (100.0%), Arts, Media & Entertainment (100.0%), and Community & Social Service (55.6%), while the most female-oriented occupations are Computers, Engineering & Science (100.0%), Life, Physical & Social Science (100.0%), and Education Instruction & Library (100.0%).
| Occupation | Male | Female |
| Management | 13 (100.0%) | 0 (0.0%) |
| Business & Financial | 0 (0.0%) | 0 (0.0%) |
| Computers, Engineering & Science | 0 (0.0%) | 12 (100.0%) |
| Computers & Mathematics | 0 (0.0%) | 0 (0.0%) |
| Architecture & Engineering | 0 (0.0%) | 0 (0.0%) |
| Life, Physical & Social Science | 0 (0.0%) | 12 (100.0%) |
| Community & Social Service | 25 (55.6%) | 20 (44.4%) |
| Education, Arts & Media | 0 (0.0%) | 0 (0.0%) |
| Legal Services & Support | 0 (0.0%) | 0 (0.0%) |
| Education Instruction & Library | 0 (0.0%) | 20 (100.0%) |
| Arts, Media & Entertainment | 25 (100.0%) | 0 (0.0%) |
| Health Diagnosing & Treating | 0 (0.0%) | 15 (100.0%) |
| Health Technologists | 0 (0.0%) | 0 (0.0%) |
| Total (Category) | 38 (44.7%) | 47 (55.3%) |
| Total (Overall) | 205 (40.9%) | 296 (59.1%) |
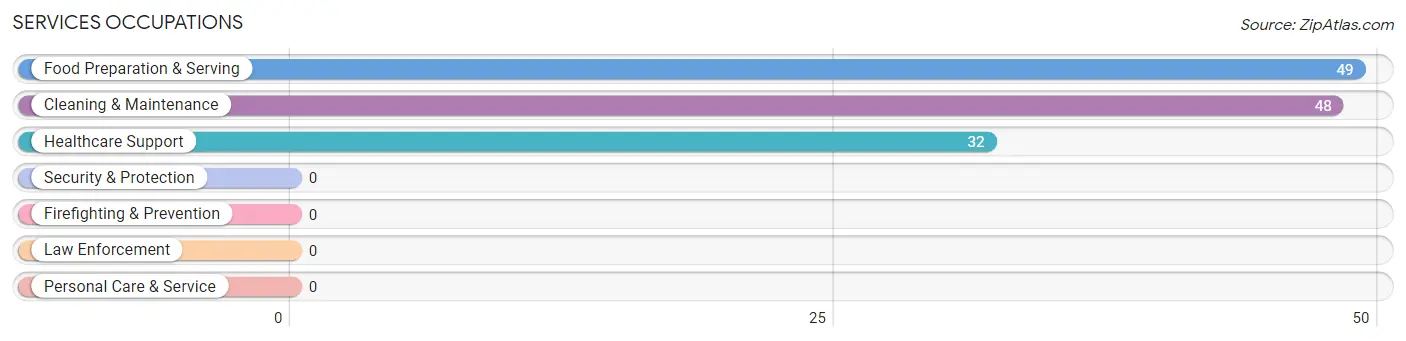
Services Occupations
The most common Services occupations in Coal Fork are Food Preparation & Serving (49 | 9.8%), Cleaning & Maintenance (48 | 9.6%), and Healthcare Support (32 | 6.4%).
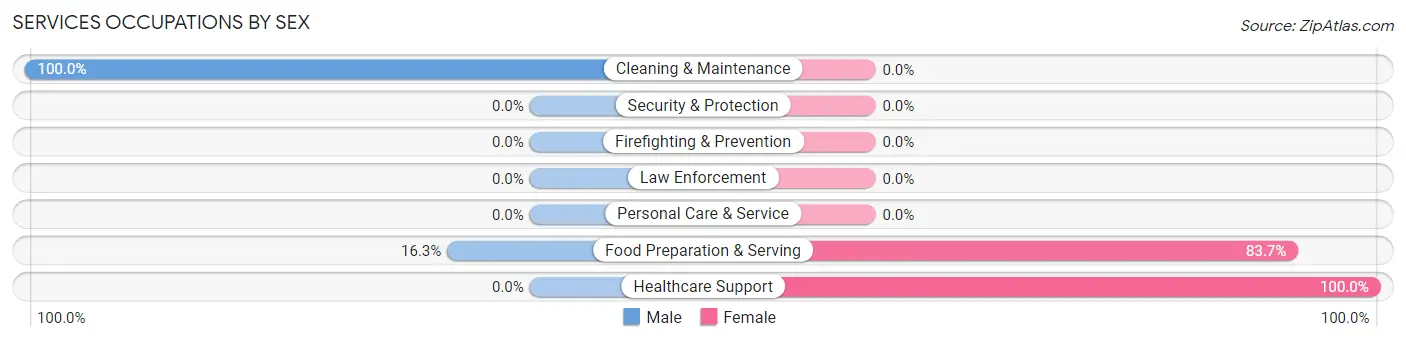
Services Occupations by Sex
Within the Services occupations in Coal Fork, the most male-oriented occupations are Cleaning & Maintenance (100.0%), and Food Preparation & Serving (16.3%), while the most female-oriented occupations are Healthcare Support (100.0%), and Food Preparation & Serving (83.7%).
| Occupation | Male | Female |
| Healthcare Support | 0 (0.0%) | 32 (100.0%) |
| Security & Protection | 0 (0.0%) | 0 (0.0%) |
| Firefighting & Prevention | 0 (0.0%) | 0 (0.0%) |
| Law Enforcement | 0 (0.0%) | 0 (0.0%) |
| Food Preparation & Serving | 8 (16.3%) | 41 (83.7%) |
| Cleaning & Maintenance | 48 (100.0%) | 0 (0.0%) |
| Personal Care & Service | 0 (0.0%) | 0 (0.0%) |
| Total (Category) | 56 (43.4%) | 73 (56.6%) |
| Total (Overall) | 205 (40.9%) | 296 (59.1%) |
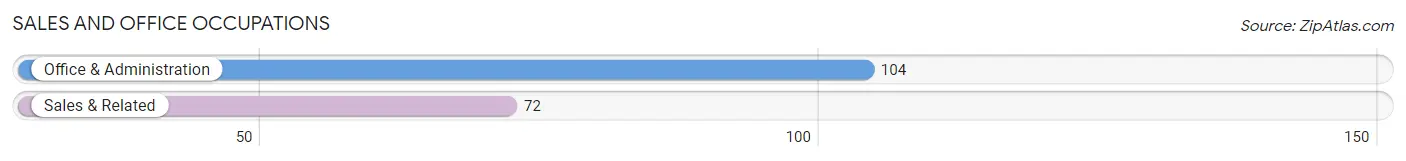
Sales and Office Occupations
The most common Sales and Office occupations in Coal Fork are Office & Administration (104 | 20.8%), and Sales & Related (72 | 14.4%).
Sales and Office Occupations by Sex
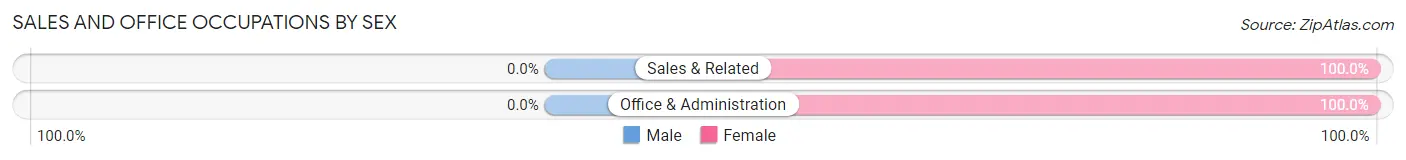
| Occupation | Male | Female |
| Sales & Related | 0 (0.0%) | 72 (100.0%) |
| Office & Administration | 0 (0.0%) | 104 (100.0%) |
| Total (Category) | 0 (0.0%) | 176 (100.0%) |
| Total (Overall) | 205 (40.9%) | 296 (59.1%) |
Natural Resources, Construction and Maintenance Occupations
The most common Natural Resources, Construction and Maintenance occupations in Coal Fork are , and Construction & Extraction (9 | 1.8%).
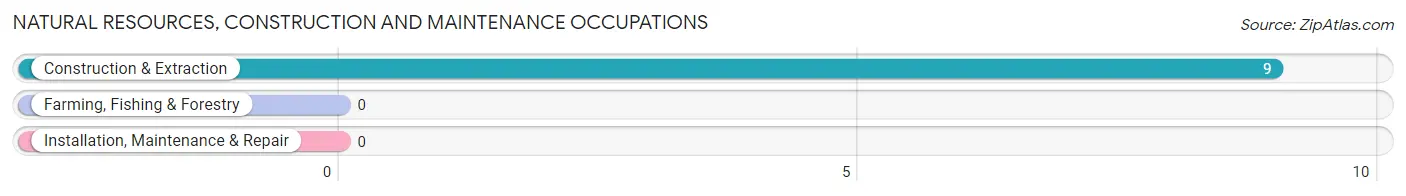
Natural Resources, Construction and Maintenance Occupations by Sex
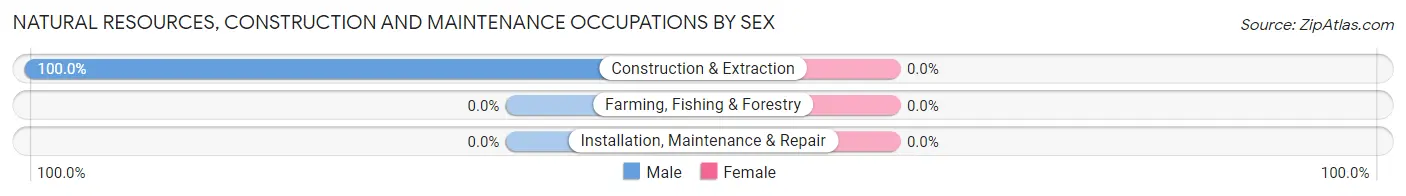
| Occupation | Male | Female |
| Farming, Fishing & Forestry | 0 (0.0%) | 0 (0.0%) |
| Construction & Extraction | 9 (100.0%) | 0 (0.0%) |
| Installation, Maintenance & Repair | 0 (0.0%) | 0 (0.0%) |
| Total (Category) | 9 (100.0%) | 0 (0.0%) |
| Total (Overall) | 205 (40.9%) | 296 (59.1%) |
Production, Transportation and Moving Occupations
The most common Production, Transportation and Moving occupations in Coal Fork are Material Moving (65 | 13.0%), Production (23 | 4.6%), and Transportation (14 | 2.8%).
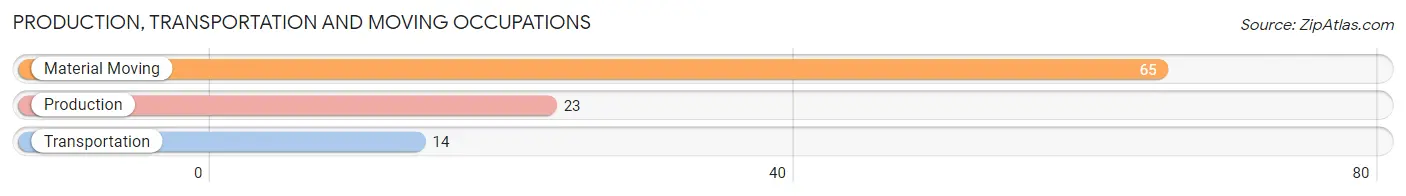
Production, Transportation and Moving Occupations by Sex
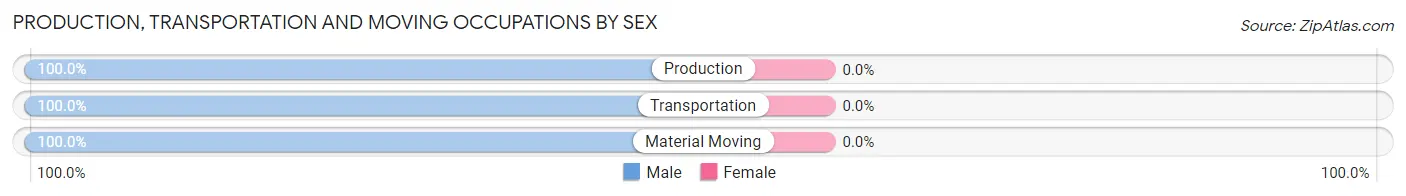
| Occupation | Male | Female |
| Production | 23 (100.0%) | 0 (0.0%) |
| Transportation | 14 (100.0%) | 0 (0.0%) |
| Material Moving | 65 (100.0%) | 0 (0.0%) |
| Total (Category) | 102 (100.0%) | 0 (0.0%) |
| Total (Overall) | 205 (40.9%) | 296 (59.1%) |
Employment Industries by Sex in Coal Fork
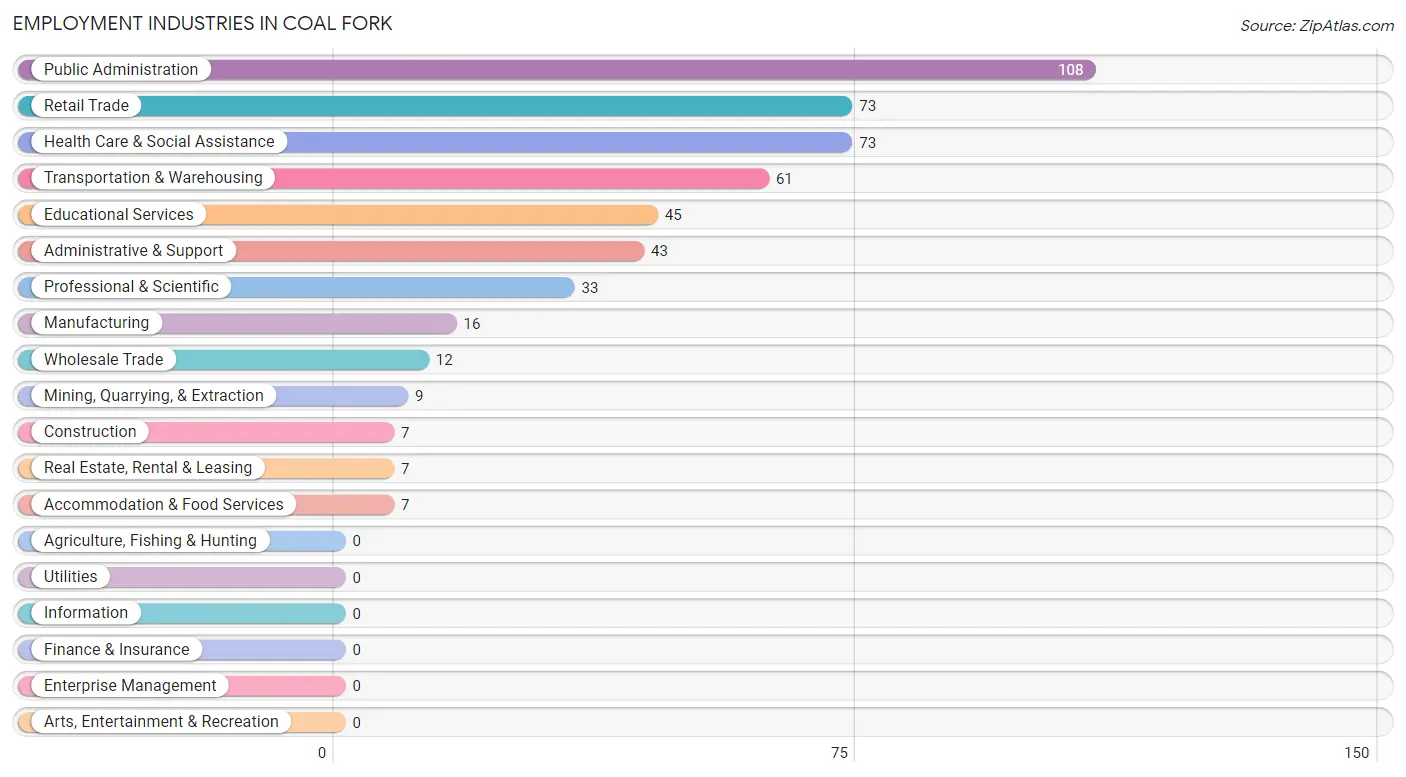
Employment Industries in Coal Fork
The major employment industries in Coal Fork include Public Administration (108 | 21.6%), Retail Trade (73 | 14.6%), Health Care & Social Assistance (73 | 14.6%), Transportation & Warehousing (61 | 12.2%), and Educational Services (45 | 9.0%).
Employment Industries by Sex in Coal Fork
The Coal Fork industries that see more men than women are Mining, Quarrying, & Extraction (100.0%), Construction (100.0%), and Manufacturing (100.0%), whereas the industries that tend to have a higher number of women are Wholesale Trade (100.0%), Retail Trade (100.0%), and Health Care & Social Assistance (100.0%).
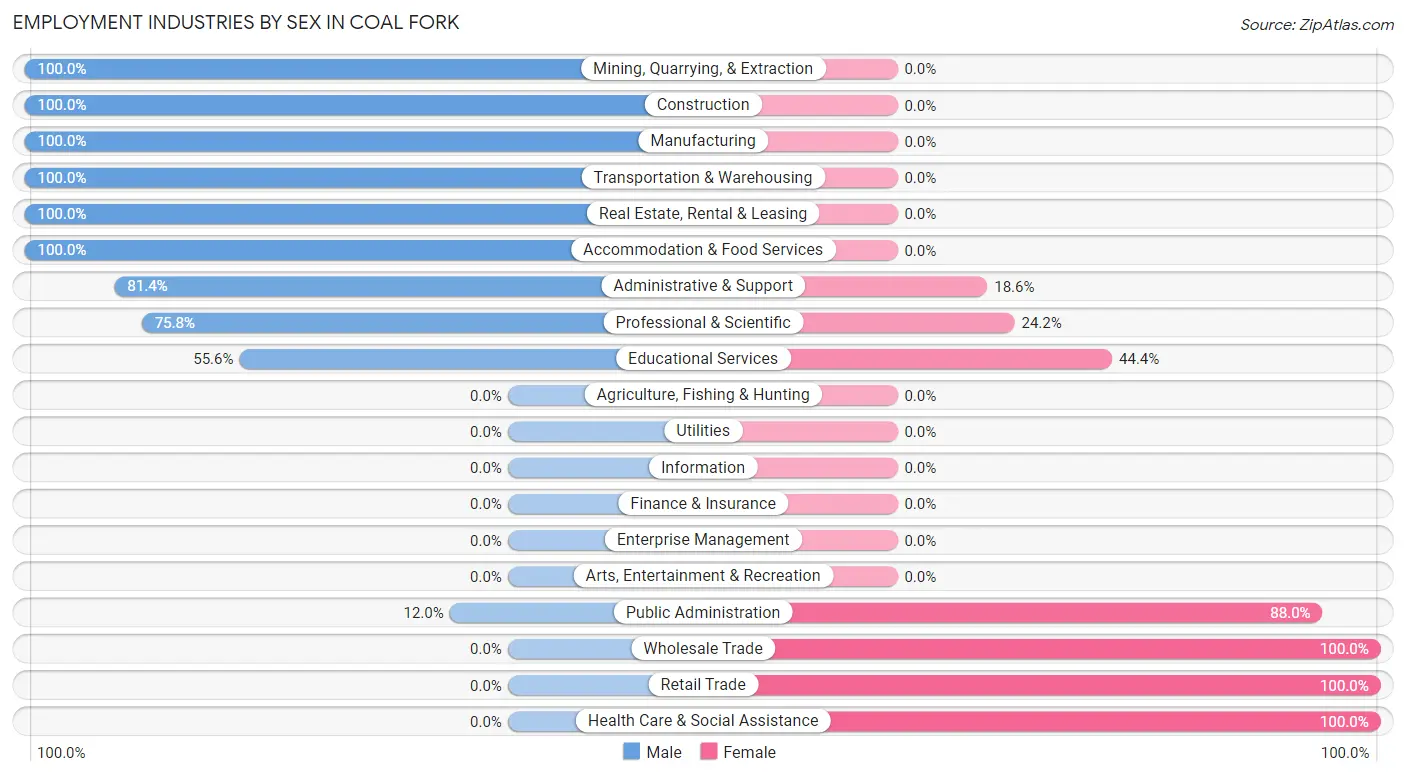
| Industry | Male | Female |
| Agriculture, Fishing & Hunting | 0 (0.0%) | 0 (0.0%) |
| Mining, Quarrying, & Extraction | 9 (100.0%) | 0 (0.0%) |
| Construction | 7 (100.0%) | 0 (0.0%) |
| Manufacturing | 16 (100.0%) | 0 (0.0%) |
| Wholesale Trade | 0 (0.0%) | 12 (100.0%) |
| Retail Trade | 0 (0.0%) | 73 (100.0%) |
| Transportation & Warehousing | 61 (100.0%) | 0 (0.0%) |
| Utilities | 0 (0.0%) | 0 (0.0%) |
| Information | 0 (0.0%) | 0 (0.0%) |
| Finance & Insurance | 0 (0.0%) | 0 (0.0%) |
| Real Estate, Rental & Leasing | 7 (100.0%) | 0 (0.0%) |
| Professional & Scientific | 25 (75.8%) | 8 (24.2%) |
| Enterprise Management | 0 (0.0%) | 0 (0.0%) |
| Administrative & Support | 35 (81.4%) | 8 (18.6%) |
| Educational Services | 25 (55.6%) | 20 (44.4%) |
| Health Care & Social Assistance | 0 (0.0%) | 73 (100.0%) |
| Arts, Entertainment & Recreation | 0 (0.0%) | 0 (0.0%) |
| Accommodation & Food Services | 7 (100.0%) | 0 (0.0%) |
| Public Administration | 13 (12.0%) | 95 (88.0%) |
| Total | 205 (40.9%) | 296 (59.1%) |
Education in Coal Fork
School Enrollment in Coal Fork
The most common levels of schooling among the 148 students in Coal Fork are graduate / professional (60 | 40.5%), nursery / preschool (35 | 23.6%), and college / undergraduate (18 | 12.2%).
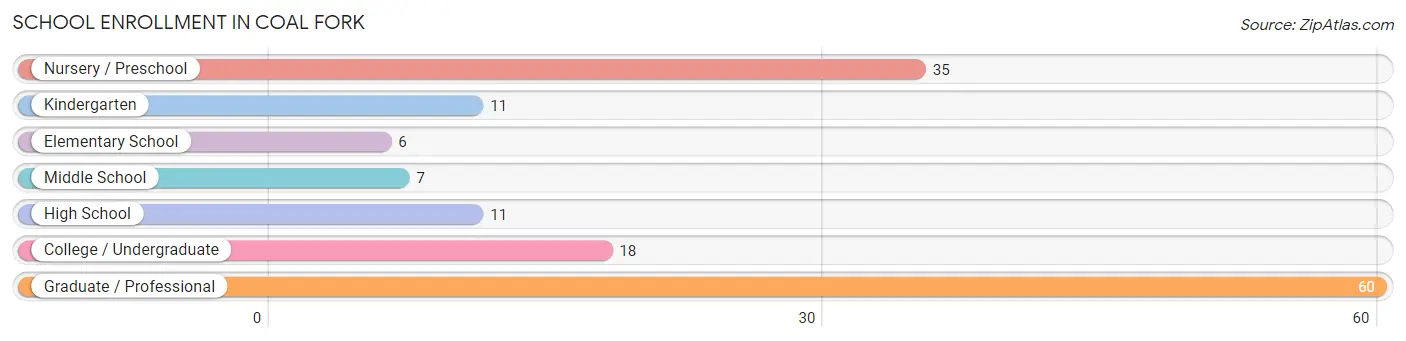
| School Level | # Students | % Students |
| Nursery / Preschool | 35 | 23.6% |
| Kindergarten | 11 | 7.4% |
| Elementary School | 6 | 4.1% |
| Middle School | 7 | 4.7% |
| High School | 11 | 7.4% |
| College / Undergraduate | 18 | 12.2% |
| Graduate / Professional | 60 | 40.5% |
| Total | 148 | 100.0% |
School Enrollment by Age by Funding Source in Coal Fork
Out of a total of 148 students who are enrolled in schools in Coal Fork, 24 (16.2%) attend a private institution, while the remaining 124 (83.8%) are enrolled in public schools. The age group of 35 years and over has the highest likelihood of being enrolled in private schools, with 12 (100.0% in the age bracket) enrolled. Conversely, the age group of 10 to 14 year olds has the lowest likelihood of being enrolled in a private school, with 7 (100.0% in the age bracket) attending a public institution.
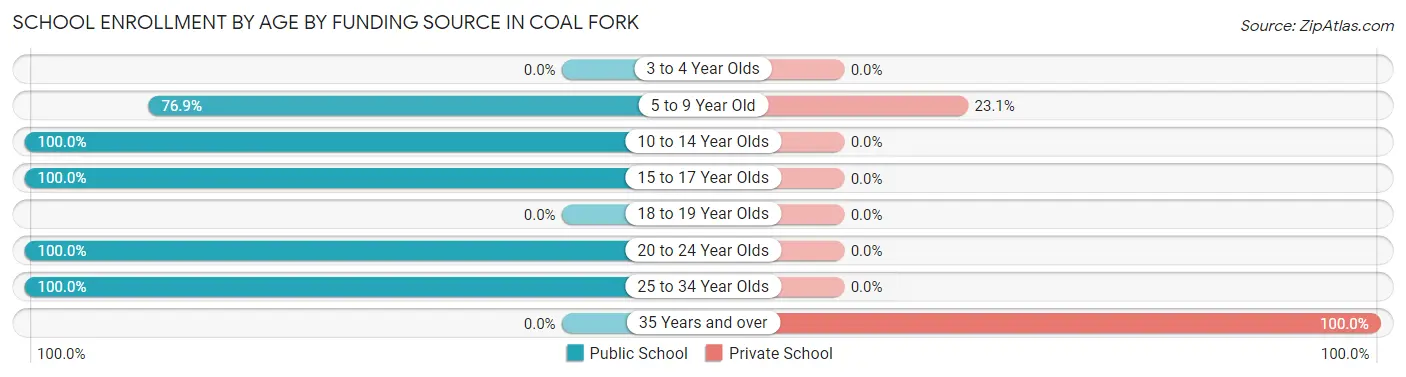
| Age Bracket | Public School | Private School |
| 3 to 4 Year Olds | 0 (0.0%) | 0 (0.0%) |
| 5 to 9 Year Old | 40 (76.9%) | 12 (23.1%) |
| 10 to 14 Year Olds | 7 (100.0%) | 0 (0.0%) |
| 15 to 17 Year Olds | 11 (100.0%) | 0 (0.0%) |
| 18 to 19 Year Olds | 0 (0.0%) | 0 (0.0%) |
| 20 to 24 Year Olds | 16 (100.0%) | 0 (0.0%) |
| 25 to 34 Year Olds | 50 (100.0%) | 0 (0.0%) |
| 35 Years and over | 0 (0.0%) | 12 (100.0%) |
| Total | 124 (83.8%) | 24 (16.2%) |
Educational Attainment by Field of Study in Coal Fork
Business (61 | 49.2%), engineering (25 | 20.2%), psychology (12 | 9.7%), education (12 | 9.7%), and physical & health sciences (7 | 5.7%) are the most common fields of study among 124 individuals in Coal Fork who have obtained a bachelor's degree or higher.
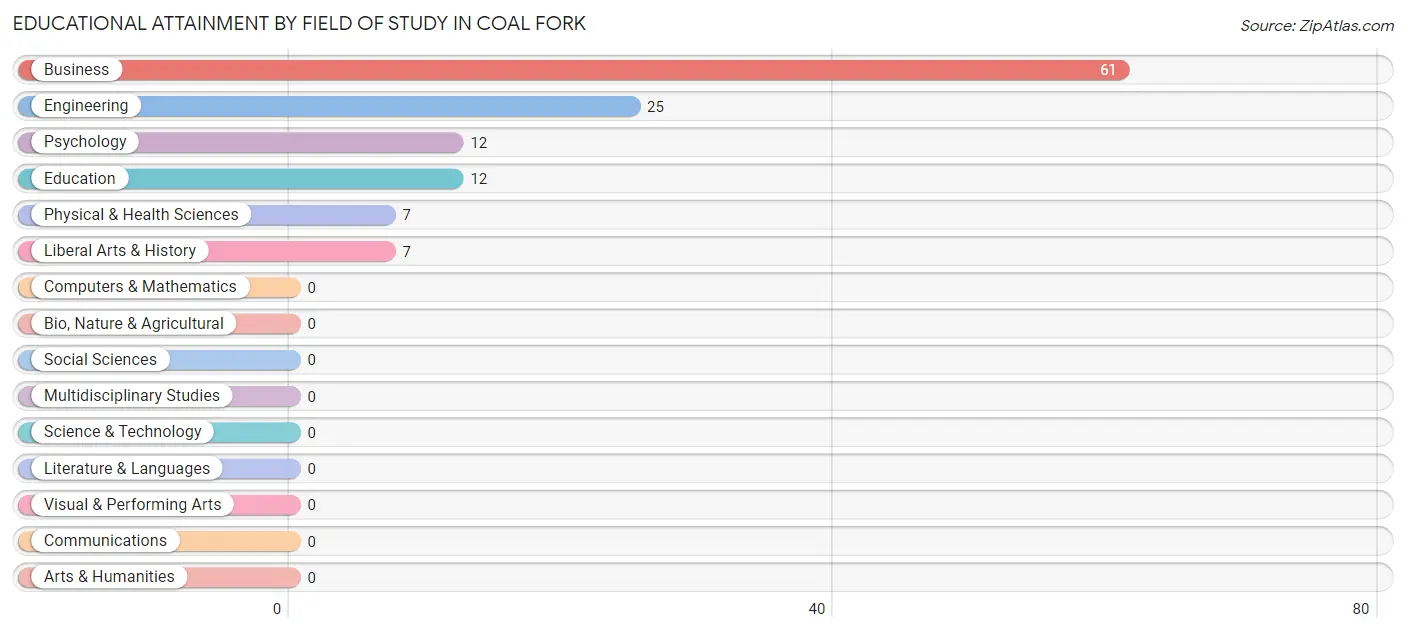
| Field of Study | # Graduates | % Graduates |
| Computers & Mathematics | 0 | 0.0% |
| Bio, Nature & Agricultural | 0 | 0.0% |
| Physical & Health Sciences | 7 | 5.7% |
| Psychology | 12 | 9.7% |
| Social Sciences | 0 | 0.0% |
| Engineering | 25 | 20.2% |
| Multidisciplinary Studies | 0 | 0.0% |
| Science & Technology | 0 | 0.0% |
| Business | 61 | 49.2% |
| Education | 12 | 9.7% |
| Literature & Languages | 0 | 0.0% |
| Liberal Arts & History | 7 | 5.7% |
| Visual & Performing Arts | 0 | 0.0% |
| Communications | 0 | 0.0% |
| Arts & Humanities | 0 | 0.0% |
| Total | 124 | 100.0% |
Transportation & Commute in Coal Fork
Vehicle Availability by Sex in Coal Fork
The most prevalent vehicle ownership categories in Coal Fork are males with 2 vehicles (85, accounting for 41.5%) and females with 2 vehicles (199, making up 30.5%).
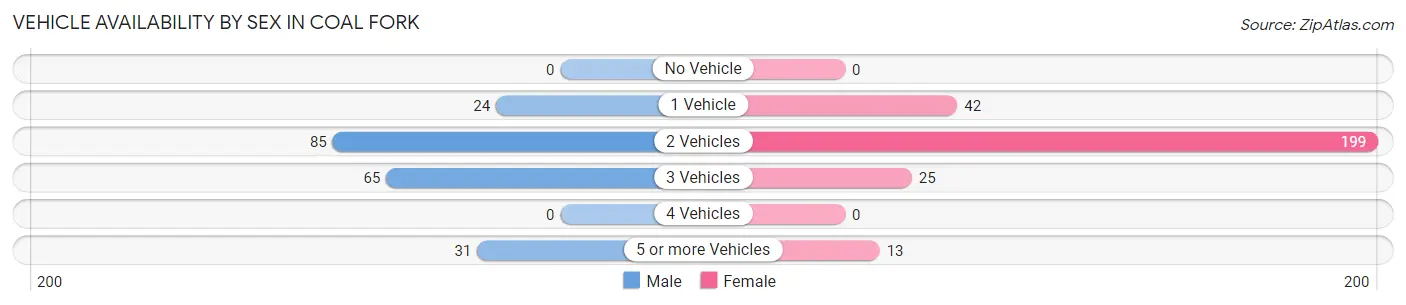
| Vehicles Available | Male | Female |
| No Vehicle | 0 (0.0%) | 0 (0.0%) |
| 1 Vehicle | 24 (11.7%) | 42 (15.0%) |
| 2 Vehicles | 85 (41.5%) | 199 (71.3%) |
| 3 Vehicles | 65 (31.7%) | 25 (9.0%) |
| 4 Vehicles | 0 (0.0%) | 0 (0.0%) |
| 5 or more Vehicles | 31 (15.1%) | 13 (4.7%) |
| Total | 205 (100.0%) | 279 (100.0%) |
Commute Time in Coal Fork
The most frequently occuring commute durations in Coal Fork are 15 to 19 minutes (195 commuters, 40.3%), 10 to 14 minutes (60 commuters, 12.4%), and 20 to 24 minutes (56 commuters, 11.6%).
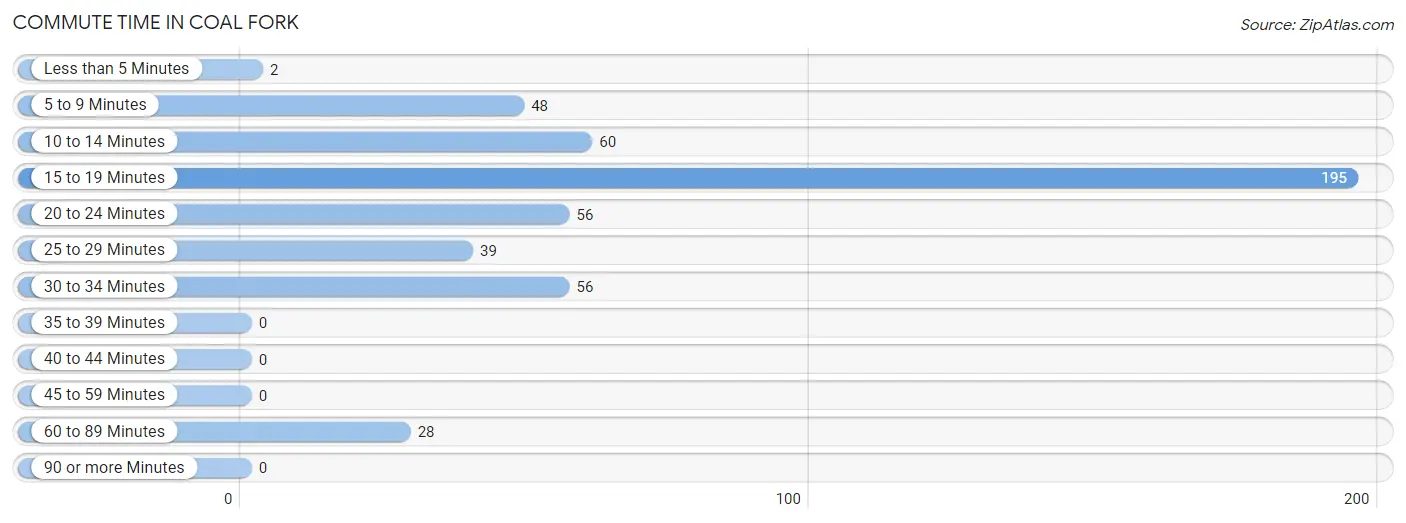
| Commute Time | # Commuters | % Commuters |
| Less than 5 Minutes | 2 | 0.4% |
| 5 to 9 Minutes | 48 | 9.9% |
| 10 to 14 Minutes | 60 | 12.4% |
| 15 to 19 Minutes | 195 | 40.3% |
| 20 to 24 Minutes | 56 | 11.6% |
| 25 to 29 Minutes | 39 | 8.1% |
| 30 to 34 Minutes | 56 | 11.6% |
| 35 to 39 Minutes | 0 | 0.0% |
| 40 to 44 Minutes | 0 | 0.0% |
| 45 to 59 Minutes | 0 | 0.0% |
| 60 to 89 Minutes | 28 | 5.8% |
| 90 or more Minutes | 0 | 0.0% |
Commute Time by Sex in Coal Fork
The most common commute times in Coal Fork are 15 to 19 minutes (81 commuters, 39.5%) for males and 15 to 19 minutes (114 commuters, 40.9%) for females.
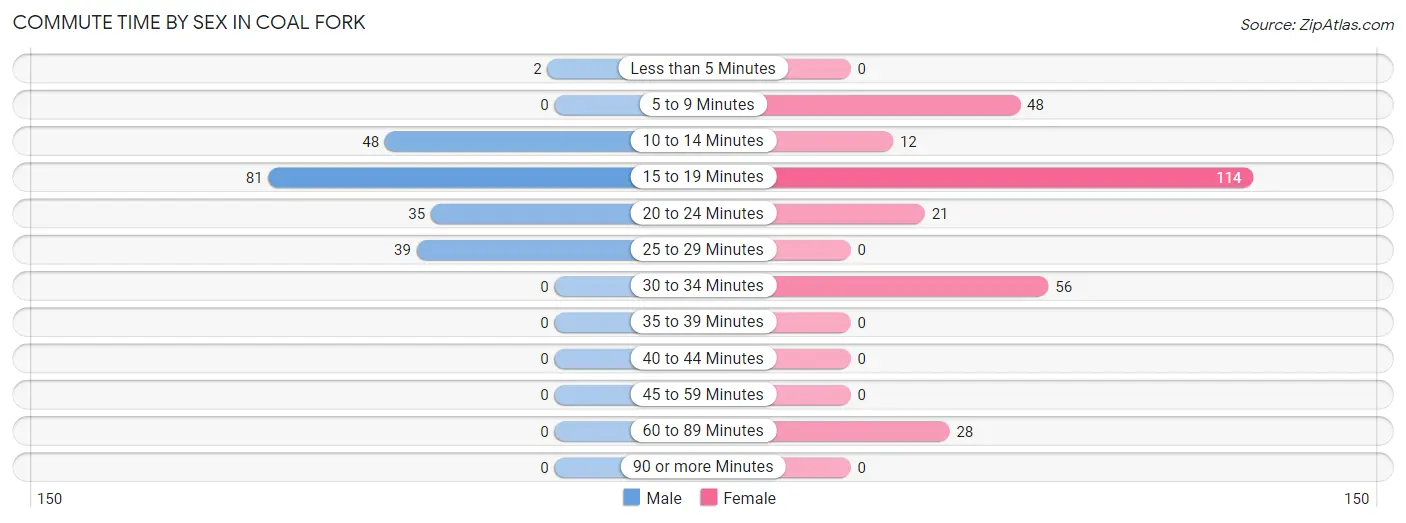
| Commute Time | Male | Female |
| Less than 5 Minutes | 2 (1.0%) | 0 (0.0%) |
| 5 to 9 Minutes | 0 (0.0%) | 48 (17.2%) |
| 10 to 14 Minutes | 48 (23.4%) | 12 (4.3%) |
| 15 to 19 Minutes | 81 (39.5%) | 114 (40.9%) |
| 20 to 24 Minutes | 35 (17.1%) | 21 (7.5%) |
| 25 to 29 Minutes | 39 (19.0%) | 0 (0.0%) |
| 30 to 34 Minutes | 0 (0.0%) | 56 (20.1%) |
| 35 to 39 Minutes | 0 (0.0%) | 0 (0.0%) |
| 40 to 44 Minutes | 0 (0.0%) | 0 (0.0%) |
| 45 to 59 Minutes | 0 (0.0%) | 0 (0.0%) |
| 60 to 89 Minutes | 0 (0.0%) | 28 (10.0%) |
| 90 or more Minutes | 0 (0.0%) | 0 (0.0%) |
Time of Departure to Work by Sex in Coal Fork
The most frequent times of departure to work in Coal Fork are 6:30 AM to 6:59 AM (45, 22.0%) for males and 12:00 AM to 4:59 AM (76, 27.2%) for females.
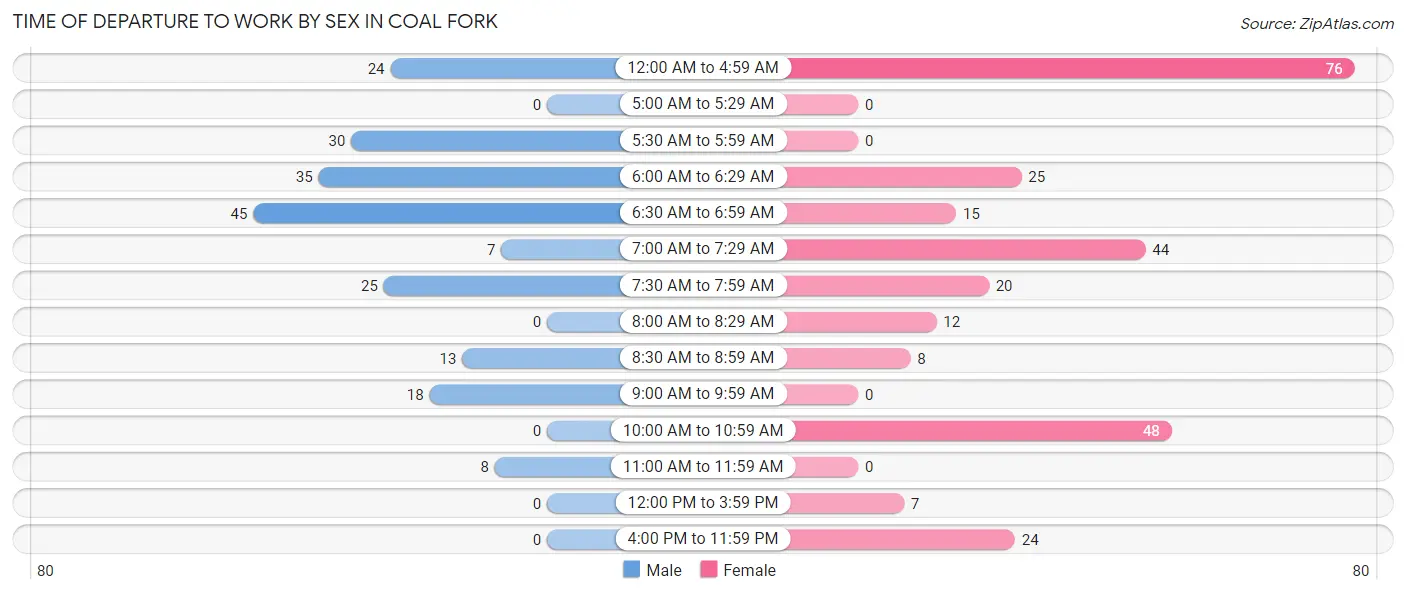
| Time of Departure | Male | Female |
| 12:00 AM to 4:59 AM | 24 (11.7%) | 76 (27.2%) |
| 5:00 AM to 5:29 AM | 0 (0.0%) | 0 (0.0%) |
| 5:30 AM to 5:59 AM | 30 (14.6%) | 0 (0.0%) |
| 6:00 AM to 6:29 AM | 35 (17.1%) | 25 (9.0%) |
| 6:30 AM to 6:59 AM | 45 (22.0%) | 15 (5.4%) |
| 7:00 AM to 7:29 AM | 7 (3.4%) | 44 (15.8%) |
| 7:30 AM to 7:59 AM | 25 (12.2%) | 20 (7.2%) |
| 8:00 AM to 8:29 AM | 0 (0.0%) | 12 (4.3%) |
| 8:30 AM to 8:59 AM | 13 (6.3%) | 8 (2.9%) |
| 9:00 AM to 9:59 AM | 18 (8.8%) | 0 (0.0%) |
| 10:00 AM to 10:59 AM | 0 (0.0%) | 48 (17.2%) |
| 11:00 AM to 11:59 AM | 8 (3.9%) | 0 (0.0%) |
| 12:00 PM to 3:59 PM | 0 (0.0%) | 7 (2.5%) |
| 4:00 PM to 11:59 PM | 0 (0.0%) | 24 (8.6%) |
| Total | 205 (100.0%) | 279 (100.0%) |
Housing Occupancy in Coal Fork
Occupancy by Ownership in Coal Fork
Of the total 518 dwellings in Coal Fork, owner-occupied units account for 433 (83.6%), while renter-occupied units make up 85 (16.4%).
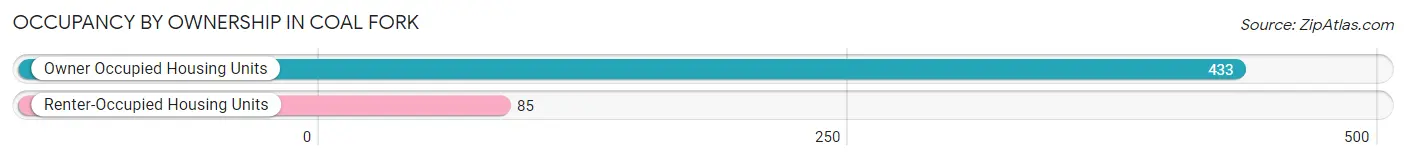
| Occupancy | # Housing Units | % Housing Units |
| Owner Occupied Housing Units | 433 | 83.6% |
| Renter-Occupied Housing Units | 85 | 16.4% |
| Total Occupied Housing Units | 518 | 100.0% |
Occupancy by Household Size in Coal Fork
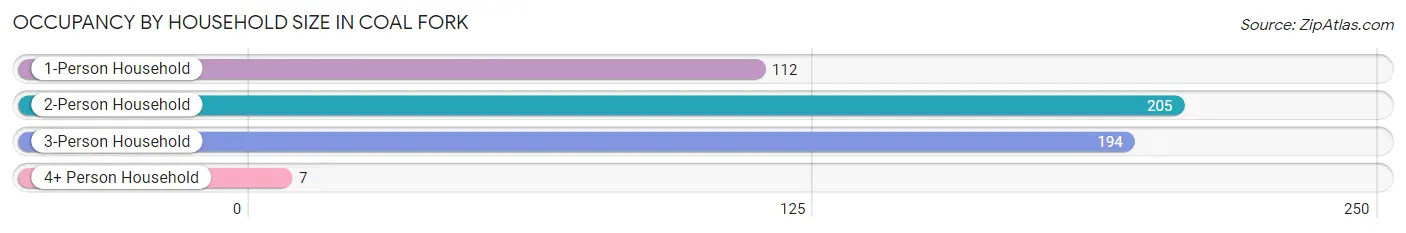
| Household Size | # Housing Units | % Housing Units |
| 1-Person Household | 112 | 21.6% |
| 2-Person Household | 205 | 39.6% |
| 3-Person Household | 194 | 37.4% |
| 4+ Person Household | 7 | 1.3% |
| Total Housing Units | 518 | 100.0% |
Occupancy by Ownership by Household Size in Coal Fork
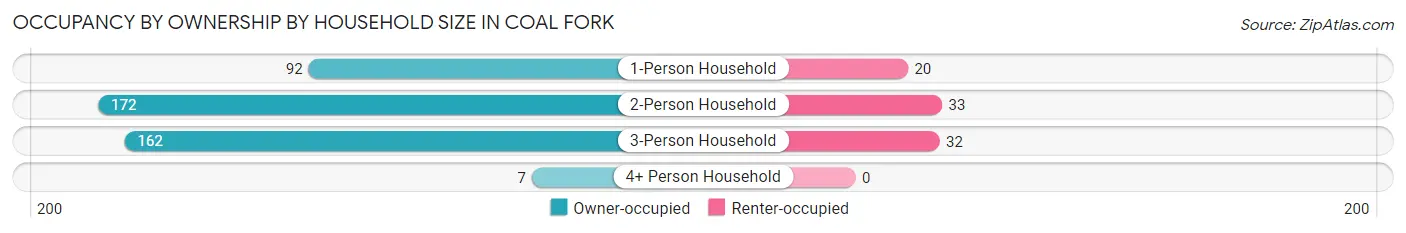
| Household Size | Owner-occupied | Renter-occupied |
| 1-Person Household | 92 (82.1%) | 20 (17.9%) |
| 2-Person Household | 172 (83.9%) | 33 (16.1%) |
| 3-Person Household | 162 (83.5%) | 32 (16.5%) |
| 4+ Person Household | 7 (100.0%) | 0 (0.0%) |
| Total Housing Units | 433 (83.6%) | 85 (16.4%) |
Occupancy by Educational Attainment in Coal Fork
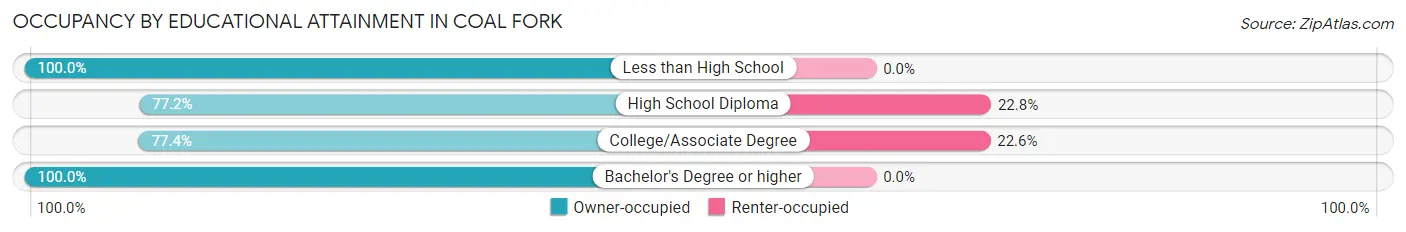
| Household Size | Owner-occupied | Renter-occupied |
| Less than High School | 46 (100.0%) | 0 (0.0%) |
| High School Diploma | 224 (77.2%) | 66 (22.8%) |
| College/Associate Degree | 65 (77.4%) | 19 (22.6%) |
| Bachelor's Degree or higher | 98 (100.0%) | 0 (0.0%) |
Occupancy by Age of Householder in Coal Fork
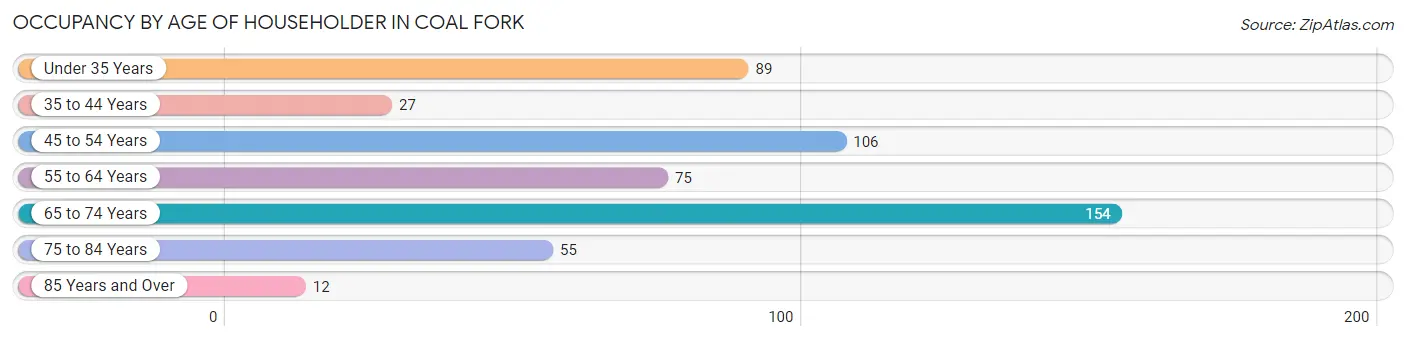
| Age Bracket | # Households | % Households |
| Under 35 Years | 89 | 17.2% |
| 35 to 44 Years | 27 | 5.2% |
| 45 to 54 Years | 106 | 20.5% |
| 55 to 64 Years | 75 | 14.5% |
| 65 to 74 Years | 154 | 29.7% |
| 75 to 84 Years | 55 | 10.6% |
| 85 Years and Over | 12 | 2.3% |
| Total | 518 | 100.0% |
Housing Finances in Coal Fork
Median Income by Occupancy in Coal Fork

| Occupancy Type | # Households | Median Income |
| Owner-Occupied | 433 (83.6%) | $61,250 |
| Renter-Occupied | 85 (16.4%) | $0 |
| Average | 518 (100.0%) | $60,534 |
Occupancy by Householder Income Bracket in Coal Fork
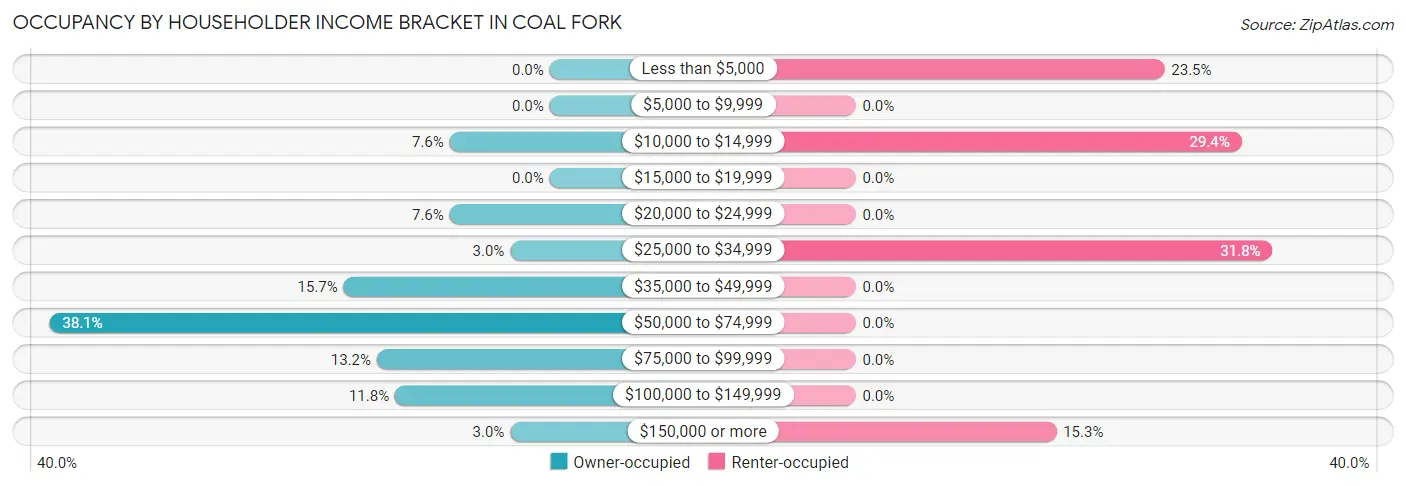
| Income Bracket | Owner-occupied | Renter-occupied |
| Less than $5,000 | 0 (0.0%) | 20 (23.5%) |
| $5,000 to $9,999 | 0 (0.0%) | 0 (0.0%) |
| $10,000 to $14,999 | 33 (7.6%) | 25 (29.4%) |
| $15,000 to $19,999 | 0 (0.0%) | 0 (0.0%) |
| $20,000 to $24,999 | 33 (7.6%) | 0 (0.0%) |
| $25,000 to $34,999 | 13 (3.0%) | 27 (31.8%) |
| $35,000 to $49,999 | 68 (15.7%) | 0 (0.0%) |
| $50,000 to $74,999 | 165 (38.1%) | 0 (0.0%) |
| $75,000 to $99,999 | 57 (13.2%) | 0 (0.0%) |
| $100,000 to $149,999 | 51 (11.8%) | 0 (0.0%) |
| $150,000 or more | 13 (3.0%) | 13 (15.3%) |
| Total | 433 (100.0%) | 85 (100.0%) |
Monthly Housing Cost Tiers in Coal Fork
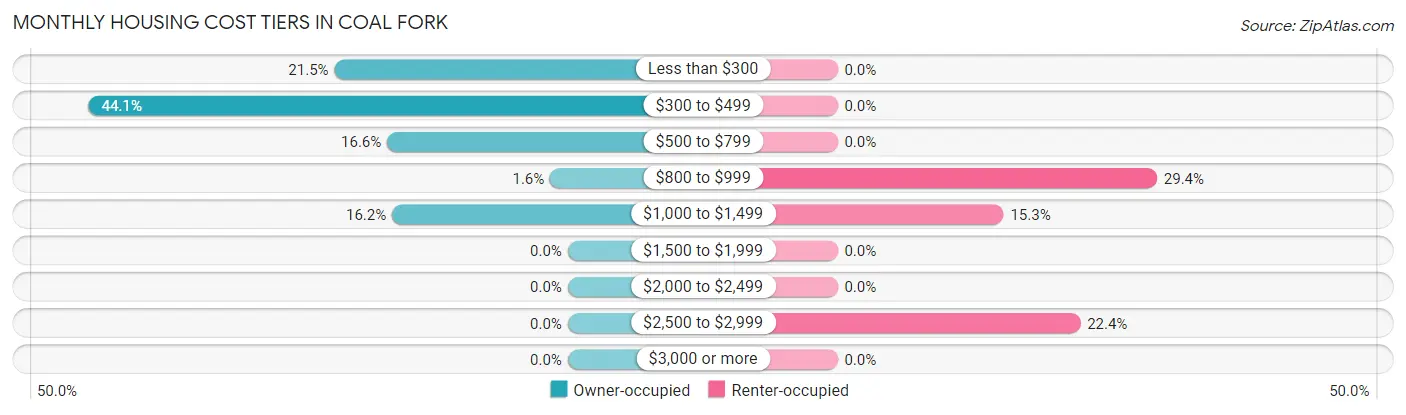
| Monthly Cost | Owner-occupied | Renter-occupied |
| Less than $300 | 93 (21.5%) | 0 (0.0%) |
| $300 to $499 | 191 (44.1%) | 0 (0.0%) |
| $500 to $799 | 72 (16.6%) | 0 (0.0%) |
| $800 to $999 | 7 (1.6%) | 25 (29.4%) |
| $1,000 to $1,499 | 70 (16.2%) | 13 (15.3%) |
| $1,500 to $1,999 | 0 (0.0%) | 0 (0.0%) |
| $2,000 to $2,499 | 0 (0.0%) | 0 (0.0%) |
| $2,500 to $2,999 | 0 (0.0%) | 19 (22.4%) |
| $3,000 or more | 0 (0.0%) | 0 (0.0%) |
| Total | 433 (100.0%) | 85 (100.0%) |
Physical Housing Characteristics in Coal Fork
Housing Structures in Coal Fork
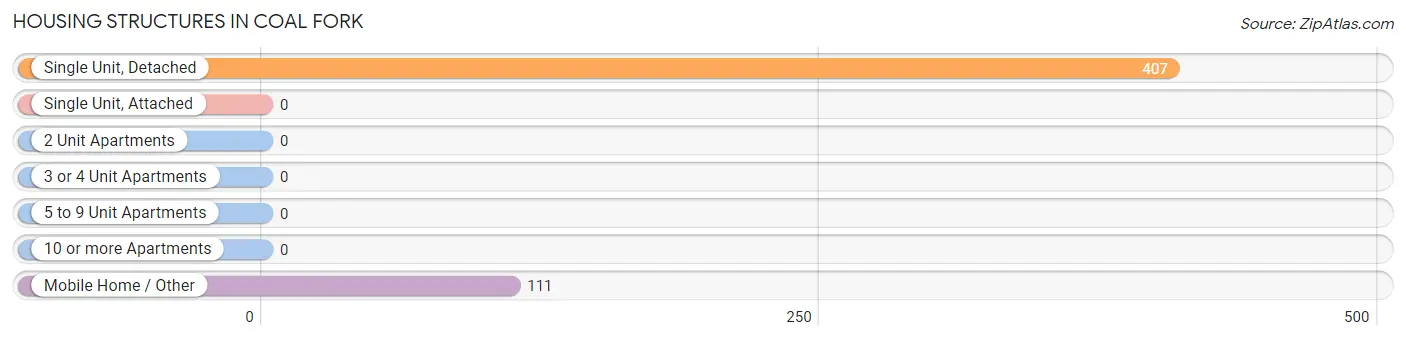
| Structure Type | # Housing Units | % Housing Units |
| Single Unit, Detached | 407 | 78.6% |
| Single Unit, Attached | 0 | 0.0% |
| 2 Unit Apartments | 0 | 0.0% |
| 3 or 4 Unit Apartments | 0 | 0.0% |
| 5 to 9 Unit Apartments | 0 | 0.0% |
| 10 or more Apartments | 0 | 0.0% |
| Mobile Home / Other | 111 | 21.4% |
| Total | 518 | 100.0% |
Housing Structures by Occupancy in Coal Fork
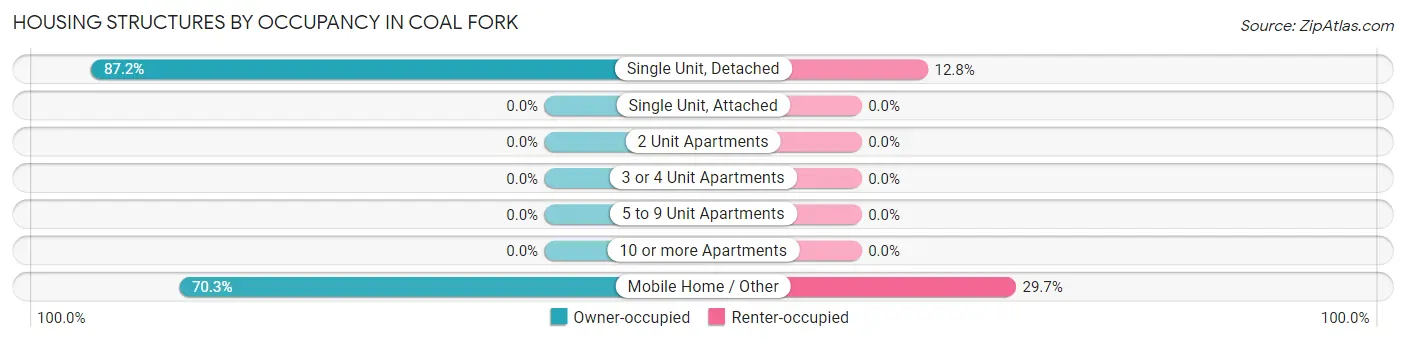
| Structure Type | Owner-occupied | Renter-occupied |
| Single Unit, Detached | 355 (87.2%) | 52 (12.8%) |
| Single Unit, Attached | 0 (0.0%) | 0 (0.0%) |
| 2 Unit Apartments | 0 (0.0%) | 0 (0.0%) |
| 3 or 4 Unit Apartments | 0 (0.0%) | 0 (0.0%) |
| 5 to 9 Unit Apartments | 0 (0.0%) | 0 (0.0%) |
| 10 or more Apartments | 0 (0.0%) | 0 (0.0%) |
| Mobile Home / Other | 78 (70.3%) | 33 (29.7%) |
| Total | 433 (83.6%) | 85 (16.4%) |
Housing Structures by Number of Rooms in Coal Fork
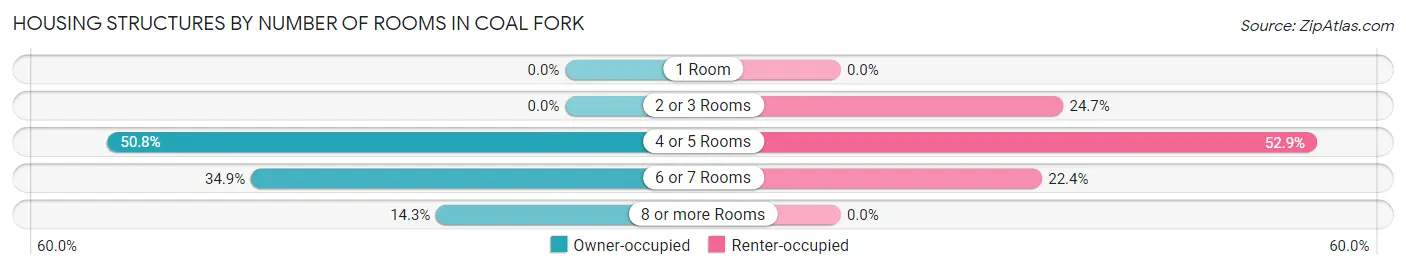
| Number of Rooms | Owner-occupied | Renter-occupied |
| 1 Room | 0 (0.0%) | 0 (0.0%) |
| 2 or 3 Rooms | 0 (0.0%) | 21 (24.7%) |
| 4 or 5 Rooms | 220 (50.8%) | 45 (52.9%) |
| 6 or 7 Rooms | 151 (34.9%) | 19 (22.4%) |
| 8 or more Rooms | 62 (14.3%) | 0 (0.0%) |
| Total | 433 (100.0%) | 85 (100.0%) |
Housing Structure by Heating Type in Coal Fork
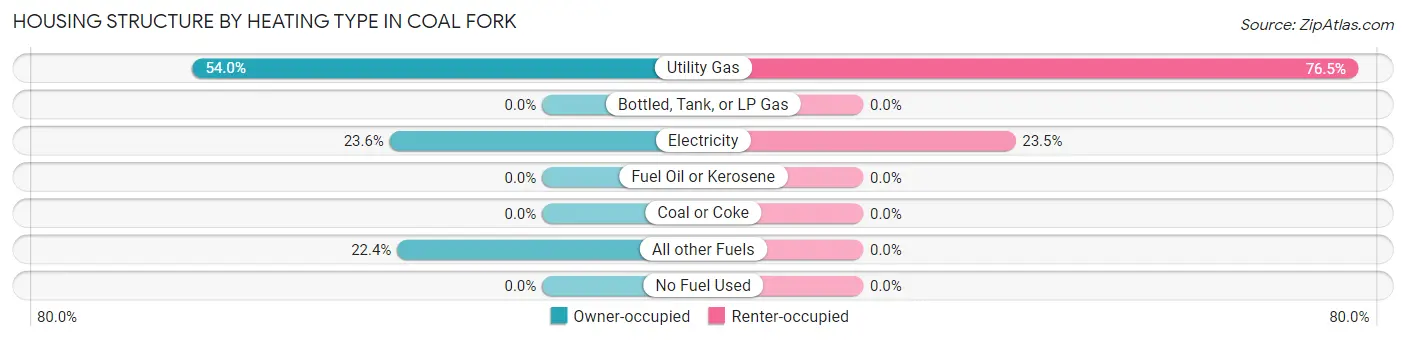
| Heating Type | Owner-occupied | Renter-occupied |
| Utility Gas | 234 (54.0%) | 65 (76.5%) |
| Bottled, Tank, or LP Gas | 0 (0.0%) | 0 (0.0%) |
| Electricity | 102 (23.6%) | 20 (23.5%) |
| Fuel Oil or Kerosene | 0 (0.0%) | 0 (0.0%) |
| Coal or Coke | 0 (0.0%) | 0 (0.0%) |
| All other Fuels | 97 (22.4%) | 0 (0.0%) |
| No Fuel Used | 0 (0.0%) | 0 (0.0%) |
| Total | 433 (100.0%) | 85 (100.0%) |
Household Vehicle Usage in Coal Fork
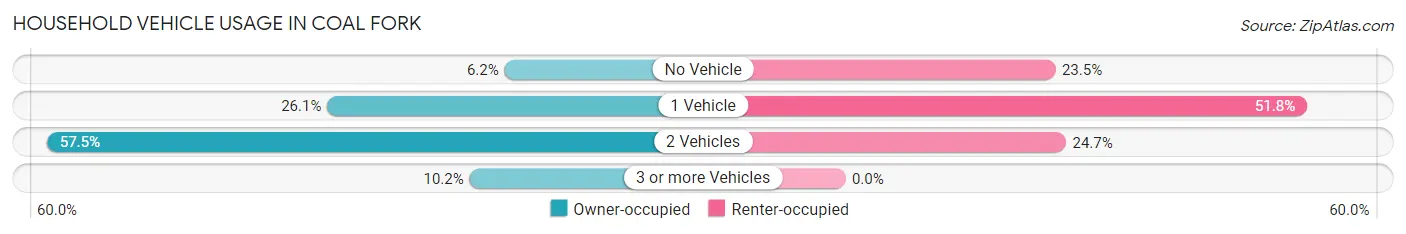
| Vehicles per Household | Owner-occupied | Renter-occupied |
| No Vehicle | 27 (6.2%) | 20 (23.5%) |
| 1 Vehicle | 113 (26.1%) | 44 (51.8%) |
| 2 Vehicles | 249 (57.5%) | 21 (24.7%) |
| 3 or more Vehicles | 44 (10.2%) | 0 (0.0%) |
| Total | 433 (100.0%) | 85 (100.0%) |
Real Estate & Mortgages in Coal Fork
Real Estate and Mortgage Overview in Coal Fork
| Characteristic | Without Mortgage | With Mortgage |
| Housing Units | 294 | 139 |
| Median Property Value | - | - |
| Median Household Income | $60,485 | $13 |
| Monthly Housing Costs | $326 | $0 |
| Real Estate Taxes | $199 | $1 |
Property Value by Mortgage Status in Coal Fork
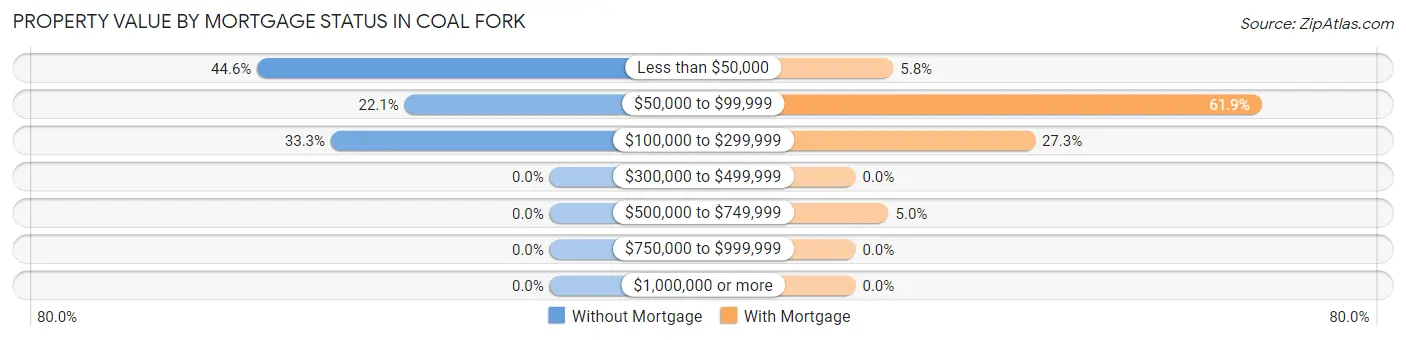
| Property Value | Without Mortgage | With Mortgage |
| Less than $50,000 | 131 (44.6%) | 8 (5.8%) |
| $50,000 to $99,999 | 65 (22.1%) | 86 (61.9%) |
| $100,000 to $299,999 | 98 (33.3%) | 38 (27.3%) |
| $300,000 to $499,999 | 0 (0.0%) | 0 (0.0%) |
| $500,000 to $749,999 | 0 (0.0%) | 7 (5.0%) |
| $750,000 to $999,999 | 0 (0.0%) | 0 (0.0%) |
| $1,000,000 or more | 0 (0.0%) | 0 (0.0%) |
| Total | 294 (100.0%) | 139 (100.0%) |
Household Income by Mortgage Status in Coal Fork
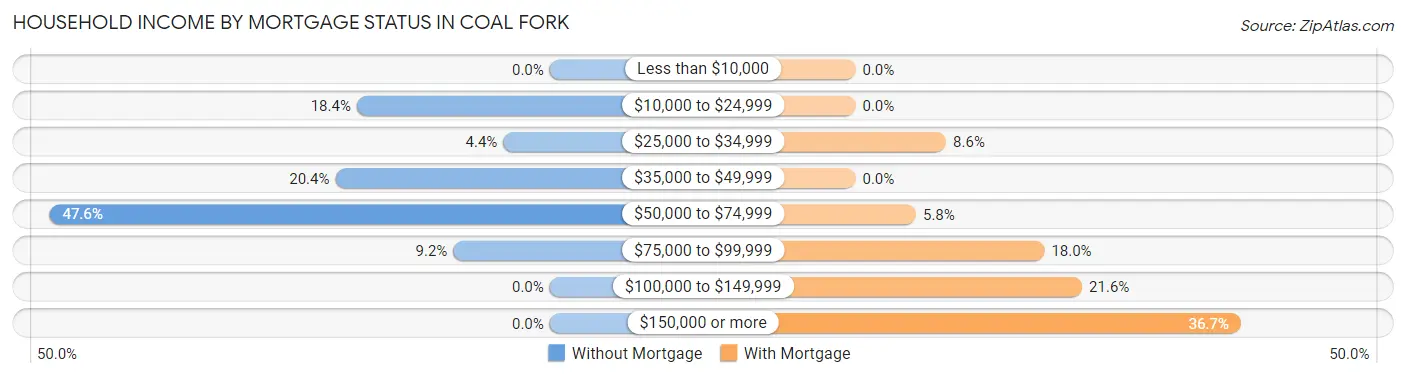
| Household Income | Without Mortgage | With Mortgage |
| Less than $10,000 | 0 (0.0%) | 0 (0.0%) |
| $10,000 to $24,999 | 54 (18.4%) | 0 (0.0%) |
| $25,000 to $34,999 | 13 (4.4%) | 12 (8.6%) |
| $35,000 to $49,999 | 60 (20.4%) | 0 (0.0%) |
| $50,000 to $74,999 | 140 (47.6%) | 8 (5.8%) |
| $75,000 to $99,999 | 27 (9.2%) | 25 (18.0%) |
| $100,000 to $149,999 | 0 (0.0%) | 30 (21.6%) |
| $150,000 or more | 0 (0.0%) | 51 (36.7%) |
| Total | 294 (100.0%) | 139 (100.0%) |
Property Value to Household Income Ratio in Coal Fork
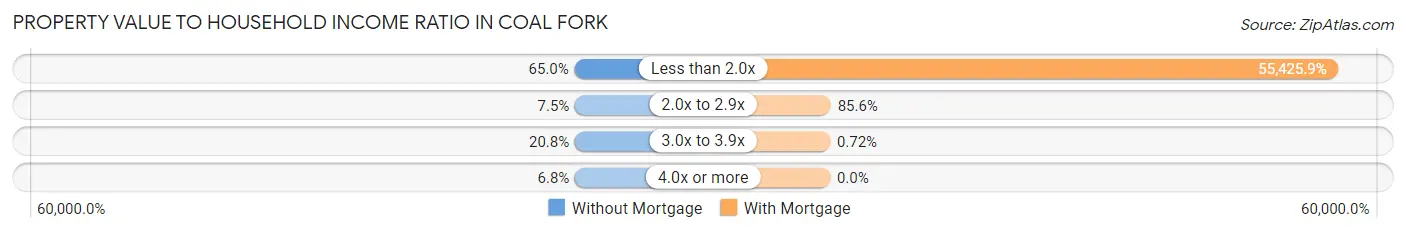
| Value-to-Income Ratio | Without Mortgage | With Mortgage |
| Less than 2.0x | 191 (65.0%) | 77,042 (55,425.9%) |
| 2.0x to 2.9x | 22 (7.5%) | 119 (85.6%) |
| 3.0x to 3.9x | 61 (20.7%) | 1 (0.7%) |
| 4.0x or more | 20 (6.8%) | 0 (0.0%) |
| Total | 294 (100.0%) | 139 (100.0%) |
Real Estate Taxes by Mortgage Status in Coal Fork
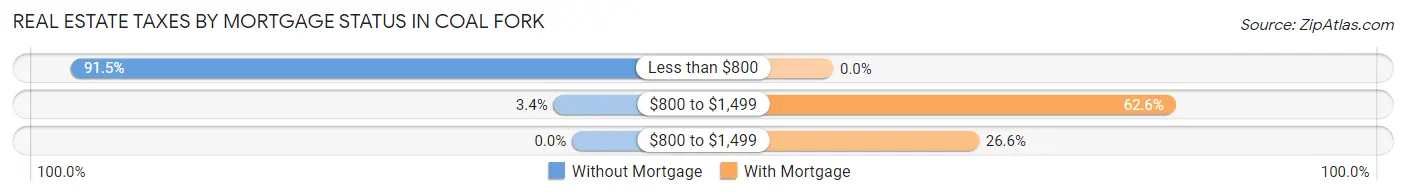
| Property Taxes | Without Mortgage | With Mortgage |
| Less than $800 | 269 (91.5%) | 0 (0.0%) |
| $800 to $1,499 | 10 (3.4%) | 87 (62.6%) |
| $800 to $1,499 | 0 (0.0%) | 37 (26.6%) |
| Total | 294 (100.0%) | 139 (100.0%) |
Health & Disability in Coal Fork
Health Insurance Coverage by Age in Coal Fork
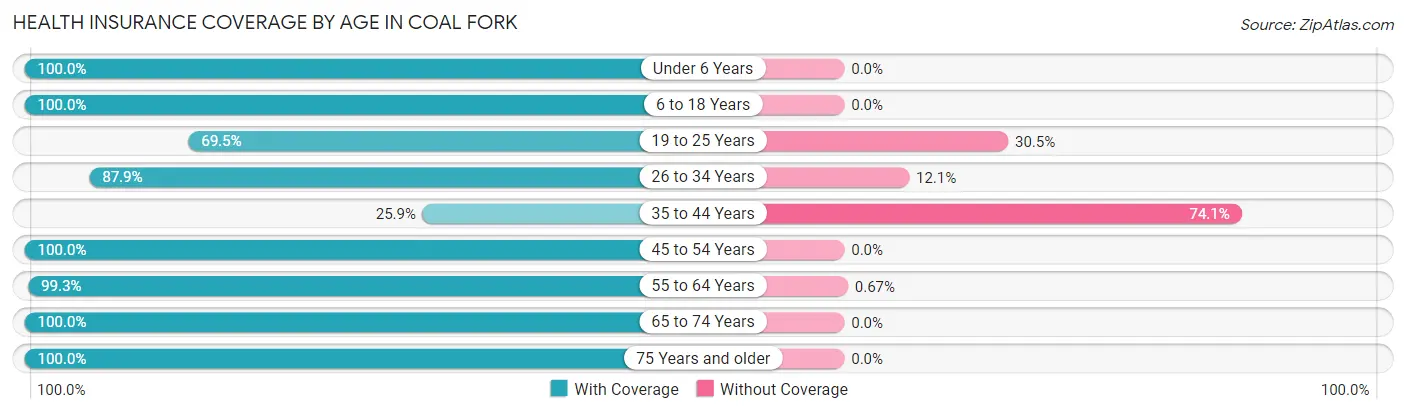
| Age Bracket | With Coverage | Without Coverage |
| Under 6 Years | 77 (100.0%) | 0 (0.0%) |
| 6 to 18 Years | 51 (100.0%) | 0 (0.0%) |
| 19 to 25 Years | 132 (69.5%) | 58 (30.5%) |
| 26 to 34 Years | 51 (87.9%) | 7 (12.1%) |
| 35 to 44 Years | 7 (25.9%) | 20 (74.1%) |
| 45 to 54 Years | 453 (100.0%) | 0 (0.0%) |
| 55 to 64 Years | 149 (99.3%) | 1 (0.7%) |
| 65 to 74 Years | 174 (100.0%) | 0 (0.0%) |
| 75 Years and older | 98 (100.0%) | 0 (0.0%) |
| Total | 1,192 (93.3%) | 86 (6.7%) |
Health Insurance Coverage by Citizenship Status in Coal Fork
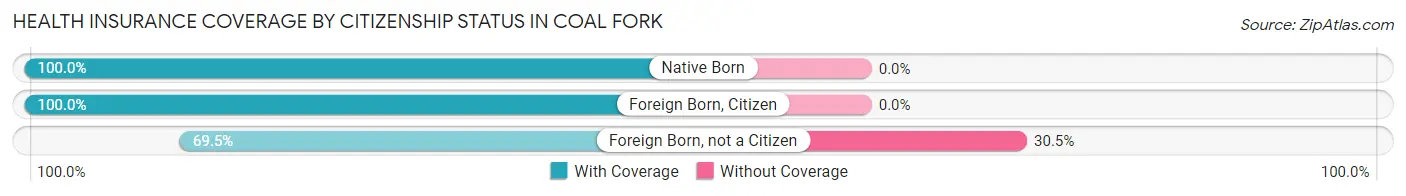
| Citizenship Status | With Coverage | Without Coverage |
| Native Born | 77 (100.0%) | 0 (0.0%) |
| Foreign Born, Citizen | 51 (100.0%) | 0 (0.0%) |
| Foreign Born, not a Citizen | 132 (69.5%) | 58 (30.5%) |
Health Insurance Coverage by Household Income in Coal Fork
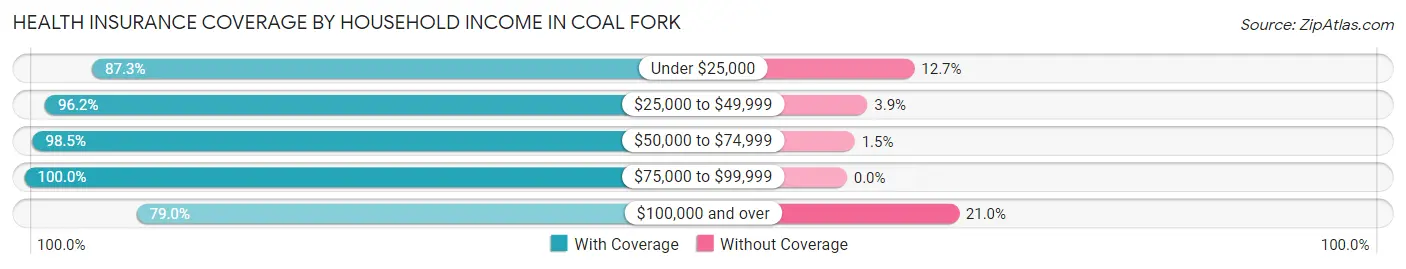
| Household Income | With Coverage | Without Coverage |
| Under $25,000 | 138 (87.3%) | 20 (12.7%) |
| $25,000 to $49,999 | 175 (96.2%) | 7 (3.8%) |
| $50,000 to $74,999 | 528 (98.5%) | 8 (1.5%) |
| $75,000 to $99,999 | 159 (100.0%) | 0 (0.0%) |
| $100,000 and over | 192 (79.0%) | 51 (21.0%) |
Public vs Private Health Insurance Coverage by Age in Coal Fork
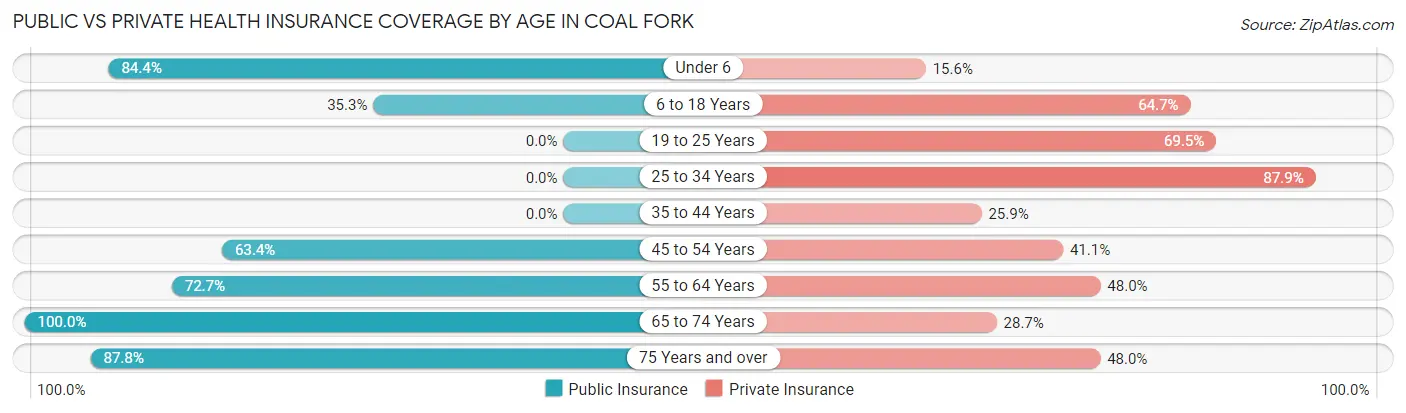
| Age Bracket | Public Insurance | Private Insurance |
| Under 6 | 65 (84.4%) | 12 (15.6%) |
| 6 to 18 Years | 18 (35.3%) | 33 (64.7%) |
| 19 to 25 Years | 0 (0.0%) | 132 (69.5%) |
| 25 to 34 Years | 0 (0.0%) | 51 (87.9%) |
| 35 to 44 Years | 0 (0.0%) | 7 (25.9%) |
| 45 to 54 Years | 287 (63.4%) | 186 (41.1%) |
| 55 to 64 Years | 109 (72.7%) | 72 (48.0%) |
| 65 to 74 Years | 174 (100.0%) | 50 (28.7%) |
| 75 Years and over | 86 (87.8%) | 47 (48.0%) |
| Total | 739 (57.8%) | 590 (46.2%) |
Disability Status by Sex by Age in Coal Fork
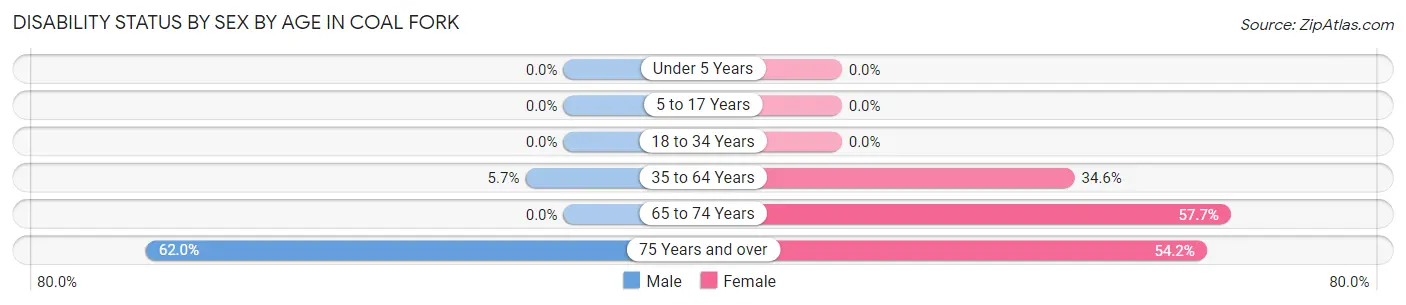
| Age Bracket | Male | Female |
| Under 5 Years | 0 (0.0%) | 0 (0.0%) |
| 5 to 17 Years | 0 (0.0%) | 0 (0.0%) |
| 18 to 34 Years | 0 (0.0%) | 0 (0.0%) |
| 35 to 64 Years | 25 (5.7%) | 65 (34.6%) |
| 65 to 74 Years | 0 (0.0%) | 97 (57.7%) |
| 75 Years and over | 31 (62.0%) | 26 (54.2%) |
Disability Class by Sex by Age in Coal Fork
Disability Class: Hearing Difficulty
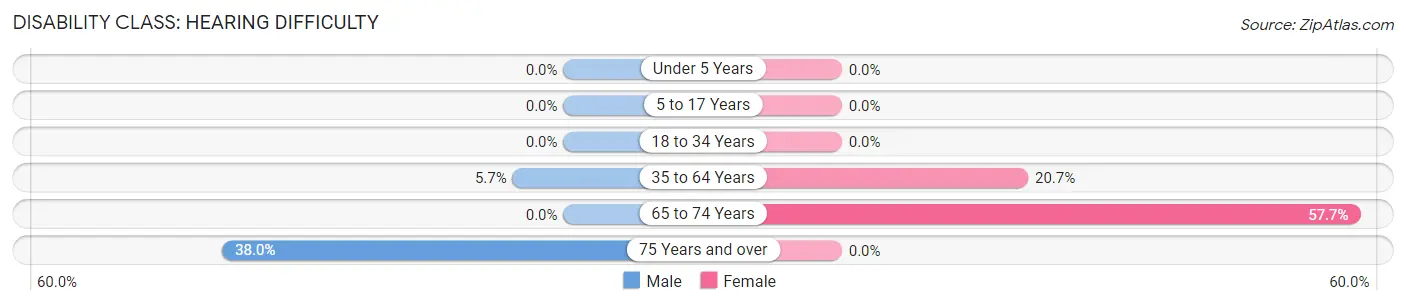
| Age Bracket | Male | Female |
| Under 5 Years | 0 (0.0%) | 0 (0.0%) |
| 5 to 17 Years | 0 (0.0%) | 0 (0.0%) |
| 18 to 34 Years | 0 (0.0%) | 0 (0.0%) |
| 35 to 64 Years | 25 (5.7%) | 39 (20.7%) |
| 65 to 74 Years | 0 (0.0%) | 97 (57.7%) |
| 75 Years and over | 19 (38.0%) | 0 (0.0%) |
Disability Class: Vision Difficulty
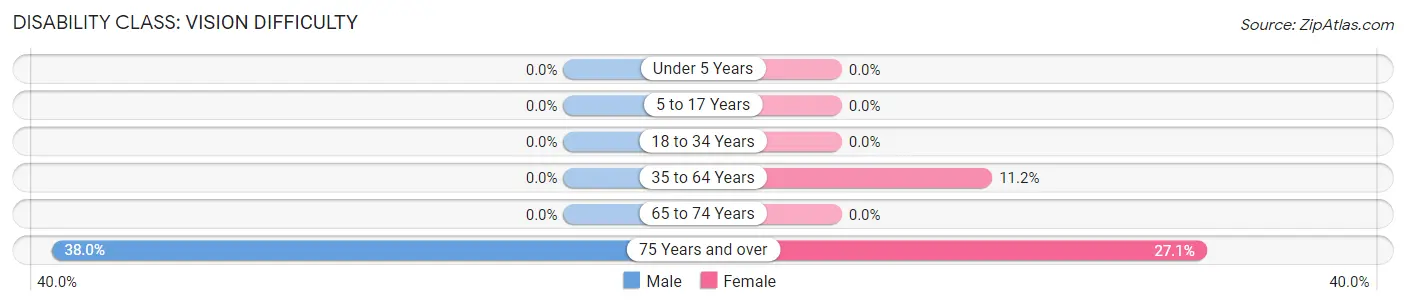
| Age Bracket | Male | Female |
| Under 5 Years | 0 (0.0%) | 0 (0.0%) |
| 5 to 17 Years | 0 (0.0%) | 0 (0.0%) |
| 18 to 34 Years | 0 (0.0%) | 0 (0.0%) |
| 35 to 64 Years | 0 (0.0%) | 21 (11.2%) |
| 65 to 74 Years | 0 (0.0%) | 0 (0.0%) |
| 75 Years and over | 19 (38.0%) | 13 (27.1%) |
Disability Class: Cognitive Difficulty
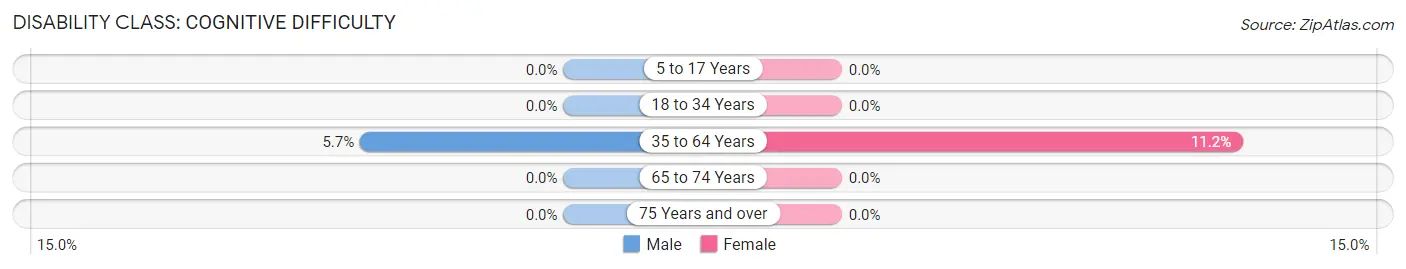
| Age Bracket | Male | Female |
| 5 to 17 Years | 0 (0.0%) | 0 (0.0%) |
| 18 to 34 Years | 0 (0.0%) | 0 (0.0%) |
| 35 to 64 Years | 25 (5.7%) | 21 (11.2%) |
| 65 to 74 Years | 0 (0.0%) | 0 (0.0%) |
| 75 Years and over | 0 (0.0%) | 0 (0.0%) |
Disability Class: Ambulatory Difficulty
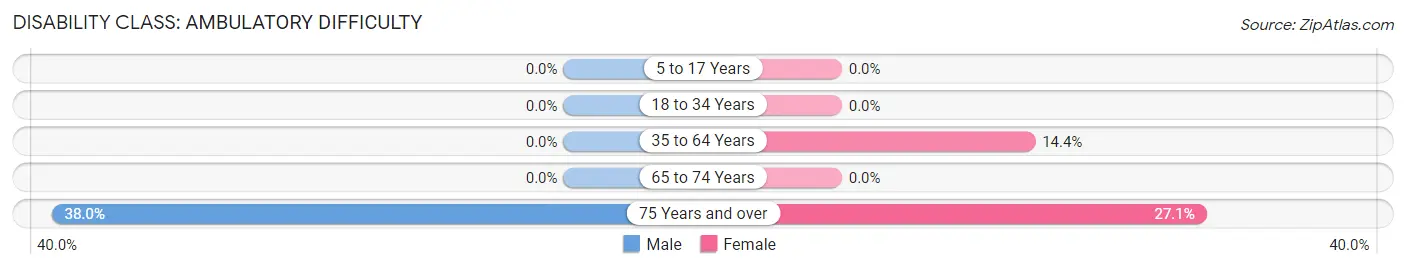
| Age Bracket | Male | Female |
| 5 to 17 Years | 0 (0.0%) | 0 (0.0%) |
| 18 to 34 Years | 0 (0.0%) | 0 (0.0%) |
| 35 to 64 Years | 0 (0.0%) | 27 (14.4%) |
| 65 to 74 Years | 0 (0.0%) | 0 (0.0%) |
| 75 Years and over | 19 (38.0%) | 13 (27.1%) |
Disability Class: Self-Care Difficulty
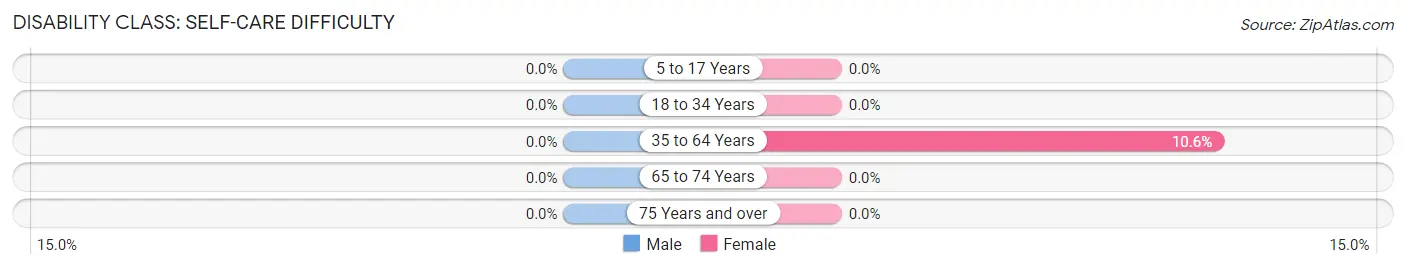
| Age Bracket | Male | Female |
| 5 to 17 Years | 0 (0.0%) | 0 (0.0%) |
| 18 to 34 Years | 0 (0.0%) | 0 (0.0%) |
| 35 to 64 Years | 0 (0.0%) | 20 (10.6%) |
| 65 to 74 Years | 0 (0.0%) | 0 (0.0%) |
| 75 Years and over | 0 (0.0%) | 0 (0.0%) |
Technology Access in Coal Fork
Computing Device Access in Coal Fork
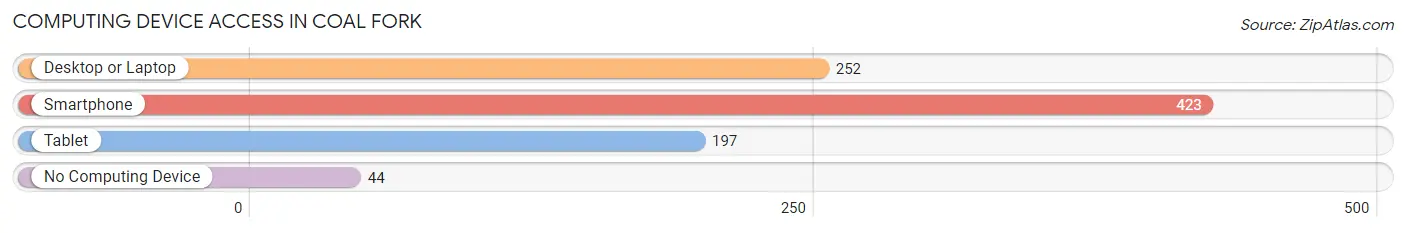
| Device Type | # Households | % Households |
| Desktop or Laptop | 252 | 48.6% |
| Smartphone | 423 | 81.7% |
| Tablet | 197 | 38.0% |
| No Computing Device | 44 | 8.5% |
| Total | 518 | 100.0% |
Internet Access in Coal Fork
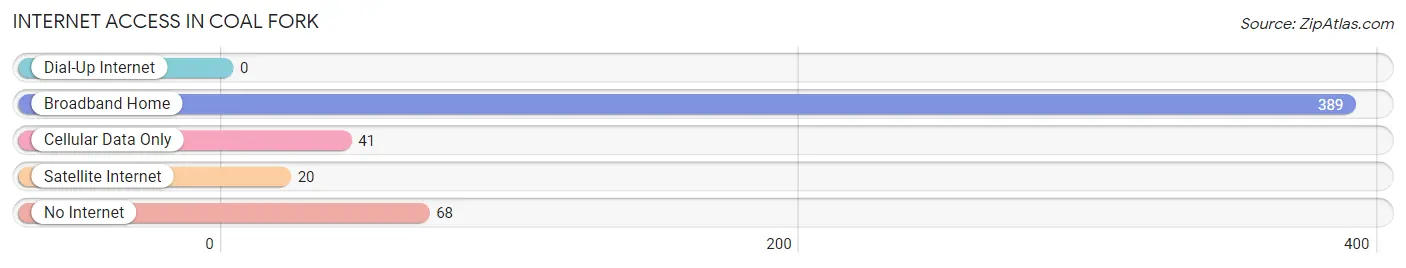
| Internet Type | # Households | % Households |
| Dial-Up Internet | 0 | 0.0% |
| Broadband Home | 389 | 75.1% |
| Cellular Data Only | 41 | 7.9% |
| Satellite Internet | 20 | 3.9% |
| No Internet | 68 | 13.1% |
| Total | 518 | 100.0% |
Coal Fork Summary
Coal Fork is an unincorporated community located in Kanawha County, West Virginia. It is situated along the Coal River, a tributary of the Kanawha River. The community is located in the Appalachian Mountains and is part of the Coal River Valley.
History
Coal Fork was first settled in the late 1700s by settlers from the eastern part of the state. The area was known for its coal mining and timber industry. The first coal mine in the area was opened in 1820. The coal industry grew rapidly in the area and by the late 1800s, Coal Fork was a thriving coal mining town. The town was home to several coal companies, including the Coal Fork Coal Company, the Coal Fork Coal and Coke Company, and the Coal Fork Coal and Iron Company.
The town was also home to several churches, including the Coal Fork Methodist Church, the Coal Fork Baptist Church, and the Coal Fork Presbyterian Church. The town also had a school, a post office, and a general store.
Geography
Coal Fork is located in the Appalachian Mountains in Kanawha County, West Virginia. The community is situated along the Coal River, a tributary of the Kanawha River. The town is located in the Coal River Valley, which is known for its coal mining and timber industry. The area is also known for its scenic beauty and outdoor recreation opportunities.
The town is located approximately 25 miles south of Charleston, the state capital. The nearest major city is Huntington, which is located approximately 50 miles to the east.
Economy
The economy of Coal Fork is largely based on the coal mining and timber industries. The town is home to several coal companies, including the Coal Fork Coal Company, the Coal Fork Coal and Coke Company, and the Coal Fork Coal and Iron Company. The town is also home to several timber companies, including the Coal Fork Lumber Company and the Coal Fork Timber Company.
The town is also home to several small businesses, including a general store, a post office, and several restaurants. The town is also home to several churches, including the Coal Fork Methodist Church, the Coal Fork Baptist Church, and the Coal Fork Presbyterian Church.
Demographics
As of the 2010 census, the population of Coal Fork was 1,093. The racial makeup of the town was 97.3% White, 0.9% African American, 0.2% Native American, 0.2% Asian, 0.1% Pacific Islander, and 0.3% from other races. The median household income was $30,938, and the median family income was $35,625. The per capita income was $14,945.
Conclusion
Coal Fork is an unincorporated community located in Kanawha County, West Virginia. It is situated along the Coal River, a tributary of the Kanawha River. The community is located in the Appalachian Mountains and is part of the Coal River Valley. The economy of Coal Fork is largely based on the coal mining and timber industries. As of the 2010 census, the population of Coal Fork was 1,093. The racial makeup of the town was 97.3% White, 0.9% African American, 0.2% Native American, 0.2% Asian, 0.1% Pacific Islander, and 0.3% from other races. The median household income was $30,938, and the median family income was $35,625. The per capita income was $14,945.
Common Questions
What is Per Capita Income in Coal Fork?
Per Capita income in Coal Fork is $30,044.
What is the Median Family Income in Coal Fork?
Median Family Income in Coal Fork is $60,812.
What is the Median Household income in Coal Fork?
Median Household Income in Coal Fork is $60,534.
What is Income or Wage Gap in Coal Fork?
Income or Wage Gap in Coal Fork is 31.3%.
Women in Coal Fork earn 68.7 cents for every dollar earned by a man.
What is Inequality or Gini Index in Coal Fork?
Inequality or Gini Index in Coal Fork is 0.42.
What is the Total Population of Coal Fork?
Total Population of Coal Fork is 1,278.
What is the Total Male Population of Coal Fork?
Total Male Population of Coal Fork is 598.
What is the Total Female Population of Coal Fork?
Total Female Population of Coal Fork is 680.
What is the Ratio of Males per 100 Females in Coal Fork?
There are 87.94 Males per 100 Females in Coal Fork.
What is the Ratio of Females per 100 Males in Coal Fork?
There are 113.71 Females per 100 Males in Coal Fork.
What is the Median Population Age in Coal Fork?
Median Population Age in Coal Fork is 49.5 Years.
What is the Average Family Size in Coal Fork
Average Family Size in Coal Fork is 2.8 People.
What is the Average Household Size in Coal Fork
Average Household Size in Coal Fork is 2.5 People.
How Large is the Labor Force in Coal Fork?
There are 759 People in the Labor Forcein in Coal Fork.
What is the Percentage of People in the Labor Force in Coal Fork?
66.0% of People are in the Labor Force in Coal Fork.
What is the Unemployment Rate in Coal Fork?
Unemployment Rate in Coal Fork is 34.0%.