Wellsburg, WV Map & Demographics
Wellsburg Map
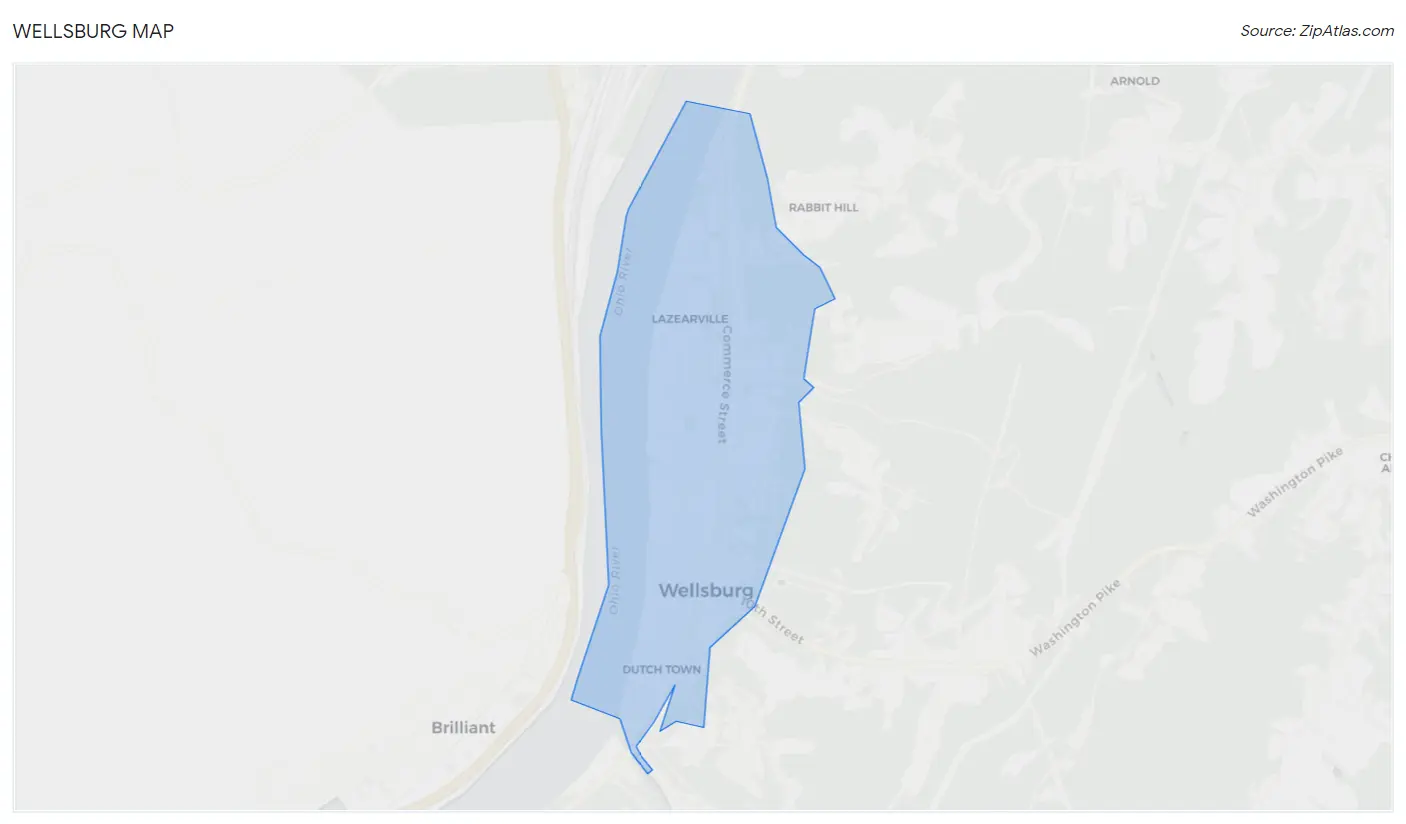
Wellsburg Overview
$27,197
PER CAPITA INCOME
$41,861
AVG FAMILY INCOME
$39,000
AVG HOUSEHOLD INCOME
30.5%
WAGE / INCOME GAP [ % ]
69.5¢/ $1
WAGE / INCOME GAP [ $ ]
0.42
INEQUALITY / GINI INDEX
2,180
TOTAL POPULATION
1,132
MALE POPULATION
1,048
FEMALE POPULATION
108.02
MALES / 100 FEMALES
92.58
FEMALES / 100 MALES
59.3
MEDIAN AGE
2.5
AVG FAMILY SIZE
1.9
AVG HOUSEHOLD SIZE
974
LABOR FORCE [ PEOPLE ]
47.2%
PERCENT IN LABOR FORCE
13.1%
UNEMPLOYMENT RATE
Wellsburg Zip Codes
Wellsburg Area Codes
Income in Wellsburg
Income Overview in Wellsburg
Per Capita Income in Wellsburg is $27,197, while median incomes of families and households are $41,861 and $39,000 respectively.
| Characteristic | Number | Measure |
| Per Capita Income | 2,180 | $27,197 |
| Median Family Income | 651 | $41,861 |
| Mean Family Income | 651 | $60,992 |
| Median Household Income | 1,116 | $39,000 |
| Mean Household Income | 1,116 | $51,450 |
| Income Deficit | 651 | $0 |
| Wage / Income Gap (%) | 2,180 | 30.54% |
| Wage / Income Gap ($) | 2,180 | 69.46¢ per $1 |
| Gini / Inequality Index | 2,180 | 0.42 |
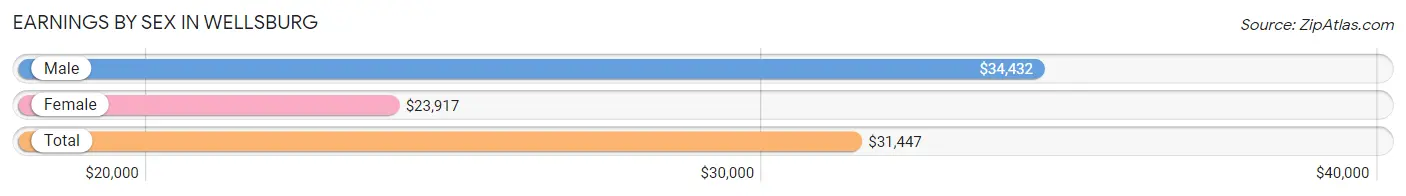
Earnings by Sex in Wellsburg
Average Earnings in Wellsburg are $31,447, $34,432 for men and $23,917 for women, a difference of 30.5%.
| Sex | Number | Average Earnings |
| Male | 533 (54.7%) | $34,432 |
| Female | 441 (45.3%) | $23,917 |
| Total | 974 (100.0%) | $31,447 |
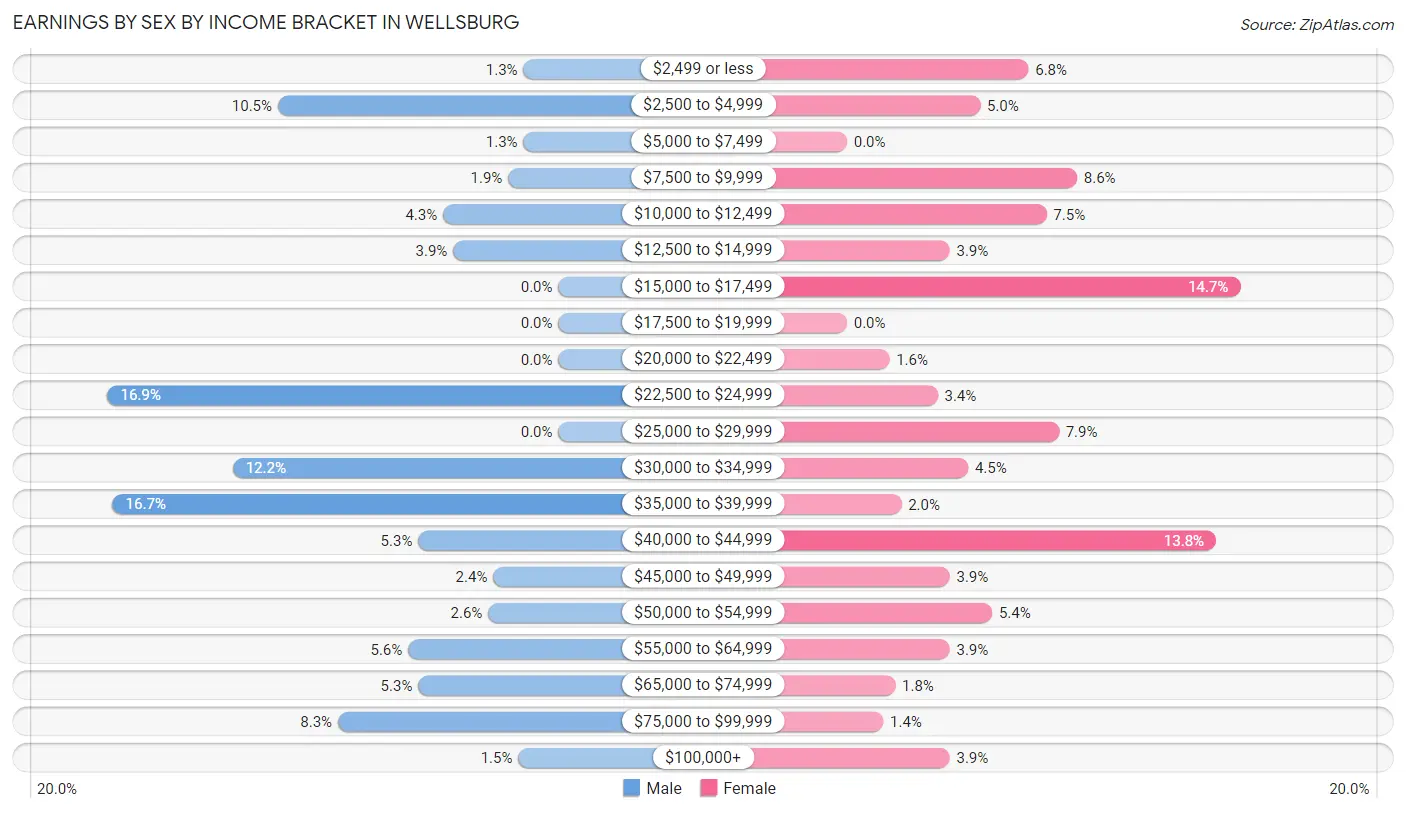
Earnings by Sex by Income Bracket in Wellsburg
The most common earnings brackets in Wellsburg are $22,500 to $24,999 for men (90 | 16.9%) and $15,000 to $17,499 for women (65 | 14.7%).
| Income | Male | Female |
| $2,499 or less | 7 (1.3%) | 30 (6.8%) |
| $2,500 to $4,999 | 56 (10.5%) | 22 (5.0%) |
| $5,000 to $7,499 | 7 (1.3%) | 0 (0.0%) |
| $7,500 to $9,999 | 10 (1.9%) | 38 (8.6%) |
| $10,000 to $12,499 | 23 (4.3%) | 33 (7.5%) |
| $12,500 to $14,999 | 21 (3.9%) | 17 (3.8%) |
| $15,000 to $17,499 | 0 (0.0%) | 65 (14.7%) |
| $17,500 to $19,999 | 0 (0.0%) | 0 (0.0%) |
| $20,000 to $22,499 | 0 (0.0%) | 7 (1.6%) |
| $22,500 to $24,999 | 90 (16.9%) | 15 (3.4%) |
| $25,000 to $29,999 | 0 (0.0%) | 35 (7.9%) |
| $30,000 to $34,999 | 65 (12.2%) | 20 (4.5%) |
| $35,000 to $39,999 | 89 (16.7%) | 9 (2.0%) |
| $40,000 to $44,999 | 28 (5.2%) | 61 (13.8%) |
| $45,000 to $49,999 | 13 (2.4%) | 17 (3.8%) |
| $50,000 to $54,999 | 14 (2.6%) | 24 (5.4%) |
| $55,000 to $64,999 | 30 (5.6%) | 17 (3.8%) |
| $65,000 to $74,999 | 28 (5.2%) | 8 (1.8%) |
| $75,000 to $99,999 | 44 (8.3%) | 6 (1.4%) |
| $100,000+ | 8 (1.5%) | 17 (3.8%) |
| Total | 533 (100.0%) | 441 (100.0%) |
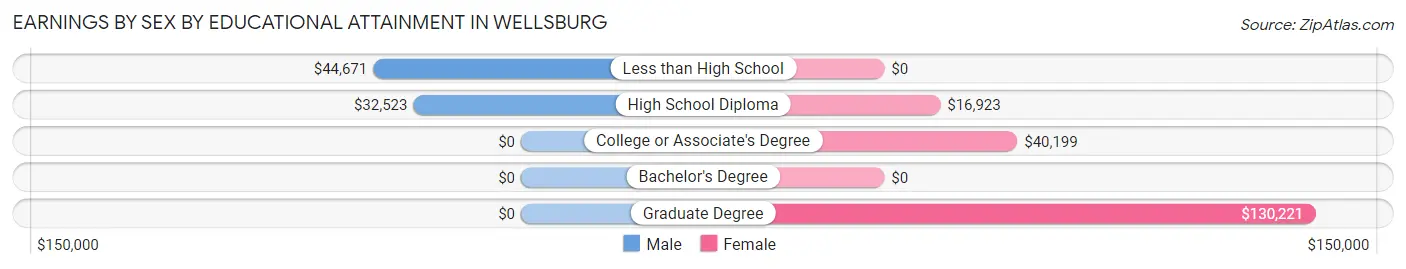
Earnings by Sex by Educational Attainment in Wellsburg
Average earnings in Wellsburg are $33,909 for men and $23,500 for women, a difference of 30.7%. Men with an educational attainment of less than high school enjoy the highest average annual earnings of $44,671, while those with high school diploma education earn the least with $32,523. Women with an educational attainment of graduate degree earn the most with the average annual earnings of $130,221, while those with high school diploma education have the smallest earnings of $16,923.
| Educational Attainment | Male Income | Female Income |
| Less than High School | $44,671 | $0 |
| High School Diploma | $32,523 | $16,923 |
| College or Associate's Degree | - | - |
| Bachelor's Degree | - | - |
| Graduate Degree | - | - |
| Total | $33,909 | $23,500 |
Family Income in Wellsburg
Family Income Brackets in Wellsburg
According to the Wellsburg family income data, there are 136 families falling into the $15,000 to $24,999 income range, which is the most common income bracket and makes up 20.9% of all families.
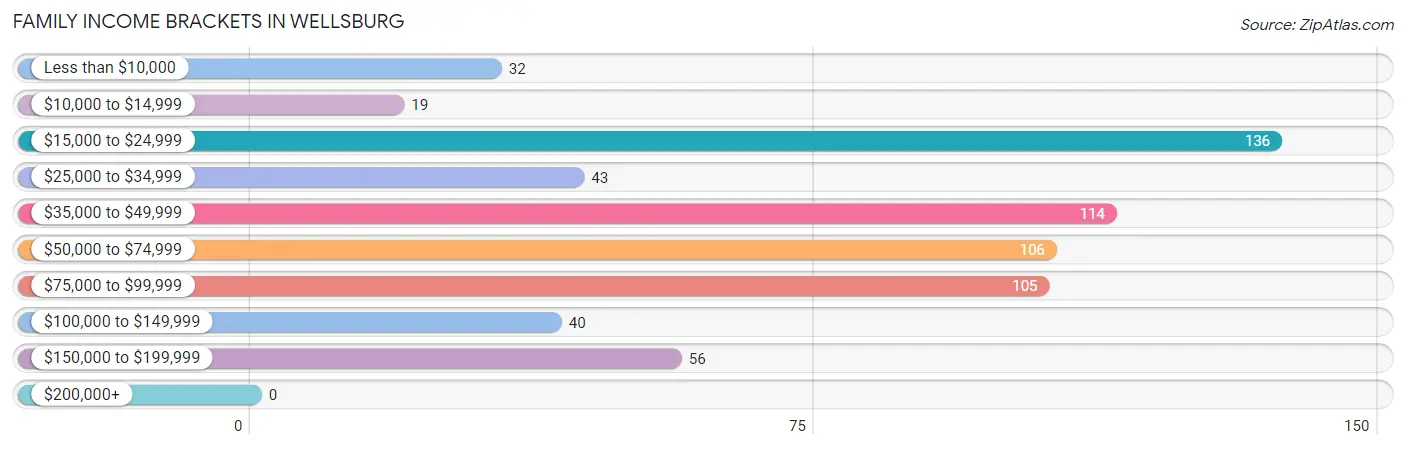
| Income Bracket | # Families | % Families |
| Less than $10,000 | 32 | 4.9% |
| $10,000 to $14,999 | 19 | 2.9% |
| $15,000 to $24,999 | 136 | 20.9% |
| $25,000 to $34,999 | 43 | 6.6% |
| $35,000 to $49,999 | 114 | 17.5% |
| $50,000 to $74,999 | 106 | 16.3% |
| $75,000 to $99,999 | 105 | 16.1% |
| $100,000 to $149,999 | 40 | 6.1% |
| $150,000 to $199,999 | 56 | 8.6% |
| $200,000+ | 0 | 0.0% |
Family Income by Famaliy Size in Wellsburg
3-person families (129 | 19.8%) account for the highest median family income in Wellsburg with $86,688 per family, while 3-person families (129 | 19.8%) have the highest median income of $28,896 per family member.
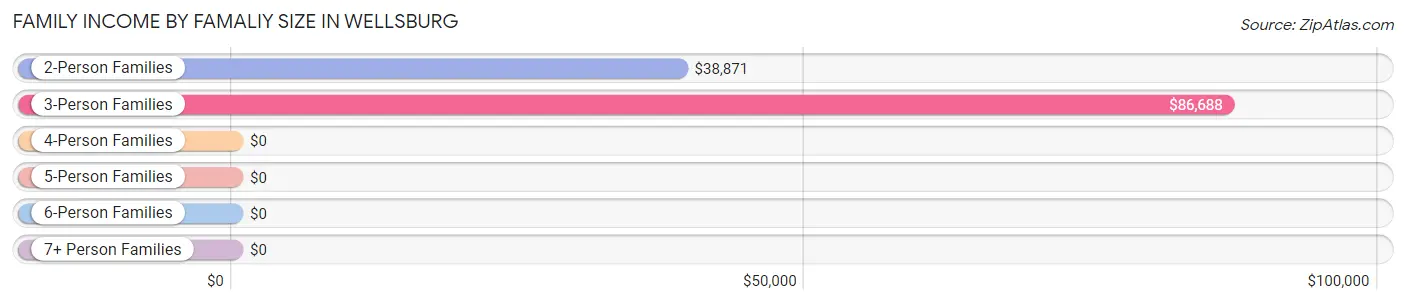
| Income Bracket | # Families | Median Income |
| 2-Person Families | 468 (71.9%) | $38,871 |
| 3-Person Families | 129 (19.8%) | $86,688 |
| 4-Person Families | 54 (8.3%) | $0 |
| 5-Person Families | 0 (0.0%) | $0 |
| 6-Person Families | 0 (0.0%) | $0 |
| 7+ Person Families | 0 (0.0%) | $0 |
| Total | 651 (100.0%) | $41,861 |
Family Income by Number of Earners in Wellsburg
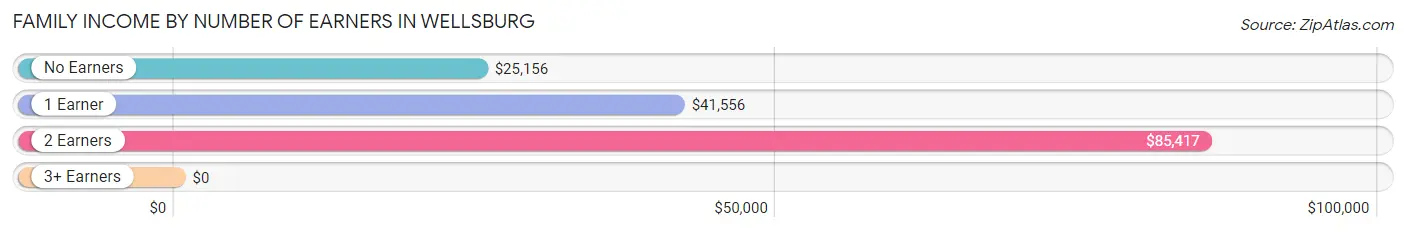
| Number of Earners | # Families | Median Income |
| No Earners | 151 (23.2%) | $25,156 |
| 1 Earner | 348 (53.5%) | $41,556 |
| 2 Earners | 152 (23.4%) | $85,417 |
| 3+ Earners | 0 (0.0%) | $0 |
| Total | 651 (100.0%) | $41,861 |
Household Income in Wellsburg
Household Income Brackets in Wellsburg
With 224 households falling in the category, the $35,000 to $49,999 income range is the most frequent in Wellsburg, accounting for 20.1% of all households.
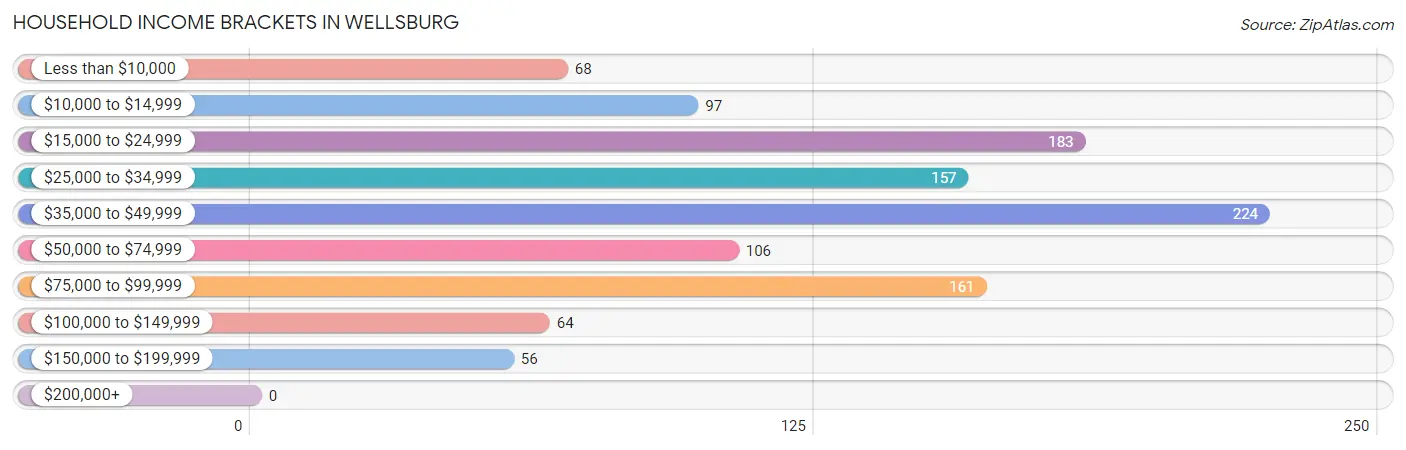
| Income Bracket | # Households | % Households |
| Less than $10,000 | 68 | 6.1% |
| $10,000 to $14,999 | 97 | 8.7% |
| $15,000 to $24,999 | 183 | 16.4% |
| $25,000 to $34,999 | 157 | 14.1% |
| $35,000 to $49,999 | 224 | 20.1% |
| $50,000 to $74,999 | 106 | 9.5% |
| $75,000 to $99,999 | 161 | 14.4% |
| $100,000 to $149,999 | 64 | 5.7% |
| $150,000 to $199,999 | 56 | 5.0% |
| $200,000+ | 0 | 0.0% |
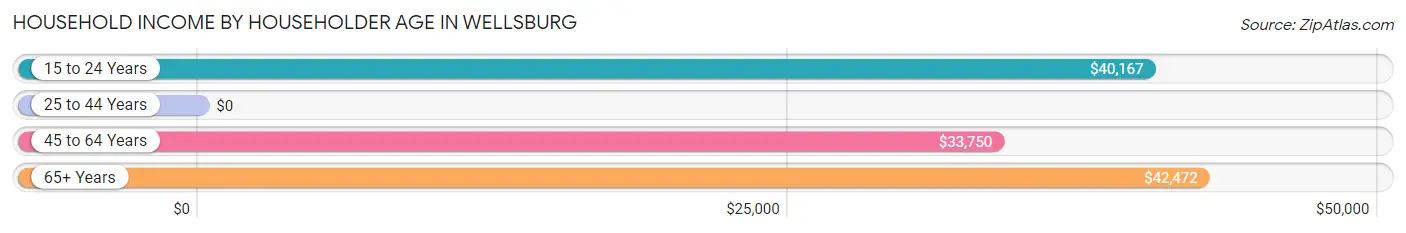
Household Income by Householder Age in Wellsburg
The median household income in Wellsburg is $39,000, with the highest median household income of $42,472 found in the 65+ years age bracket for the primary householder. A total of 503 households (45.1%) fall into this category. Meanwhile, the 25 to 44 years age bracket for the primary householder has the lowest median household income of $0, with 204 households (18.3%) in this group.
| Income Bracket | # Households | Median Income |
| 15 to 24 Years | 54 (4.8%) | $40,167 |
| 25 to 44 Years | 204 (18.3%) | $0 |
| 45 to 64 Years | 355 (31.8%) | $33,750 |
| 65+ Years | 503 (45.1%) | $42,472 |
| Total | 1,116 (100.0%) | $39,000 |
Poverty in Wellsburg
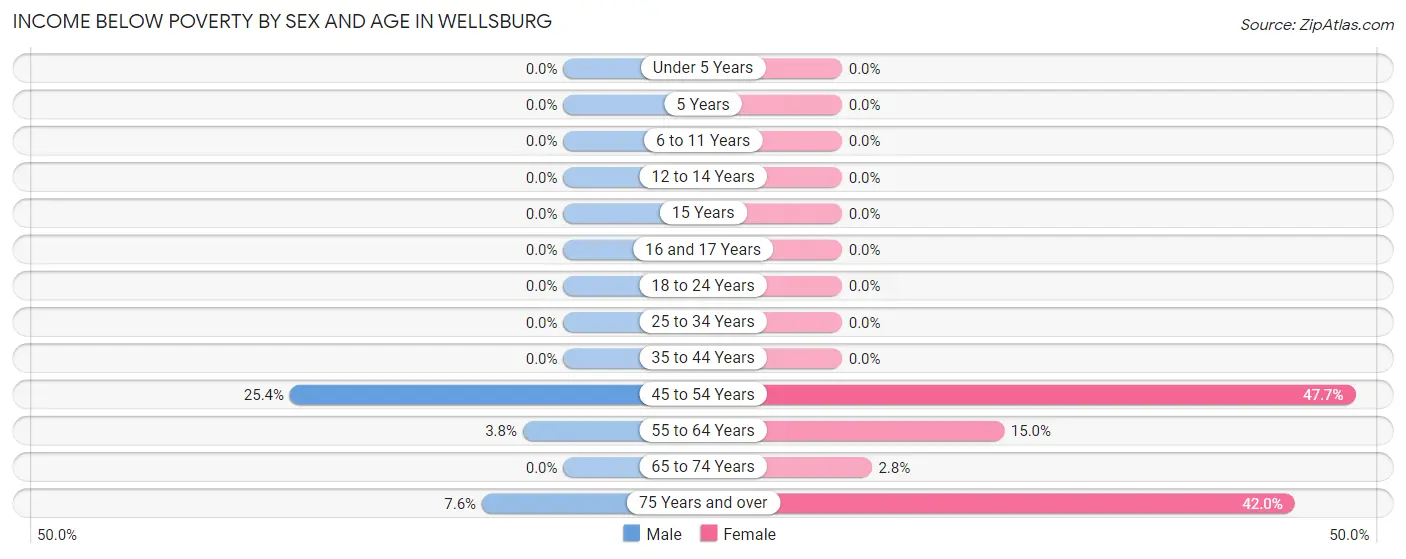
Income Below Poverty by Sex and Age in Wellsburg
With 5.8% poverty level for males and 17.9% for females among the residents of Wellsburg, 45 to 54 year old males and 45 to 54 year old females are the most vulnerable to poverty, with 50 males (25.4%) and 61 females (47.7%) in their respective age groups living below the poverty level.
| Age Bracket | Male | Female |
| Under 5 Years | 0 (0.0%) | 0 (0.0%) |
| 5 Years | 0 (0.0%) | 0 (0.0%) |
| 6 to 11 Years | 0 (0.0%) | 0 (0.0%) |
| 12 to 14 Years | 0 (0.0%) | 0 (0.0%) |
| 15 Years | 0 (0.0%) | 0 (0.0%) |
| 16 and 17 Years | 0 (0.0%) | 0 (0.0%) |
| 18 to 24 Years | 0 (0.0%) | 0 (0.0%) |
| 25 to 34 Years | 0 (0.0%) | 0 (0.0%) |
| 35 to 44 Years | 0 (0.0%) | 0 (0.0%) |
| 45 to 54 Years | 50 (25.4%) | 61 (47.7%) |
| 55 to 64 Years | 7 (3.8%) | 20 (15.0%) |
| 65 to 74 Years | 0 (0.0%) | 7 (2.8%) |
| 75 Years and over | 9 (7.6%) | 100 (42.0%) |
| Total | 66 (5.8%) | 188 (17.9%) |
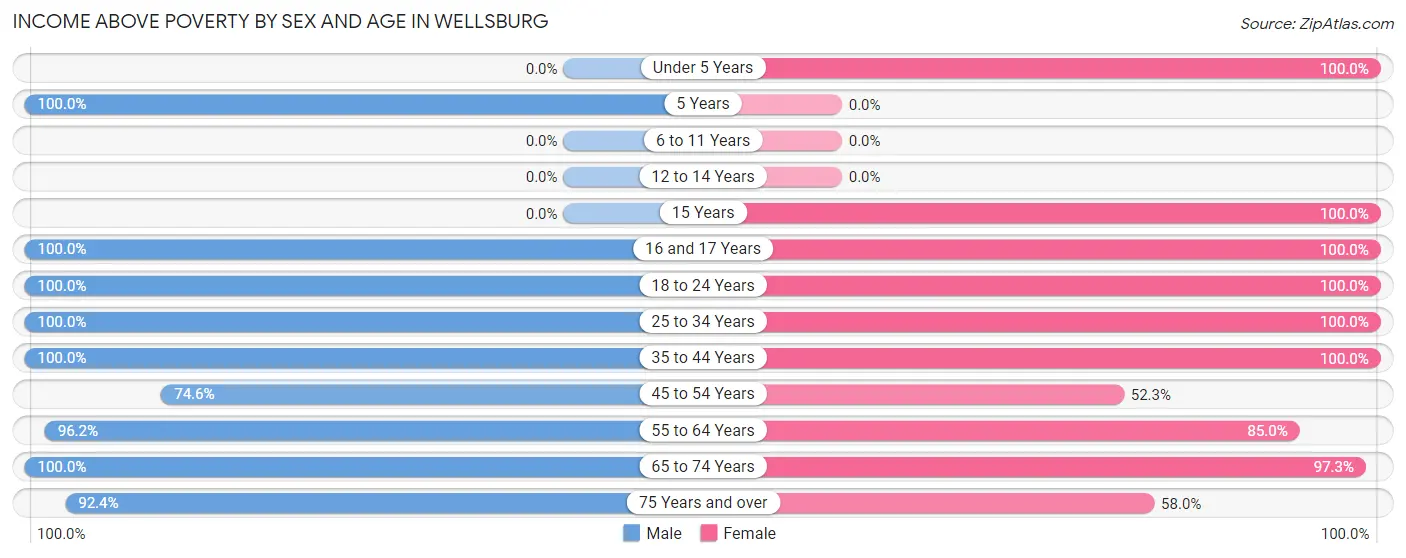
Income Above Poverty by Sex and Age in Wellsburg
According to the poverty statistics in Wellsburg, males aged 5 years and females aged under 5 years are the age groups that are most secure financially, with 100.0% of males and 100.0% of females in these age groups living above the poverty line.
| Age Bracket | Male | Female |
| Under 5 Years | 0 (0.0%) | 14 (100.0%) |
| 5 Years | 82 (100.0%) | 0 (0.0%) |
| 6 to 11 Years | 0 (0.0%) | 0 (0.0%) |
| 12 to 14 Years | 0 (0.0%) | 0 (0.0%) |
| 15 Years | 0 (0.0%) | 20 (100.0%) |
| 16 and 17 Years | 12 (100.0%) | 32 (100.0%) |
| 18 to 24 Years | 52 (100.0%) | 57 (100.0%) |
| 25 to 34 Years | 80 (100.0%) | 100 (100.0%) |
| 35 to 44 Years | 108 (100.0%) | 71 (100.0%) |
| 45 to 54 Years | 147 (74.6%) | 67 (52.3%) |
| 55 to 64 Years | 179 (96.2%) | 113 (85.0%) |
| 65 to 74 Years | 296 (100.0%) | 248 (97.3%) |
| 75 Years and over | 110 (92.4%) | 138 (58.0%) |
| Total | 1,066 (94.2%) | 860 (82.1%) |
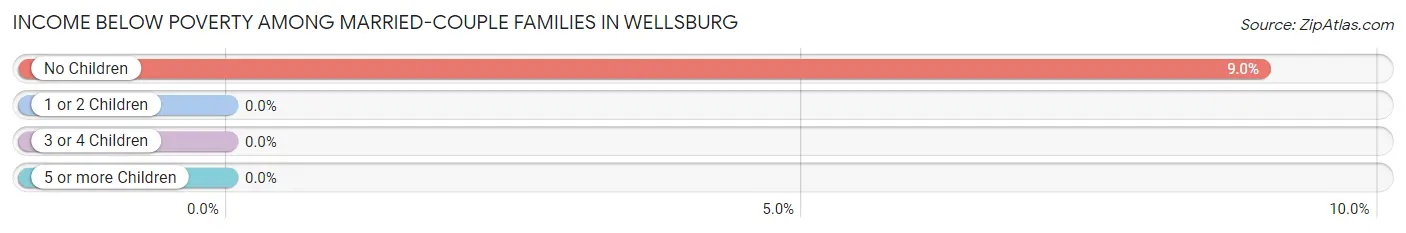
Income Below Poverty Among Married-Couple Families in Wellsburg
The poverty statistics for married-couple families in Wellsburg show that 7.8% or 32 of the total 410 families live below the poverty line. Families with no children have the highest poverty rate of 9.0%, comprising of 32 families. On the other hand, families with 1 or 2 children have the lowest poverty rate of 0.0%, which includes 0 families.
| Children | Above Poverty | Below Poverty |
| No Children | 324 (91.0%) | 32 (9.0%) |
| 1 or 2 Children | 54 (100.0%) | 0 (0.0%) |
| 3 or 4 Children | 0 (0.0%) | 0 (0.0%) |
| 5 or more Children | 0 (0.0%) | 0 (0.0%) |
| Total | 378 (92.2%) | 32 (7.8%) |
Income Below Poverty Among Single-Parent Households in Wellsburg
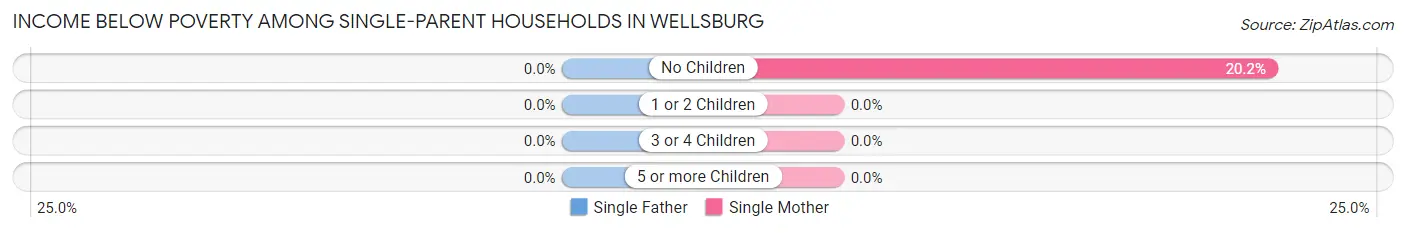
| Children | Single Father | Single Mother |
| No Children | 0 (0.0%) | 19 (20.2%) |
| 1 or 2 Children | 0 (0.0%) | 0 (0.0%) |
| 3 or 4 Children | 0 (0.0%) | 0 (0.0%) |
| 5 or more Children | 0 (0.0%) | 0 (0.0%) |
| Total | 0 (0.0%) | 19 (15.3%) |
Income Below Poverty Among Married-Couple vs Single-Parent Households in Wellsburg
The poverty data for Wellsburg shows that 32 of the married-couple family households (7.8%) and 19 of the single-parent households (7.9%) are living below the poverty level. Within the married-couple family households, those with no children have the highest poverty rate, with 32 households (9.0%) falling below the poverty line. Among the single-parent households, those with no children have the highest poverty rate, with 19 household (14.7%) living below poverty.
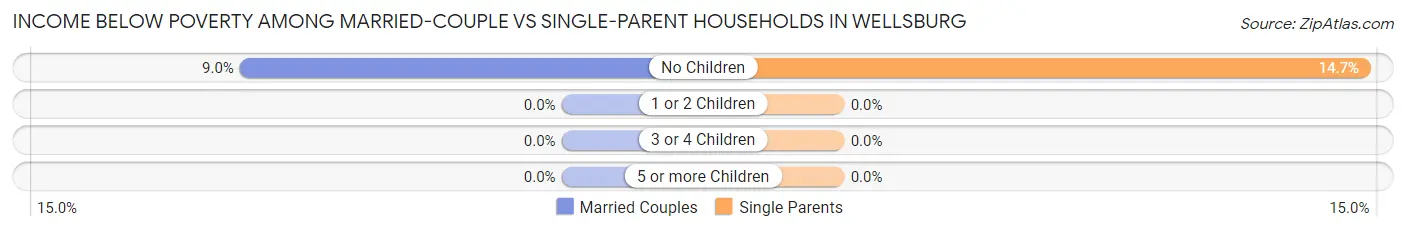
| Children | Married-Couple Families | Single-Parent Households |
| No Children | 32 (9.0%) | 19 (14.7%) |
| 1 or 2 Children | 0 (0.0%) | 0 (0.0%) |
| 3 or 4 Children | 0 (0.0%) | 0 (0.0%) |
| 5 or more Children | 0 (0.0%) | 0 (0.0%) |
| Total | 32 (7.8%) | 19 (7.9%) |
Race in Wellsburg
The most populous races in Wellsburg are White / Caucasian (2,103 | 96.5%), Two or more Races (60 | 2.8%), and Hispanic or Latino (44 | 2.0%).
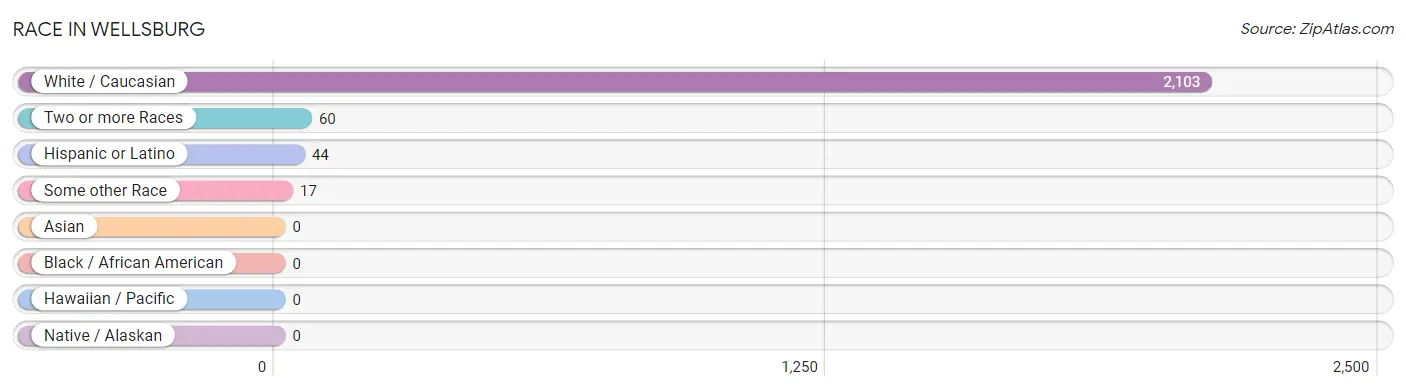
| Race | # Population | % Population |
| Asian | 0 | 0.0% |
| Black / African American | 0 | 0.0% |
| Hawaiian / Pacific | 0 | 0.0% |
| Hispanic or Latino | 44 | 2.0% |
| Native / Alaskan | 0 | 0.0% |
| White / Caucasian | 2,103 | 96.5% |
| Two or more Races | 60 | 2.8% |
| Some other Race | 17 | 0.8% |
| Total | 2,180 | 100.0% |
Ancestry in Wellsburg
The most populous ancestries reported in Wellsburg are Italian (550 | 25.2%), German (401 | 18.4%), English (340 | 15.6%), Irish (229 | 10.5%), and American (138 | 6.3%), together accounting for 76.1% of all Wellsburg residents.
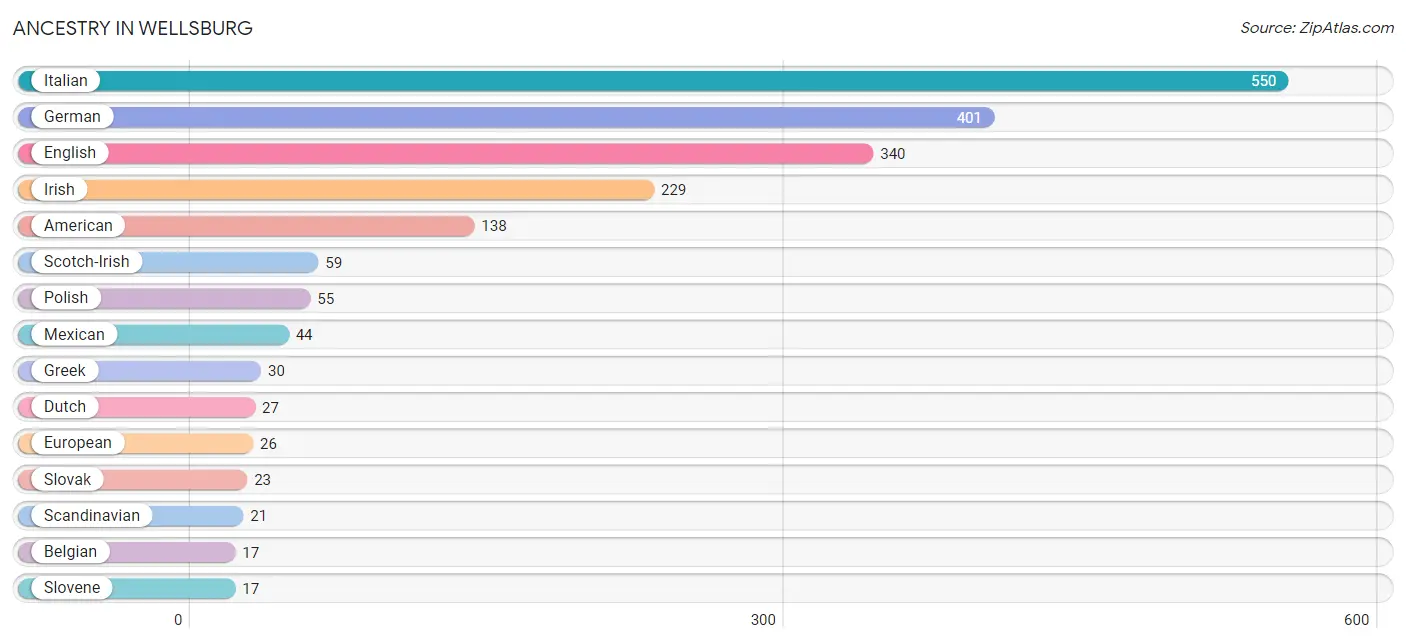
| Ancestry | # Population | % Population |
| American | 138 | 6.3% |
| Austrian | 7 | 0.3% |
| Belgian | 17 | 0.8% |
| Cherokee | 7 | 0.3% |
| Dutch | 27 | 1.2% |
| English | 340 | 15.6% |
| European | 26 | 1.2% |
| German | 401 | 18.4% |
| Greek | 30 | 1.4% |
| Hungarian | 9 | 0.4% |
| Irish | 229 | 10.5% |
| Italian | 550 | 25.2% |
| Mexican | 44 | 2.0% |
| Polish | 55 | 2.5% |
| Russian | 16 | 0.7% |
| Scandinavian | 21 | 1.0% |
| Scotch-Irish | 59 | 2.7% |
| Scottish | 7 | 0.3% |
| Slovak | 23 | 1.1% |
| Slovene | 17 | 0.8% | View All 20 Rows |
Immigrants in Wellsburg

| Immigration Origin | # Population | % Population | View All 0 Rows |
Sex and Age in Wellsburg
Sex and Age in Wellsburg
The most populous age groups in Wellsburg are 70 to 74 Years (182 | 16.1%) for men and 65 to 69 Years (153 | 14.6%) for women.
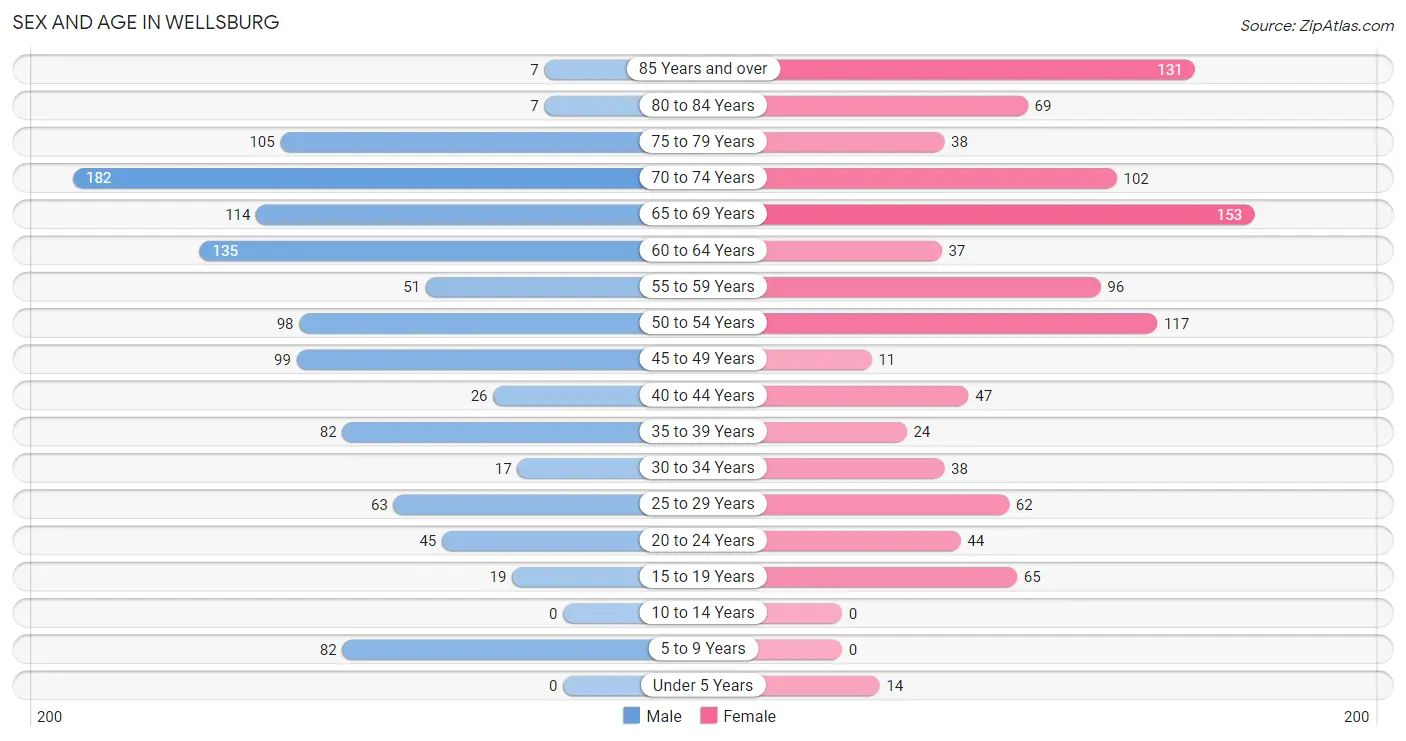
| Age Bracket | Male | Female |
| Under 5 Years | 0 (0.0%) | 14 (1.3%) |
| 5 to 9 Years | 82 (7.2%) | 0 (0.0%) |
| 10 to 14 Years | 0 (0.0%) | 0 (0.0%) |
| 15 to 19 Years | 19 (1.7%) | 65 (6.2%) |
| 20 to 24 Years | 45 (4.0%) | 44 (4.2%) |
| 25 to 29 Years | 63 (5.6%) | 62 (5.9%) |
| 30 to 34 Years | 17 (1.5%) | 38 (3.6%) |
| 35 to 39 Years | 82 (7.2%) | 24 (2.3%) |
| 40 to 44 Years | 26 (2.3%) | 47 (4.5%) |
| 45 to 49 Years | 99 (8.7%) | 11 (1.1%) |
| 50 to 54 Years | 98 (8.7%) | 117 (11.2%) |
| 55 to 59 Years | 51 (4.5%) | 96 (9.2%) |
| 60 to 64 Years | 135 (11.9%) | 37 (3.5%) |
| 65 to 69 Years | 114 (10.1%) | 153 (14.6%) |
| 70 to 74 Years | 182 (16.1%) | 102 (9.7%) |
| 75 to 79 Years | 105 (9.3%) | 38 (3.6%) |
| 80 to 84 Years | 7 (0.6%) | 69 (6.6%) |
| 85 Years and over | 7 (0.6%) | 131 (12.5%) |
| Total | 1,132 (100.0%) | 1,048 (100.0%) |
Families and Households in Wellsburg
Median Family Size in Wellsburg
The median family size in Wellsburg is 2.45 persons per family, with married-couple families (410 | 63.0%) accounting for the largest median family size of 2.58 persons per family. On the other hand, single male/father families (117 | 18.0%) represent the smallest median family size with 2.05 persons per family.
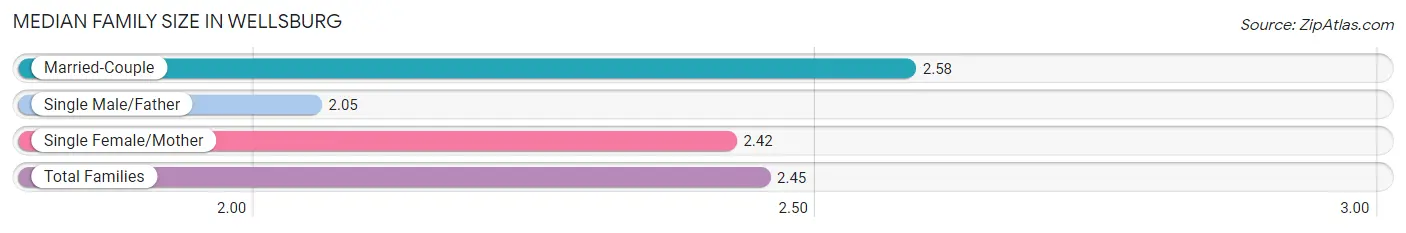
| Family Type | # Families | Family Size |
| Married-Couple | 410 (63.0%) | 2.58 |
| Single Male/Father | 117 (18.0%) | 2.05 |
| Single Female/Mother | 124 (19.1%) | 2.42 |
| Total Families | 651 (100.0%) | 2.45 |
Median Household Size in Wellsburg
The median household size in Wellsburg is 1.95 persons per household, with single female/mother households (124 | 11.1%) accounting for the largest median household size of 2.69 persons per household. non-family households (465 | 41.7%) represent the smallest median household size with 1.18 persons per household.
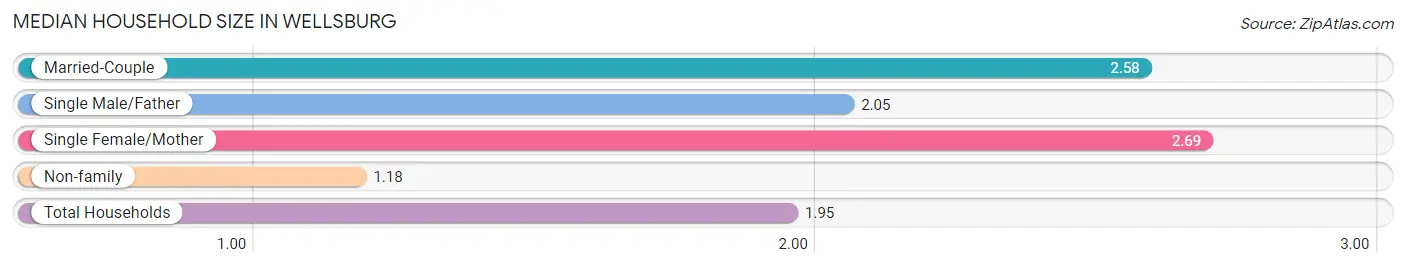
| Household Type | # Households | Household Size |
| Married-Couple | 410 (36.7%) | 2.58 |
| Single Male/Father | 117 (10.5%) | 2.05 |
| Single Female/Mother | 124 (11.1%) | 2.69 |
| Non-family | 465 (41.7%) | 1.18 |
| Total Households | 1,116 (100.0%) | 1.95 |
Household Size by Marriage Status in Wellsburg
Out of a total of 1,116 households in Wellsburg, 651 (58.3%) are family households, while 465 (41.7%) are nonfamily households. The most numerous type of family households are 2-person households, comprising 444, and the most common type of nonfamily households are 1-person households, comprising 388.
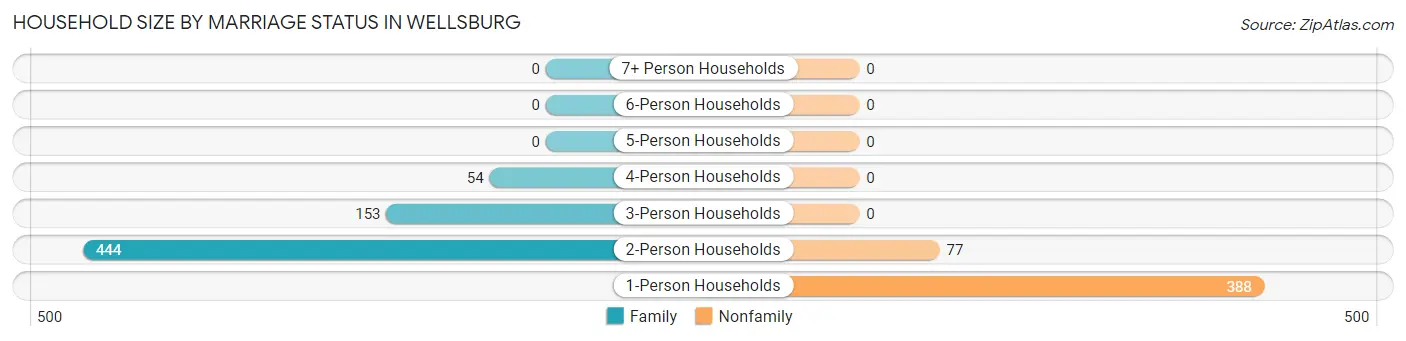
| Household Size | Family Households | Nonfamily Households |
| 1-Person Households | - | 388 (34.8%) |
| 2-Person Households | 444 (39.8%) | 77 (6.9%) |
| 3-Person Households | 153 (13.7%) | 0 (0.0%) |
| 4-Person Households | 54 (4.8%) | 0 (0.0%) |
| 5-Person Households | 0 (0.0%) | 0 (0.0%) |
| 6-Person Households | 0 (0.0%) | 0 (0.0%) |
| 7+ Person Households | 0 (0.0%) | 0 (0.0%) |
| Total | 651 (58.3%) | 465 (41.7%) |
Female Fertility in Wellsburg
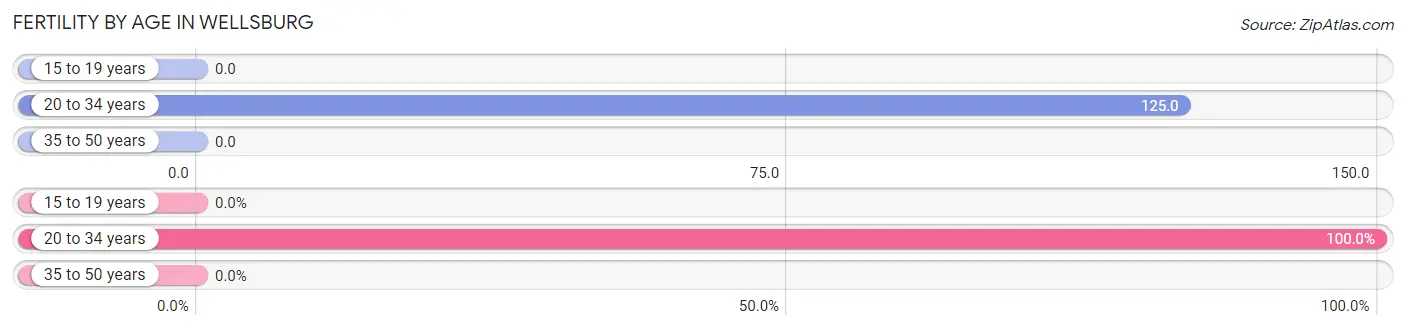
Fertility by Age in Wellsburg
Average fertility rate in Wellsburg is 62.0 births per 1,000 women. Women in the age bracket of 20 to 34 years have the highest fertility rate with 125.0 births per 1,000 women. Women in the age bracket of 20 to 34 years acount for 100.0% of all women with births.
| Age Bracket | Women with Births | Births / 1,000 Women |
| 15 to 19 years | 0 (0.0%) | 0.0 |
| 20 to 34 years | 18 (100.0%) | 125.0 |
| 35 to 50 years | 0 (0.0%) | 0.0 |
| Total | 18 (100.0%) | 62.0 |
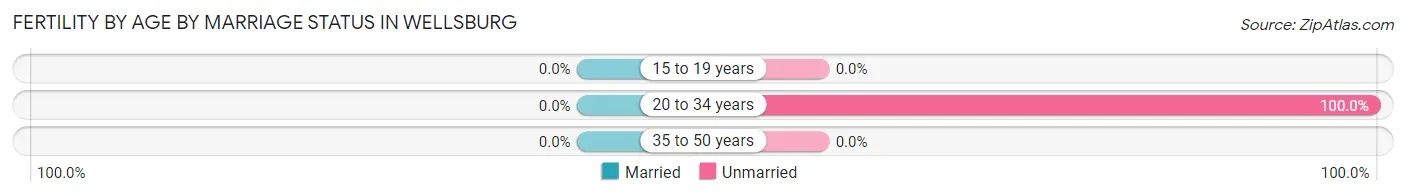
Fertility by Age by Marriage Status in Wellsburg
| Age Bracket | Married | Unmarried |
| 15 to 19 years | 0 (0.0%) | 0 (0.0%) |
| 20 to 34 years | 0 (0.0%) | 18 (100.0%) |
| 35 to 50 years | 0 (0.0%) | 0 (0.0%) |
| Total | 0 (0.0%) | 18 (100.0%) |
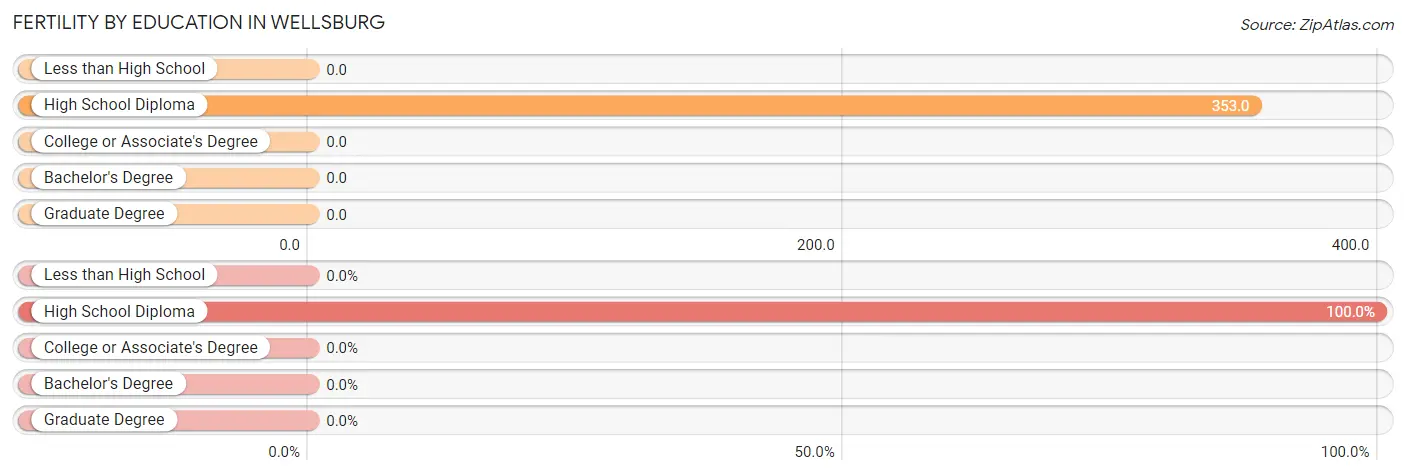
Fertility by Education in Wellsburg
| Educational Attainment | Women with Births | Births / 1,000 Women |
| Less than High School | 0 (0.0%) | 0.0 |
| High School Diploma | 18 (100.0%) | 353.0 |
| College or Associate's Degree | 0 (0.0%) | 0.0 |
| Bachelor's Degree | 0 (0.0%) | 0.0 |
| Graduate Degree | 0 (0.0%) | 0.0 |
| Total | 18 (100.0%) | 62.0 |
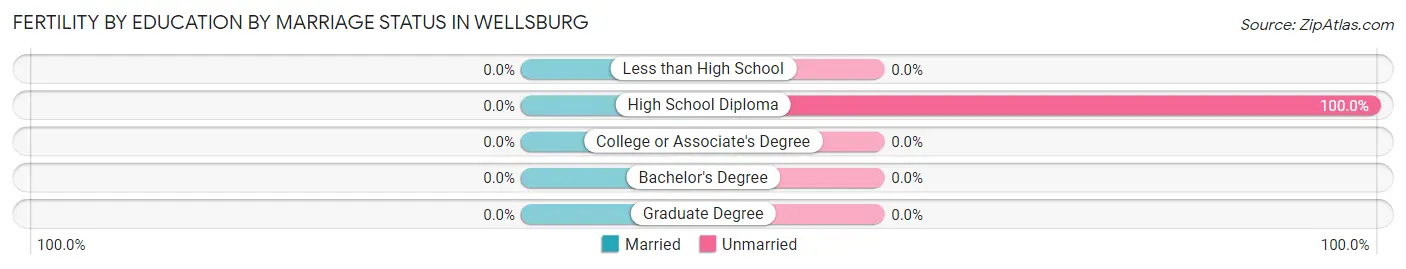
Fertility by Education by Marriage Status in Wellsburg
| Educational Attainment | Married | Unmarried |
| Less than High School | 0 (0.0%) | 0 (0.0%) |
| High School Diploma | 0 (0.0%) | 18 (100.0%) |
| College or Associate's Degree | 0 (0.0%) | 0 (0.0%) |
| Bachelor's Degree | 0 (0.0%) | 0 (0.0%) |
| Graduate Degree | 0 (0.0%) | 0 (0.0%) |
| Total | 0 (0.0%) | 18 (100.0%) |
Employment Characteristics in Wellsburg
Employment by Class of Employer in Wellsburg
Among the 764 employed individuals in Wellsburg, private company employees (345 | 45.2%), not-for-profit organizations (104 | 13.6%), and state government employees (94 | 12.3%) make up the most common classes of employment.
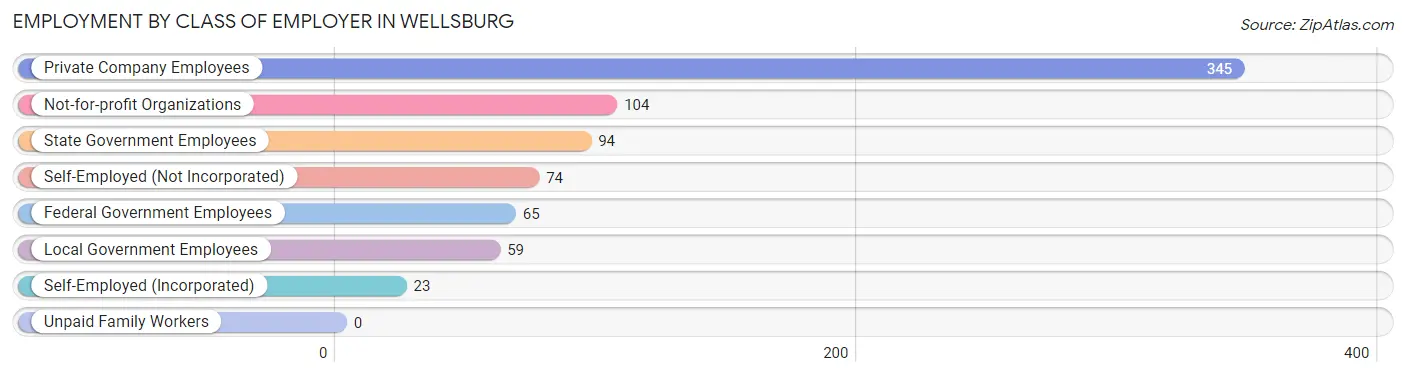
| Employer Class | # Employees | % Employees |
| Private Company Employees | 345 | 45.2% |
| Self-Employed (Incorporated) | 23 | 3.0% |
| Self-Employed (Not Incorporated) | 74 | 9.7% |
| Not-for-profit Organizations | 104 | 13.6% |
| Local Government Employees | 59 | 7.7% |
| State Government Employees | 94 | 12.3% |
| Federal Government Employees | 65 | 8.5% |
| Unpaid Family Workers | 0 | 0.0% |
| Total | 764 | 100.0% |
Employment Status by Age in Wellsburg
According to the labor force statistics for Wellsburg, out of the total population over 16 years of age (2,064), 47.2% or 974 individuals are in the labor force, with 13.1% or 128 of them unemployed. The age group with the highest labor force participation rate is 25 to 29 years, with 100.0% or 125 individuals in the labor force. Within the labor force, the 25 to 29 years age range has the highest percentage of unemployed individuals, with 44.8% or 56 of them being unemployed.
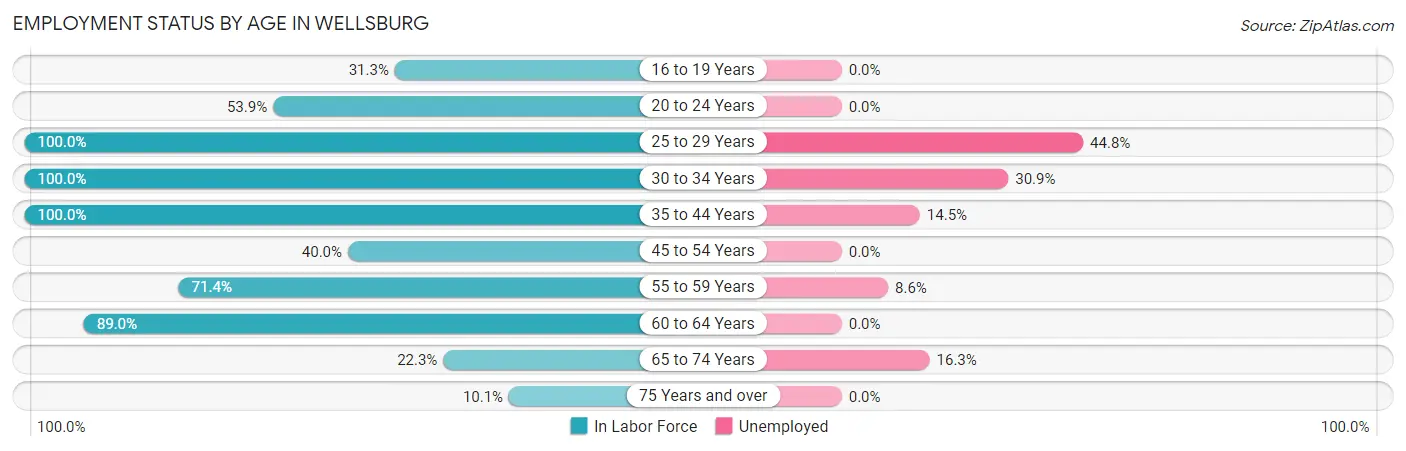
| Age Bracket | In Labor Force | Unemployed |
| 16 to 19 Years | 20 (31.3%) | 0 (0.0%) |
| 20 to 24 Years | 48 (53.9%) | 0 (0.0%) |
| 25 to 29 Years | 125 (100.0%) | 56 (44.8%) |
| 30 to 34 Years | 55 (100.0%) | 17 (30.9%) |
| 35 to 44 Years | 179 (100.0%) | 26 (14.5%) |
| 45 to 54 Years | 130 (40.0%) | 0 (0.0%) |
| 55 to 59 Years | 105 (71.4%) | 9 (8.6%) |
| 60 to 64 Years | 153 (89.0%) | 0 (0.0%) |
| 65 to 74 Years | 123 (22.3%) | 20 (16.3%) |
| 75 Years and over | 36 (10.1%) | 0 (0.0%) |
| Total | 974 (47.2%) | 128 (13.1%) |
Employment Status by Educational Attainment in Wellsburg
According to labor force statistics for Wellsburg, 74.5% of individuals (747) out of the total population between 25 and 64 years of age (1,003) are in the labor force, with 14.5% or 108 of them being unemployed. The group with the highest labor force participation rate are those with the educational attainment of high school diploma, with 81.5% or 318 individuals in the labor force. Within the labor force, individuals with college / associate degree education have the highest percentage of unemployment, with 26.0% or 56 of them being unemployed.
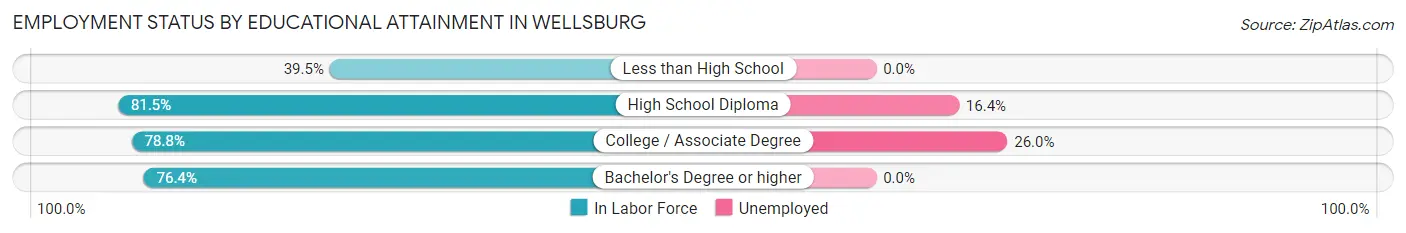
| Educational Attainment | In Labor Force | Unemployed |
| Less than High School | 49 (39.5%) | 0 (0.0%) |
| High School Diploma | 318 (81.5%) | 64 (16.4%) |
| College / Associate Degree | 215 (78.8%) | 71 (26.0%) |
| Bachelor's Degree or higher | 165 (76.4%) | 0 (0.0%) |
| Total | 747 (74.5%) | 145 (14.5%) |
Employment Occupations by Sex in Wellsburg
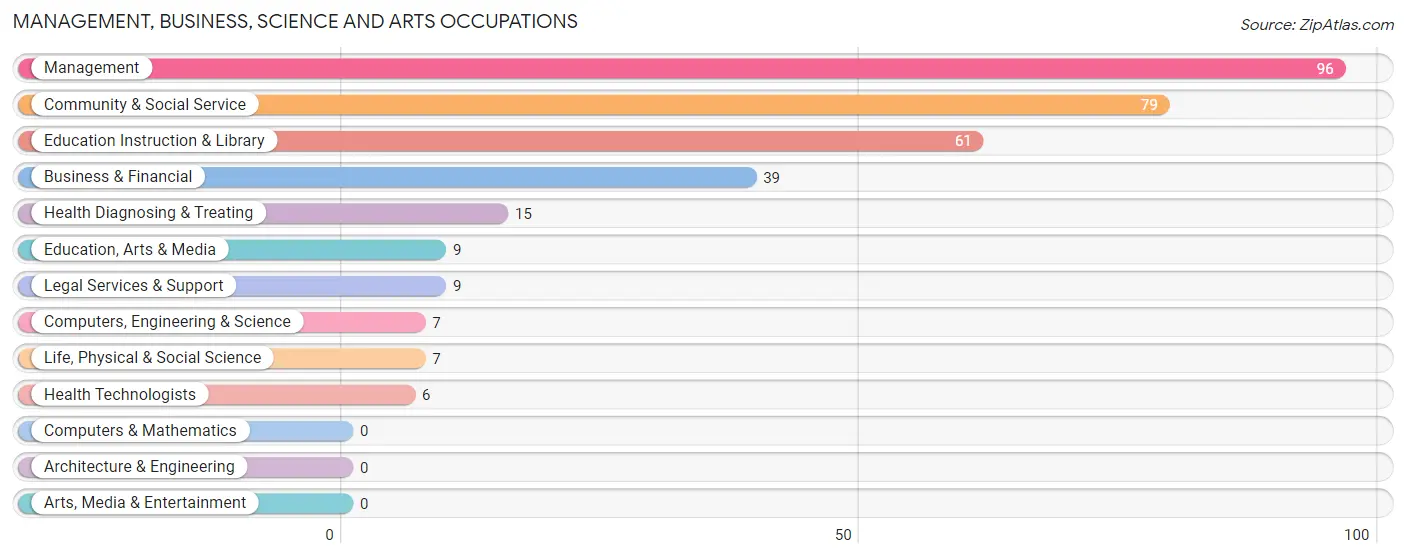
Management, Business, Science and Arts Occupations
The most common Management, Business, Science and Arts occupations in Wellsburg are Management (96 | 11.4%), Community & Social Service (79 | 9.3%), Education Instruction & Library (61 | 7.2%), Business & Financial (39 | 4.6%), and Health Diagnosing & Treating (15 | 1.8%).
Management, Business, Science and Arts Occupations by Sex
Within the Management, Business, Science and Arts occupations in Wellsburg, the most male-oriented occupations are Computers, Engineering & Science (100.0%), Life, Physical & Social Science (100.0%), and Business & Financial (79.5%), while the most female-oriented occupations are Management (100.0%), Education, Arts & Media (100.0%), and Legal Services & Support (100.0%).
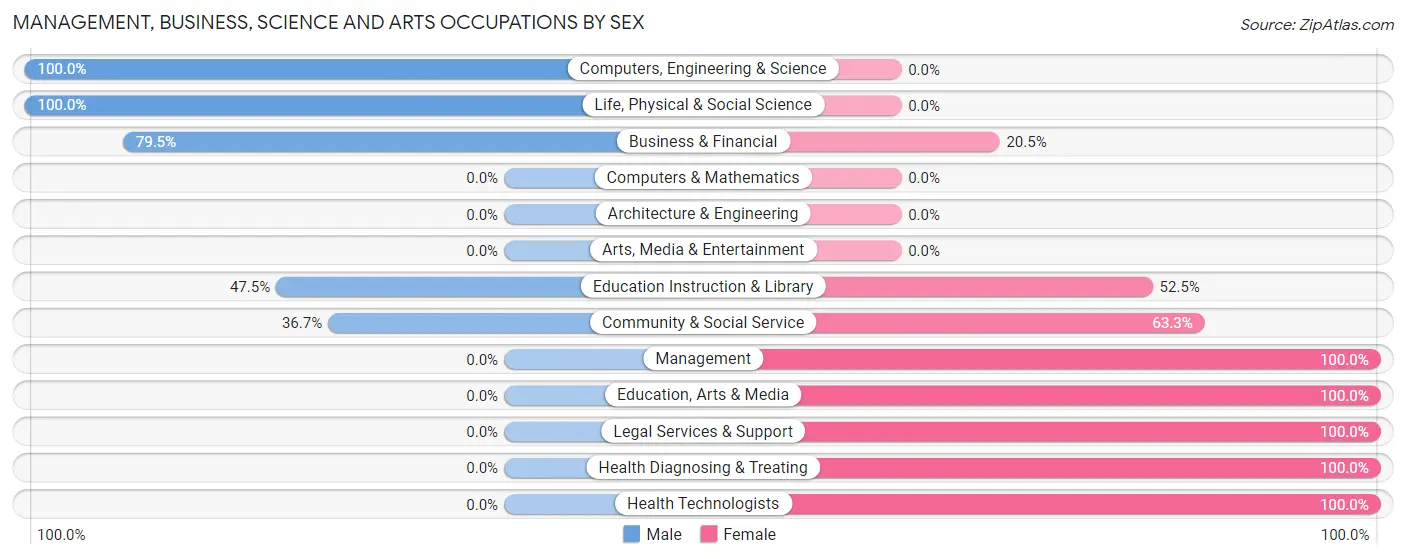
| Occupation | Male | Female |
| Management | 0 (0.0%) | 96 (100.0%) |
| Business & Financial | 31 (79.5%) | 8 (20.5%) |
| Computers, Engineering & Science | 7 (100.0%) | 0 (0.0%) |
| Computers & Mathematics | 0 (0.0%) | 0 (0.0%) |
| Architecture & Engineering | 0 (0.0%) | 0 (0.0%) |
| Life, Physical & Social Science | 7 (100.0%) | 0 (0.0%) |
| Community & Social Service | 29 (36.7%) | 50 (63.3%) |
| Education, Arts & Media | 0 (0.0%) | 9 (100.0%) |
| Legal Services & Support | 0 (0.0%) | 9 (100.0%) |
| Education Instruction & Library | 29 (47.5%) | 32 (52.5%) |
| Arts, Media & Entertainment | 0 (0.0%) | 0 (0.0%) |
| Health Diagnosing & Treating | 0 (0.0%) | 15 (100.0%) |
| Health Technologists | 0 (0.0%) | 6 (100.0%) |
| Total (Category) | 67 (28.4%) | 169 (71.6%) |
| Total (Overall) | 470 (55.6%) | 376 (44.4%) |
Services Occupations
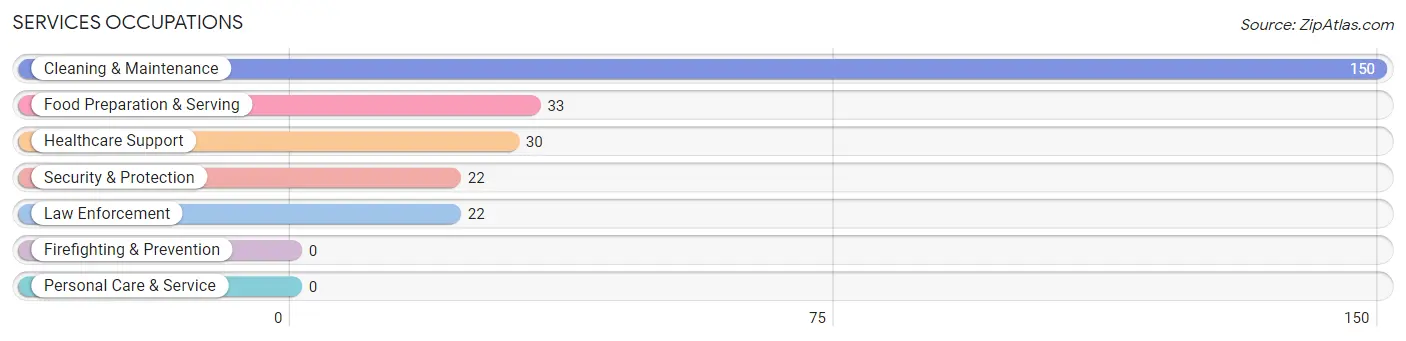
The most common Services occupations in Wellsburg are Cleaning & Maintenance (150 | 17.7%), Food Preparation & Serving (33 | 3.9%), Healthcare Support (30 | 3.5%), Security & Protection (22 | 2.6%), and Law Enforcement (22 | 2.6%).
Services Occupations by Sex
Within the Services occupations in Wellsburg, the most male-oriented occupations are Security & Protection (100.0%), Law Enforcement (100.0%), and Cleaning & Maintenance (67.3%), while the most female-oriented occupations are Healthcare Support (100.0%), Food Preparation & Serving (100.0%), and Cleaning & Maintenance (32.7%).
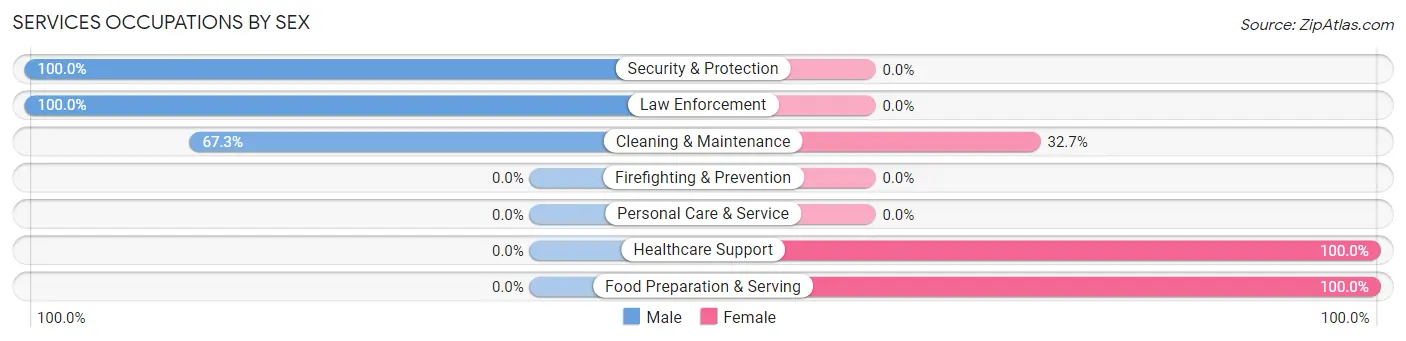
| Occupation | Male | Female |
| Healthcare Support | 0 (0.0%) | 30 (100.0%) |
| Security & Protection | 22 (100.0%) | 0 (0.0%) |
| Firefighting & Prevention | 0 (0.0%) | 0 (0.0%) |
| Law Enforcement | 22 (100.0%) | 0 (0.0%) |
| Food Preparation & Serving | 0 (0.0%) | 33 (100.0%) |
| Cleaning & Maintenance | 101 (67.3%) | 49 (32.7%) |
| Personal Care & Service | 0 (0.0%) | 0 (0.0%) |
| Total (Category) | 123 (52.3%) | 112 (47.7%) |
| Total (Overall) | 470 (55.6%) | 376 (44.4%) |
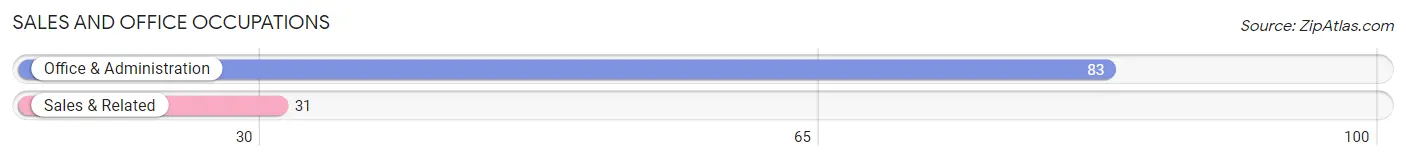
Sales and Office Occupations
The most common Sales and Office occupations in Wellsburg are Office & Administration (83 | 9.8%), and Sales & Related (31 | 3.7%).
Sales and Office Occupations by Sex
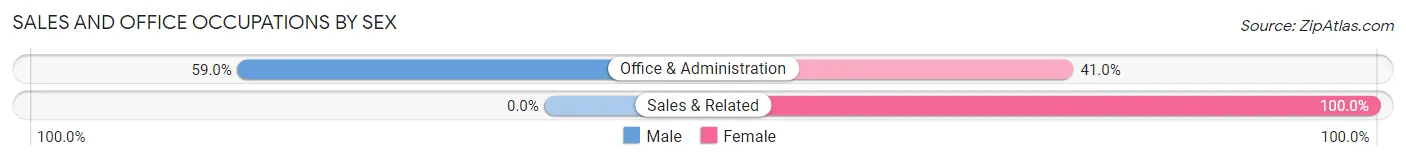
| Occupation | Male | Female |
| Sales & Related | 0 (0.0%) | 31 (100.0%) |
| Office & Administration | 49 (59.0%) | 34 (41.0%) |
| Total (Category) | 49 (43.0%) | 65 (57.0%) |
| Total (Overall) | 470 (55.6%) | 376 (44.4%) |
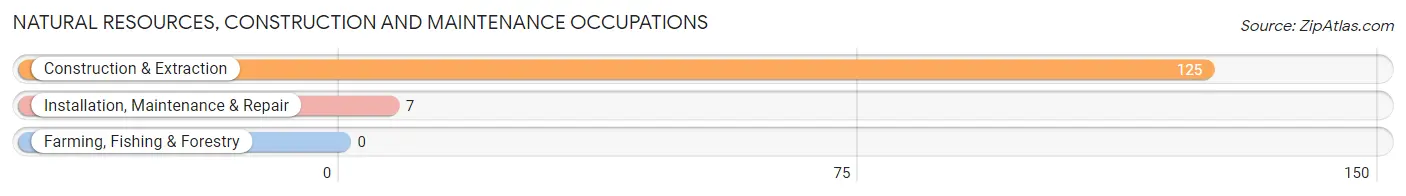
Natural Resources, Construction and Maintenance Occupations
The most common Natural Resources, Construction and Maintenance occupations in Wellsburg are Construction & Extraction (125 | 14.8%), and Installation, Maintenance & Repair (7 | 0.8%).
Natural Resources, Construction and Maintenance Occupations by Sex
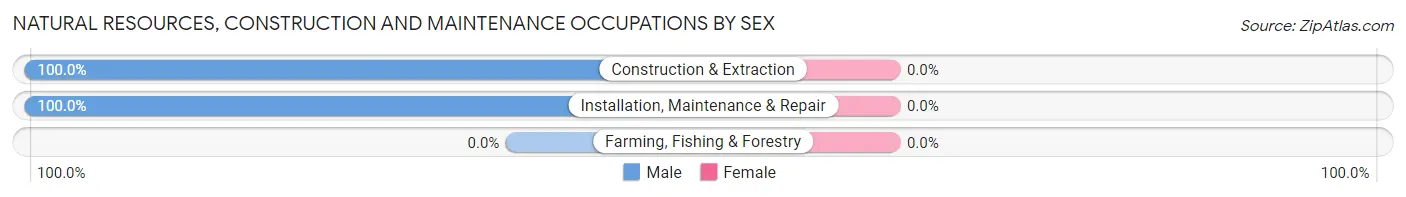
| Occupation | Male | Female |
| Farming, Fishing & Forestry | 0 (0.0%) | 0 (0.0%) |
| Construction & Extraction | 125 (100.0%) | 0 (0.0%) |
| Installation, Maintenance & Repair | 7 (100.0%) | 0 (0.0%) |
| Total (Category) | 132 (100.0%) | 0 (0.0%) |
| Total (Overall) | 470 (55.6%) | 376 (44.4%) |
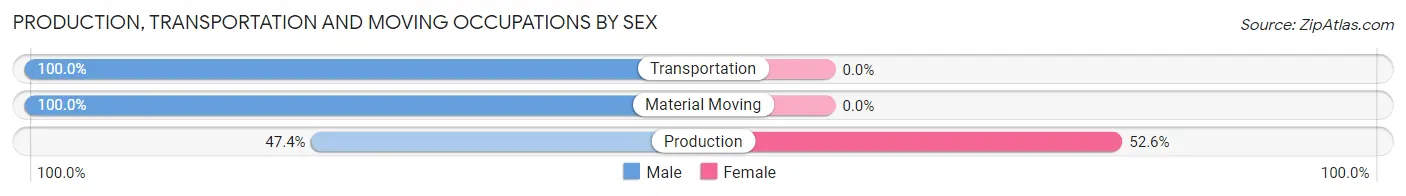
Production, Transportation and Moving Occupations
The most common Production, Transportation and Moving occupations in Wellsburg are Production (57 | 6.7%), Material Moving (42 | 5.0%), and Transportation (30 | 3.5%).
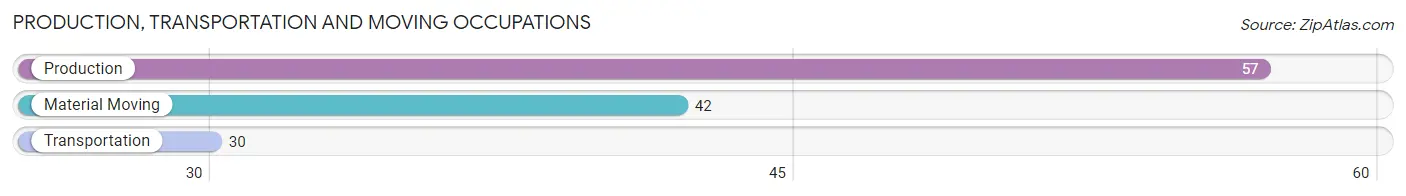
Production, Transportation and Moving Occupations by Sex
| Occupation | Male | Female |
| Production | 27 (47.4%) | 30 (52.6%) |
| Transportation | 30 (100.0%) | 0 (0.0%) |
| Material Moving | 42 (100.0%) | 0 (0.0%) |
| Total (Category) | 99 (76.7%) | 30 (23.3%) |
| Total (Overall) | 470 (55.6%) | 376 (44.4%) |
Employment Industries by Sex in Wellsburg
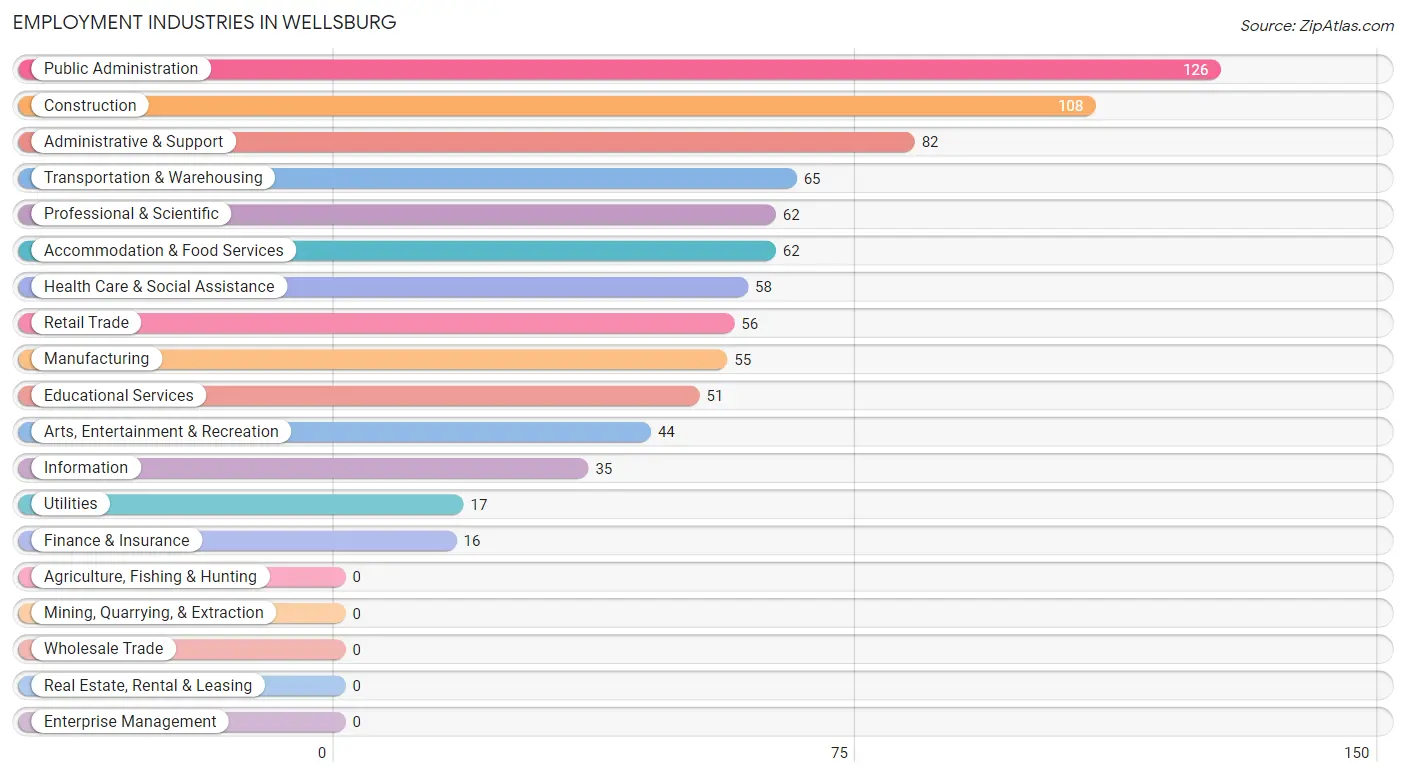
Employment Industries in Wellsburg
The major employment industries in Wellsburg include Public Administration (126 | 14.9%), Construction (108 | 12.8%), Administrative & Support (82 | 9.7%), Transportation & Warehousing (65 | 7.7%), and Professional & Scientific (62 | 7.3%).
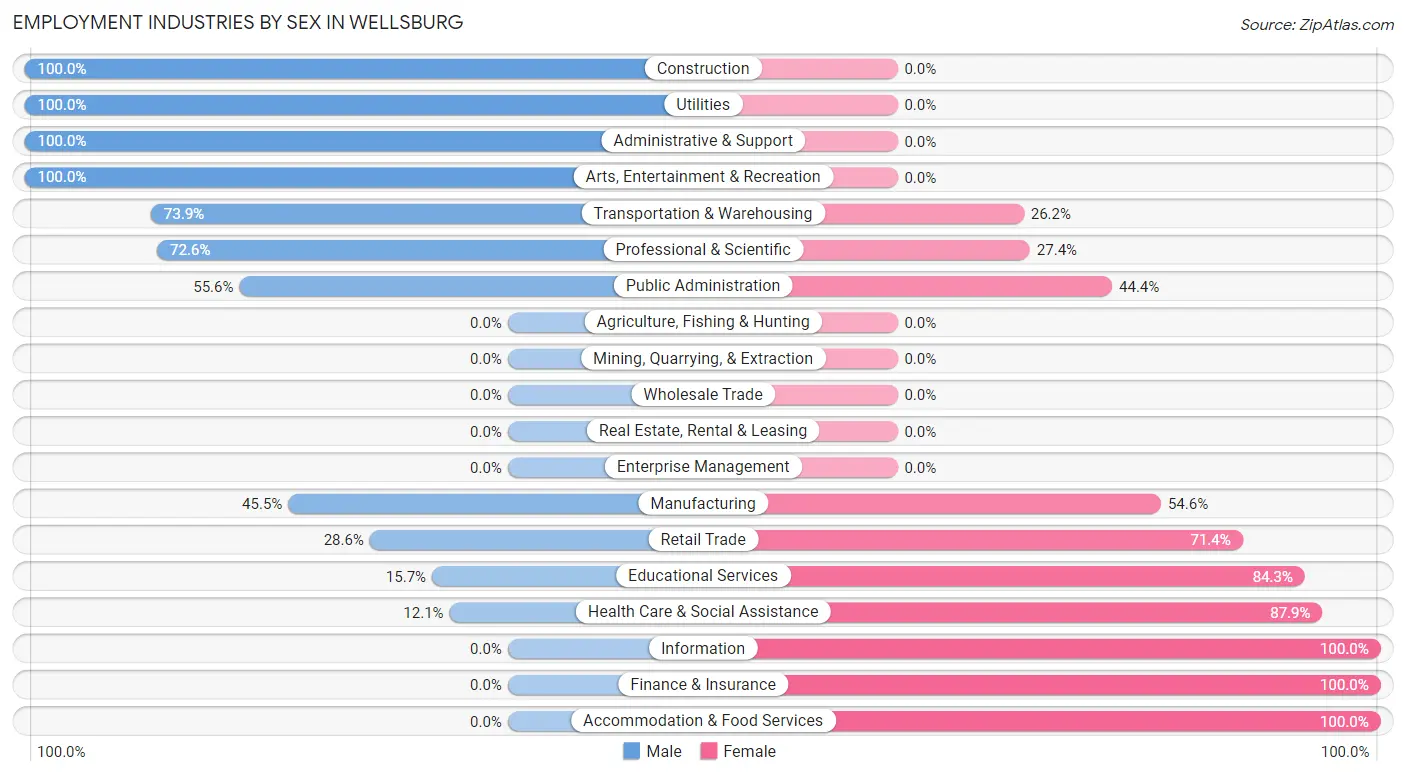
Employment Industries by Sex in Wellsburg
The Wellsburg industries that see more men than women are Construction (100.0%), Utilities (100.0%), and Administrative & Support (100.0%), whereas the industries that tend to have a higher number of women are Information (100.0%), Finance & Insurance (100.0%), and Accommodation & Food Services (100.0%).
| Industry | Male | Female |
| Agriculture, Fishing & Hunting | 0 (0.0%) | 0 (0.0%) |
| Mining, Quarrying, & Extraction | 0 (0.0%) | 0 (0.0%) |
| Construction | 108 (100.0%) | 0 (0.0%) |
| Manufacturing | 25 (45.5%) | 30 (54.5%) |
| Wholesale Trade | 0 (0.0%) | 0 (0.0%) |
| Retail Trade | 16 (28.6%) | 40 (71.4%) |
| Transportation & Warehousing | 48 (73.9%) | 17 (26.2%) |
| Utilities | 17 (100.0%) | 0 (0.0%) |
| Information | 0 (0.0%) | 35 (100.0%) |
| Finance & Insurance | 0 (0.0%) | 16 (100.0%) |
| Real Estate, Rental & Leasing | 0 (0.0%) | 0 (0.0%) |
| Professional & Scientific | 45 (72.6%) | 17 (27.4%) |
| Enterprise Management | 0 (0.0%) | 0 (0.0%) |
| Administrative & Support | 82 (100.0%) | 0 (0.0%) |
| Educational Services | 8 (15.7%) | 43 (84.3%) |
| Health Care & Social Assistance | 7 (12.1%) | 51 (87.9%) |
| Arts, Entertainment & Recreation | 44 (100.0%) | 0 (0.0%) |
| Accommodation & Food Services | 0 (0.0%) | 62 (100.0%) |
| Public Administration | 70 (55.6%) | 56 (44.4%) |
| Total | 470 (55.6%) | 376 (44.4%) |
Education in Wellsburg
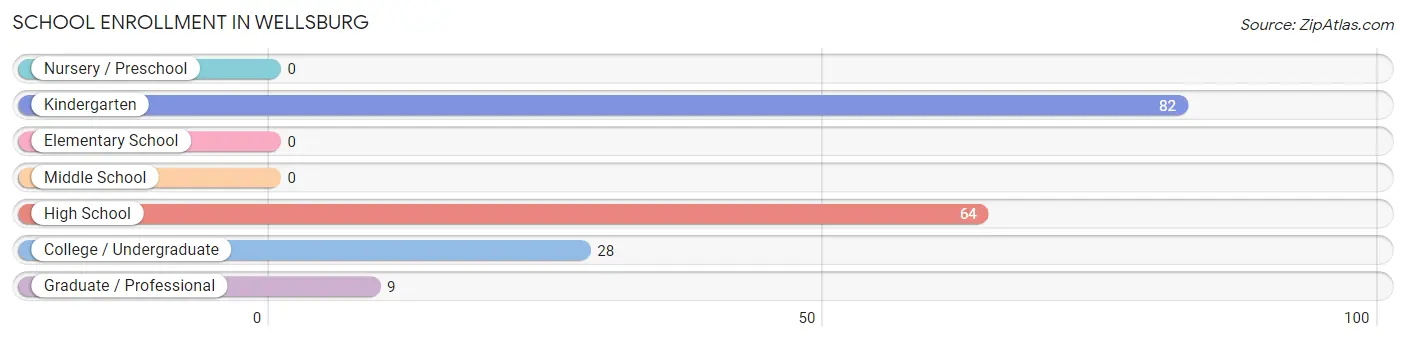
School Enrollment in Wellsburg
The most common levels of schooling among the 183 students in Wellsburg are kindergarten (82 | 44.8%), high school (64 | 35.0%), and college / undergraduate (28 | 15.3%).
| School Level | # Students | % Students |
| Nursery / Preschool | 0 | 0.0% |
| Kindergarten | 82 | 44.8% |
| Elementary School | 0 | 0.0% |
| Middle School | 0 | 0.0% |
| High School | 64 | 35.0% |
| College / Undergraduate | 28 | 15.3% |
| Graduate / Professional | 9 | 4.9% |
| Total | 183 | 100.0% |
School Enrollment by Age by Funding Source in Wellsburg
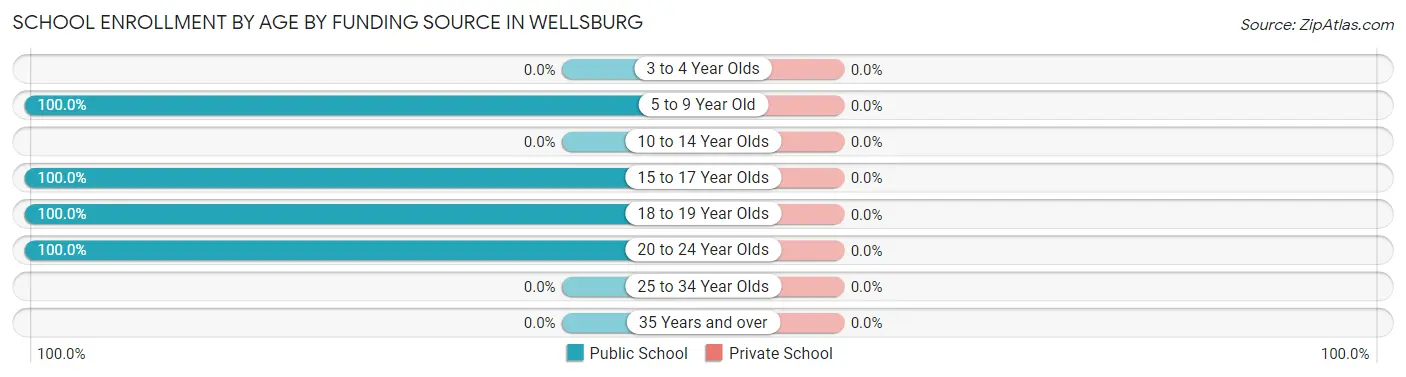
| Age Bracket | Public School | Private School |
| 3 to 4 Year Olds | 0 (0.0%) | 0 (0.0%) |
| 5 to 9 Year Old | 82 (100.0%) | 0 (0.0%) |
| 10 to 14 Year Olds | 0 (0.0%) | 0 (0.0%) |
| 15 to 17 Year Olds | 64 (100.0%) | 0 (0.0%) |
| 18 to 19 Year Olds | 13 (100.0%) | 0 (0.0%) |
| 20 to 24 Year Olds | 24 (100.0%) | 0 (0.0%) |
| 25 to 34 Year Olds | 0 (0.0%) | 0 (0.0%) |
| 35 Years and over | 0 (0.0%) | 0 (0.0%) |
| Total | 183 (100.0%) | 0 (0.0%) |
Educational Attainment by Field of Study in Wellsburg
Education (115 | 31.3%), science & technology (59 | 16.1%), computers & mathematics (44 | 12.0%), visual & performing arts (43 | 11.7%), and psychology (40 | 10.9%) are the most common fields of study among 367 individuals in Wellsburg who have obtained a bachelor's degree or higher.
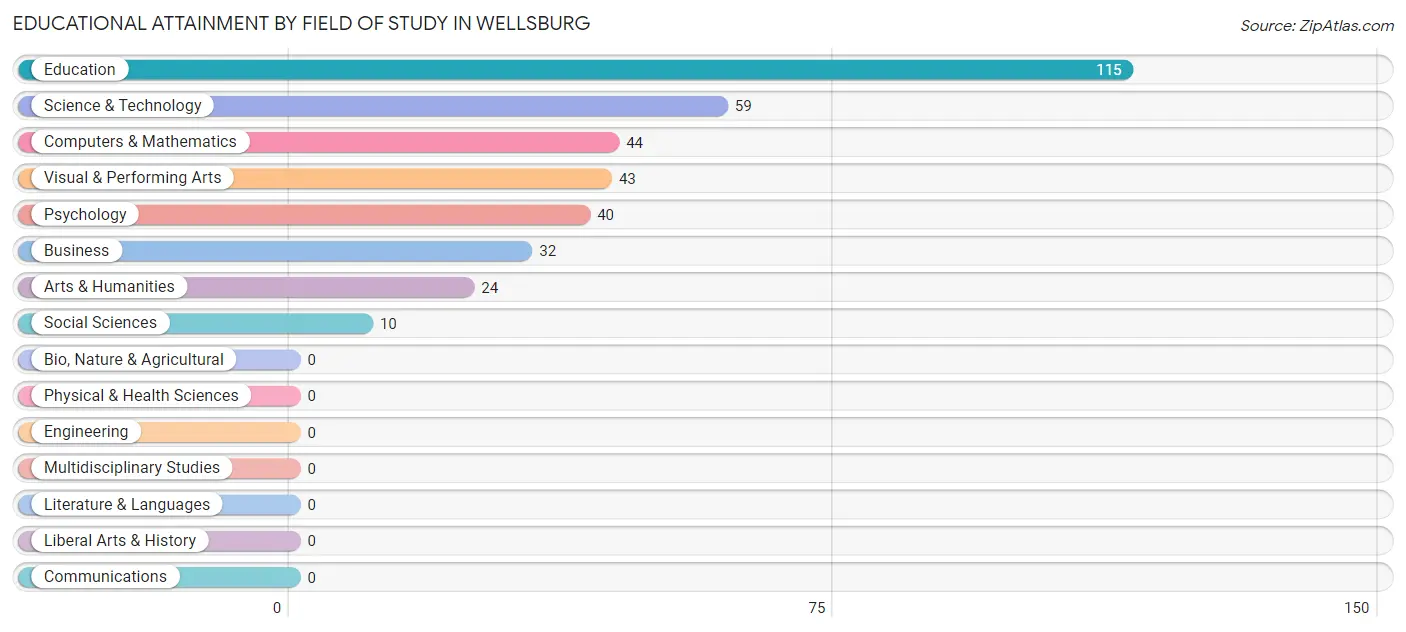
| Field of Study | # Graduates | % Graduates |
| Computers & Mathematics | 44 | 12.0% |
| Bio, Nature & Agricultural | 0 | 0.0% |
| Physical & Health Sciences | 0 | 0.0% |
| Psychology | 40 | 10.9% |
| Social Sciences | 10 | 2.7% |
| Engineering | 0 | 0.0% |
| Multidisciplinary Studies | 0 | 0.0% |
| Science & Technology | 59 | 16.1% |
| Business | 32 | 8.7% |
| Education | 115 | 31.3% |
| Literature & Languages | 0 | 0.0% |
| Liberal Arts & History | 0 | 0.0% |
| Visual & Performing Arts | 43 | 11.7% |
| Communications | 0 | 0.0% |
| Arts & Humanities | 24 | 6.5% |
| Total | 367 | 100.0% |
Transportation & Commute in Wellsburg
Vehicle Availability by Sex in Wellsburg
The most prevalent vehicle ownership categories in Wellsburg are males with 2 vehicles (192, accounting for 49.5%) and females with 2 vehicles (119, making up 51.1%).
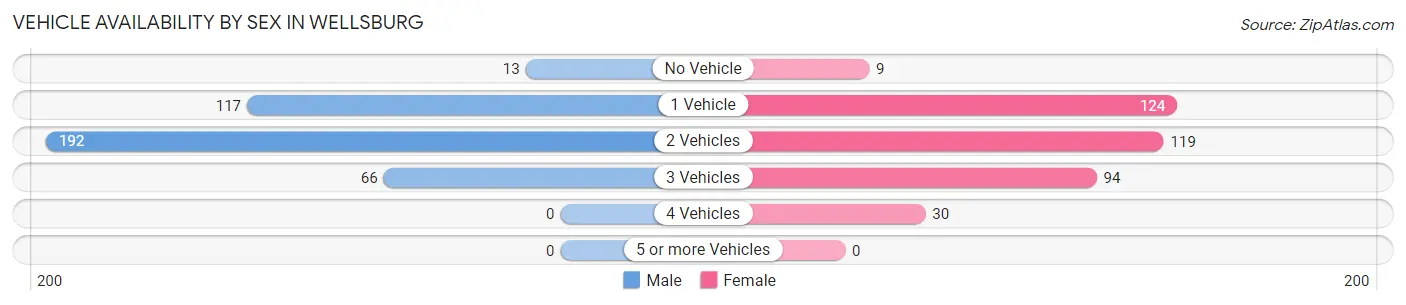
| Vehicles Available | Male | Female |
| No Vehicle | 13 (3.4%) | 9 (2.4%) |
| 1 Vehicle | 117 (30.1%) | 124 (33.0%) |
| 2 Vehicles | 192 (49.5%) | 119 (31.7%) |
| 3 Vehicles | 66 (17.0%) | 94 (25.0%) |
| 4 Vehicles | 0 (0.0%) | 30 (8.0%) |
| 5 or more Vehicles | 0 (0.0%) | 0 (0.0%) |
| Total | 388 (100.0%) | 376 (100.0%) |
Commute Time in Wellsburg
The most frequently occuring commute durations in Wellsburg are 5 to 9 minutes (203 commuters, 27.4%), 20 to 24 minutes (158 commuters, 21.3%), and 30 to 34 minutes (87 commuters, 11.7%).
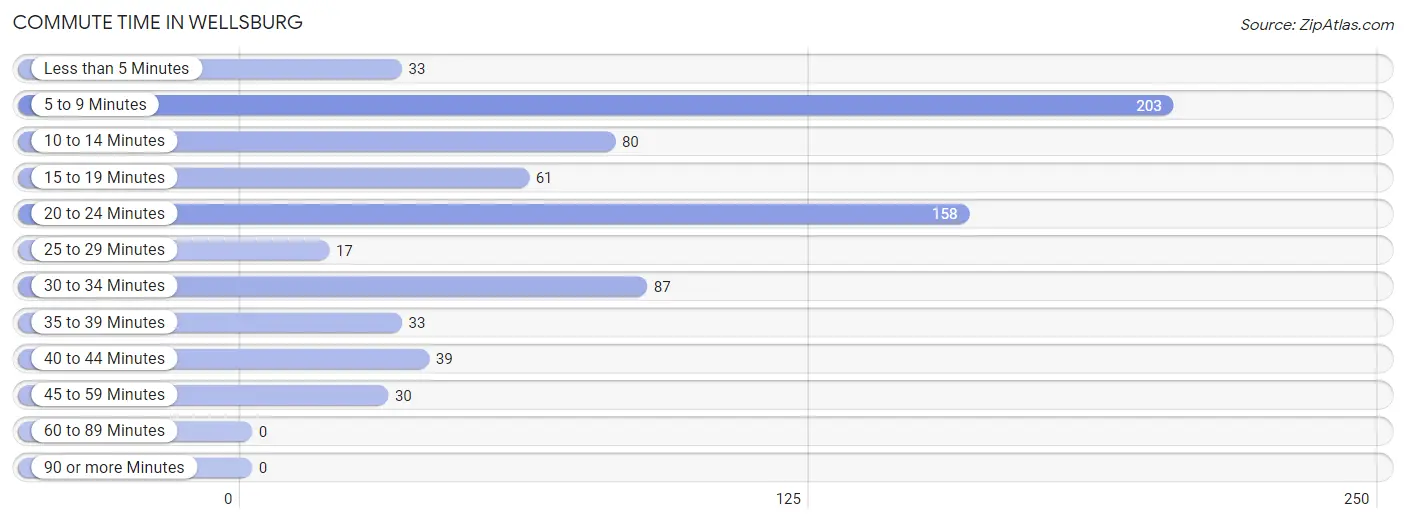
| Commute Time | # Commuters | % Commuters |
| Less than 5 Minutes | 33 | 4.4% |
| 5 to 9 Minutes | 203 | 27.4% |
| 10 to 14 Minutes | 80 | 10.8% |
| 15 to 19 Minutes | 61 | 8.2% |
| 20 to 24 Minutes | 158 | 21.3% |
| 25 to 29 Minutes | 17 | 2.3% |
| 30 to 34 Minutes | 87 | 11.7% |
| 35 to 39 Minutes | 33 | 4.4% |
| 40 to 44 Minutes | 39 | 5.3% |
| 45 to 59 Minutes | 30 | 4.1% |
| 60 to 89 Minutes | 0 | 0.0% |
| 90 or more Minutes | 0 | 0.0% |
Commute Time by Sex in Wellsburg
The most common commute times in Wellsburg are 5 to 9 minutes (80 commuters, 21.9%) for males and 5 to 9 minutes (123 commuters, 32.7%) for females.
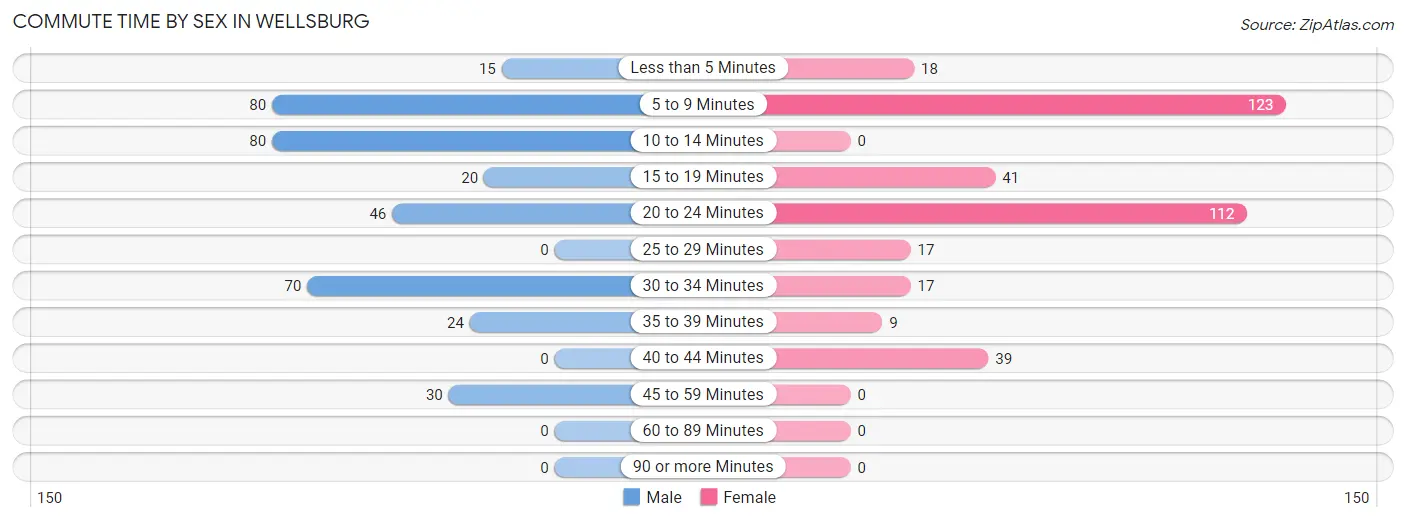
| Commute Time | Male | Female |
| Less than 5 Minutes | 15 (4.1%) | 18 (4.8%) |
| 5 to 9 Minutes | 80 (21.9%) | 123 (32.7%) |
| 10 to 14 Minutes | 80 (21.9%) | 0 (0.0%) |
| 15 to 19 Minutes | 20 (5.5%) | 41 (10.9%) |
| 20 to 24 Minutes | 46 (12.6%) | 112 (29.8%) |
| 25 to 29 Minutes | 0 (0.0%) | 17 (4.5%) |
| 30 to 34 Minutes | 70 (19.2%) | 17 (4.5%) |
| 35 to 39 Minutes | 24 (6.6%) | 9 (2.4%) |
| 40 to 44 Minutes | 0 (0.0%) | 39 (10.4%) |
| 45 to 59 Minutes | 30 (8.2%) | 0 (0.0%) |
| 60 to 89 Minutes | 0 (0.0%) | 0 (0.0%) |
| 90 or more Minutes | 0 (0.0%) | 0 (0.0%) |
Time of Departure to Work by Sex in Wellsburg
The most frequent times of departure to work in Wellsburg are 6:30 AM to 6:59 AM (124, 34.0%) for males and 4:00 PM to 11:59 PM (71, 18.9%) for females.
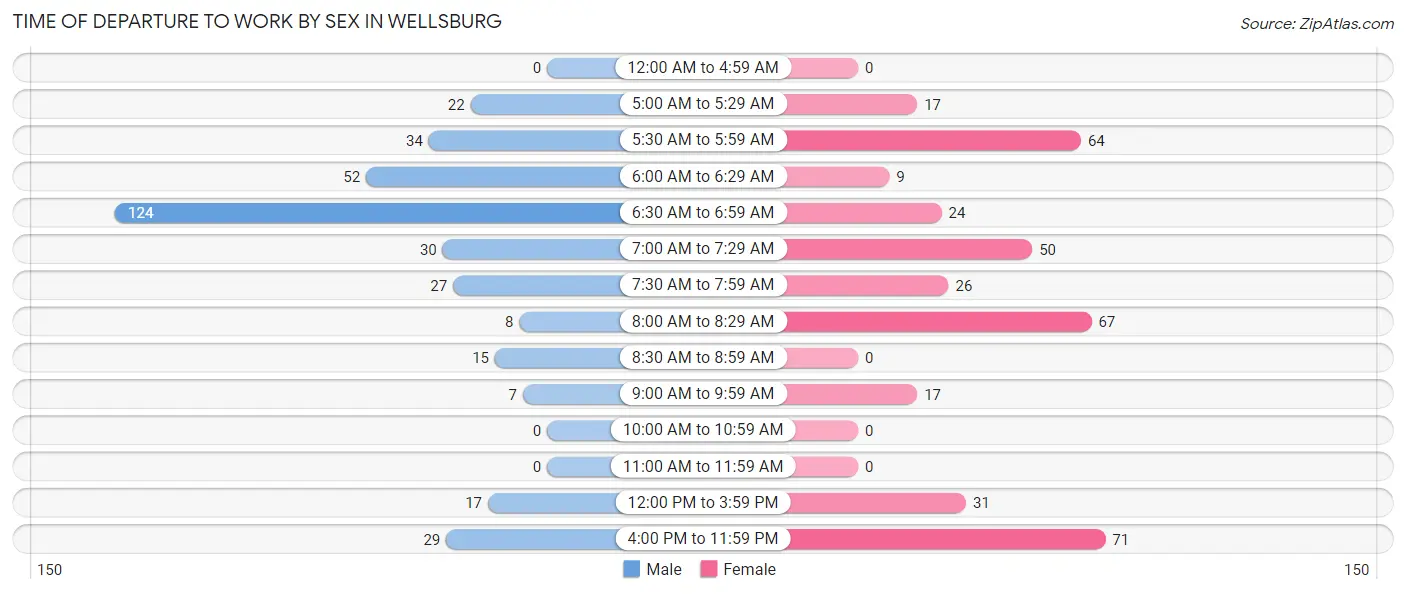
| Time of Departure | Male | Female |
| 12:00 AM to 4:59 AM | 0 (0.0%) | 0 (0.0%) |
| 5:00 AM to 5:29 AM | 22 (6.0%) | 17 (4.5%) |
| 5:30 AM to 5:59 AM | 34 (9.3%) | 64 (17.0%) |
| 6:00 AM to 6:29 AM | 52 (14.2%) | 9 (2.4%) |
| 6:30 AM to 6:59 AM | 124 (34.0%) | 24 (6.4%) |
| 7:00 AM to 7:29 AM | 30 (8.2%) | 50 (13.3%) |
| 7:30 AM to 7:59 AM | 27 (7.4%) | 26 (6.9%) |
| 8:00 AM to 8:29 AM | 8 (2.2%) | 67 (17.8%) |
| 8:30 AM to 8:59 AM | 15 (4.1%) | 0 (0.0%) |
| 9:00 AM to 9:59 AM | 7 (1.9%) | 17 (4.5%) |
| 10:00 AM to 10:59 AM | 0 (0.0%) | 0 (0.0%) |
| 11:00 AM to 11:59 AM | 0 (0.0%) | 0 (0.0%) |
| 12:00 PM to 3:59 PM | 17 (4.7%) | 31 (8.2%) |
| 4:00 PM to 11:59 PM | 29 (8.0%) | 71 (18.9%) |
| Total | 365 (100.0%) | 376 (100.0%) |
Housing Occupancy in Wellsburg
Occupancy by Ownership in Wellsburg
Of the total 1,116 dwellings in Wellsburg, owner-occupied units account for 897 (80.4%), while renter-occupied units make up 219 (19.6%).
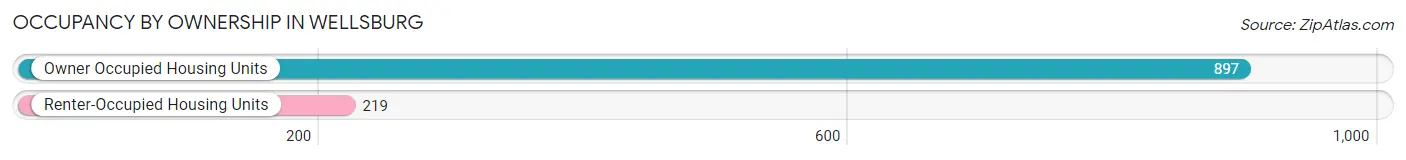
| Occupancy | # Housing Units | % Housing Units |
| Owner Occupied Housing Units | 897 | 80.4% |
| Renter-Occupied Housing Units | 219 | 19.6% |
| Total Occupied Housing Units | 1,116 | 100.0% |
Occupancy by Household Size in Wellsburg
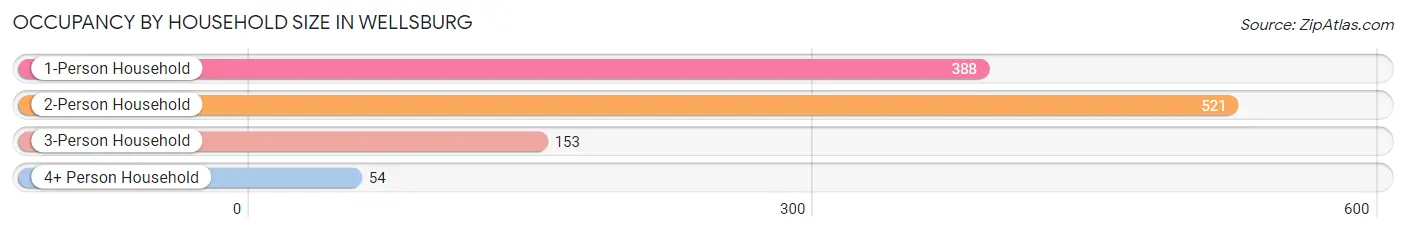
| Household Size | # Housing Units | % Housing Units |
| 1-Person Household | 388 | 34.8% |
| 2-Person Household | 521 | 46.7% |
| 3-Person Household | 153 | 13.7% |
| 4+ Person Household | 54 | 4.8% |
| Total Housing Units | 1,116 | 100.0% |
Occupancy by Ownership by Household Size in Wellsburg
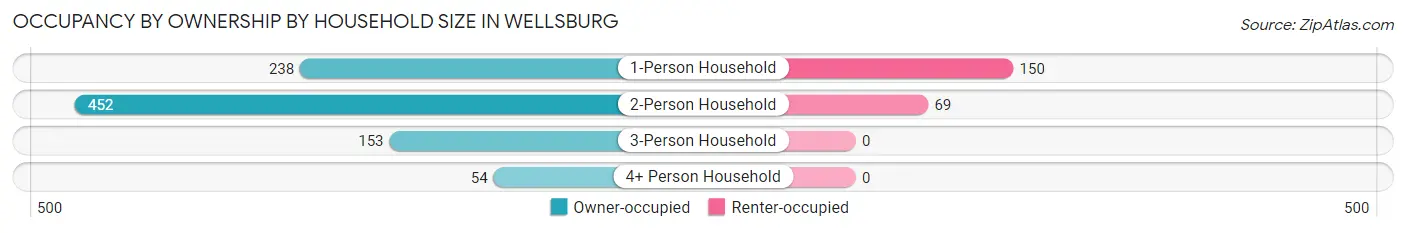
| Household Size | Owner-occupied | Renter-occupied |
| 1-Person Household | 238 (61.3%) | 150 (38.7%) |
| 2-Person Household | 452 (86.8%) | 69 (13.2%) |
| 3-Person Household | 153 (100.0%) | 0 (0.0%) |
| 4+ Person Household | 54 (100.0%) | 0 (0.0%) |
| Total Housing Units | 897 (80.4%) | 219 (19.6%) |
Occupancy by Educational Attainment in Wellsburg
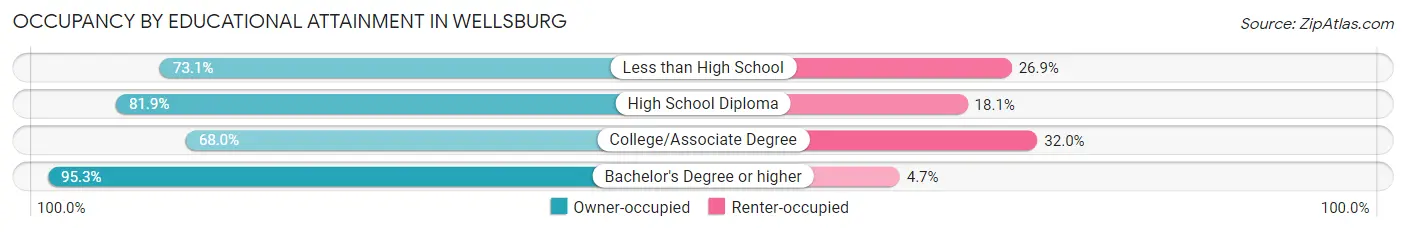
| Household Size | Owner-occupied | Renter-occupied |
| Less than High School | 49 (73.1%) | 18 (26.9%) |
| High School Diploma | 519 (81.9%) | 115 (18.1%) |
| College/Associate Degree | 166 (68.0%) | 78 (32.0%) |
| Bachelor's Degree or higher | 163 (95.3%) | 8 (4.7%) |
Occupancy by Age of Householder in Wellsburg
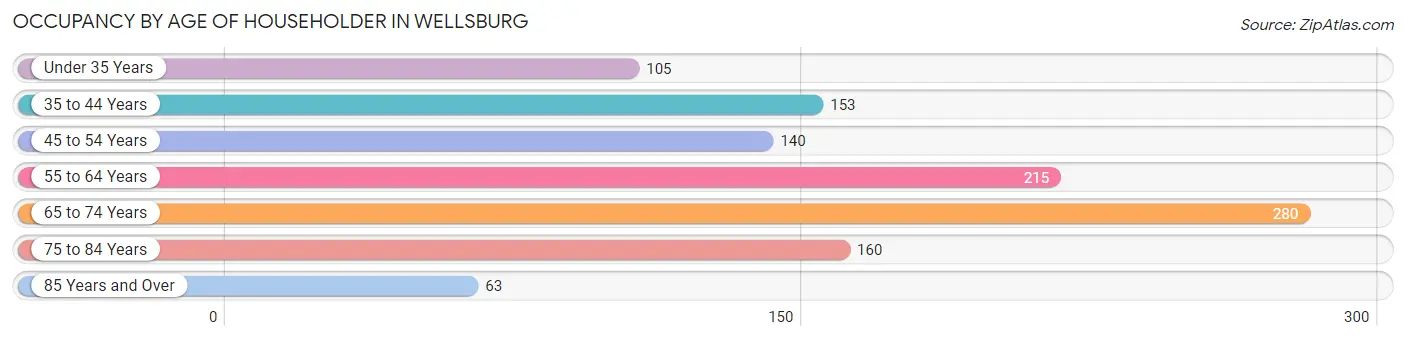
| Age Bracket | # Households | % Households |
| Under 35 Years | 105 | 9.4% |
| 35 to 44 Years | 153 | 13.7% |
| 45 to 54 Years | 140 | 12.5% |
| 55 to 64 Years | 215 | 19.3% |
| 65 to 74 Years | 280 | 25.1% |
| 75 to 84 Years | 160 | 14.3% |
| 85 Years and Over | 63 | 5.7% |
| Total | 1,116 | 100.0% |
Housing Finances in Wellsburg
Median Income by Occupancy in Wellsburg
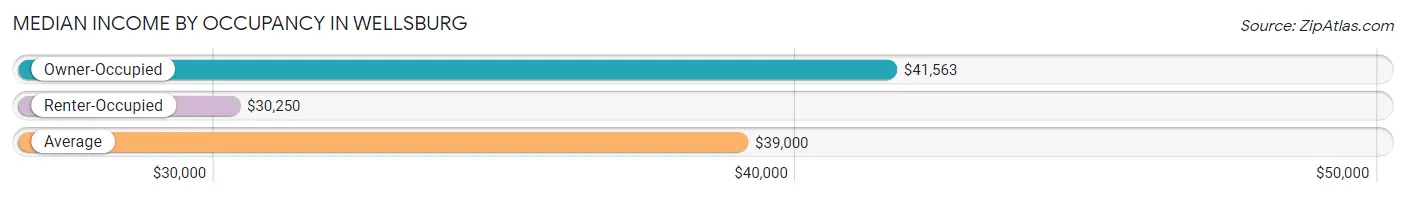
| Occupancy Type | # Households | Median Income |
| Owner-Occupied | 897 (80.4%) | $41,563 |
| Renter-Occupied | 219 (19.6%) | $30,250 |
| Average | 1,116 (100.0%) | $39,000 |
Occupancy by Householder Income Bracket in Wellsburg
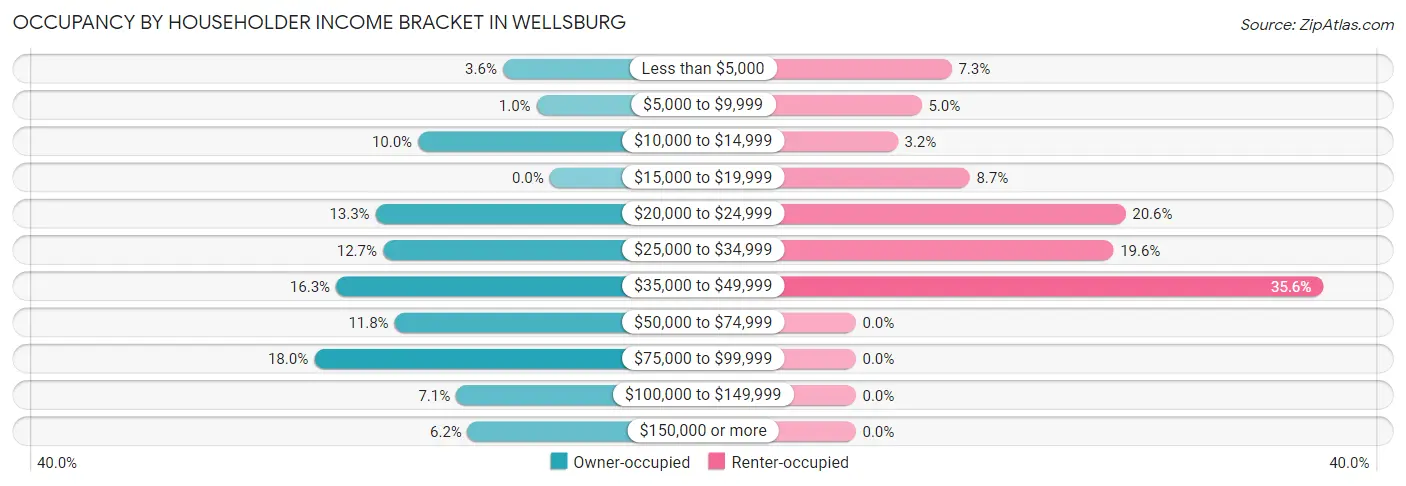
| Income Bracket | Owner-occupied | Renter-occupied |
| Less than $5,000 | 32 (3.6%) | 16 (7.3%) |
| $5,000 to $9,999 | 9 (1.0%) | 11 (5.0%) |
| $10,000 to $14,999 | 90 (10.0%) | 7 (3.2%) |
| $15,000 to $19,999 | 0 (0.0%) | 19 (8.7%) |
| $20,000 to $24,999 | 119 (13.3%) | 45 (20.5%) |
| $25,000 to $34,999 | 114 (12.7%) | 43 (19.6%) |
| $35,000 to $49,999 | 146 (16.3%) | 78 (35.6%) |
| $50,000 to $74,999 | 106 (11.8%) | 0 (0.0%) |
| $75,000 to $99,999 | 161 (17.9%) | 0 (0.0%) |
| $100,000 to $149,999 | 64 (7.1%) | 0 (0.0%) |
| $150,000 or more | 56 (6.2%) | 0 (0.0%) |
| Total | 897 (100.0%) | 219 (100.0%) |
Monthly Housing Cost Tiers in Wellsburg
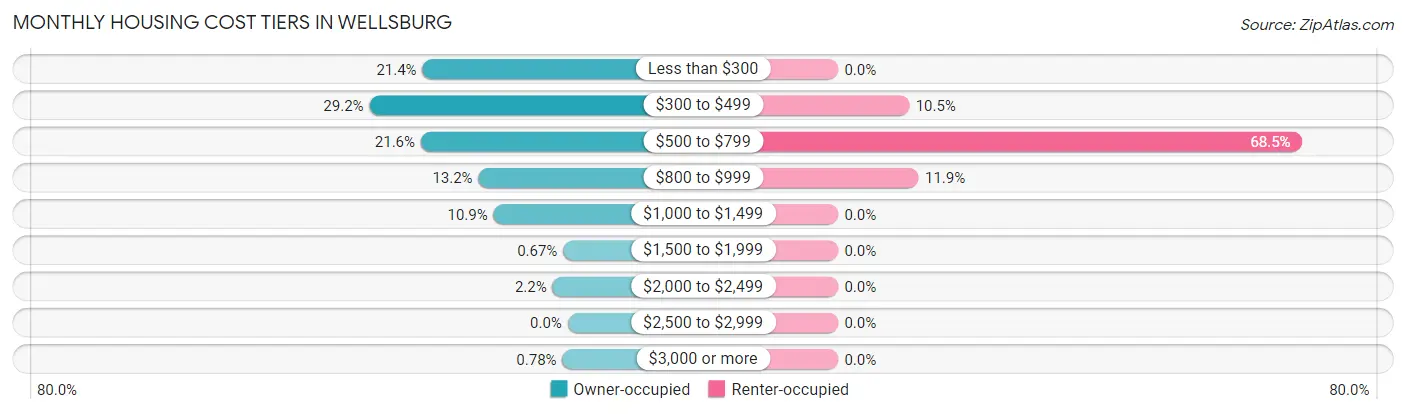
| Monthly Cost | Owner-occupied | Renter-occupied |
| Less than $300 | 192 (21.4%) | 0 (0.0%) |
| $300 to $499 | 262 (29.2%) | 23 (10.5%) |
| $500 to $799 | 194 (21.6%) | 150 (68.5%) |
| $800 to $999 | 118 (13.2%) | 26 (11.9%) |
| $1,000 to $1,499 | 98 (10.9%) | 0 (0.0%) |
| $1,500 to $1,999 | 6 (0.7%) | 0 (0.0%) |
| $2,000 to $2,499 | 20 (2.2%) | 0 (0.0%) |
| $2,500 to $2,999 | 0 (0.0%) | 0 (0.0%) |
| $3,000 or more | 7 (0.8%) | 0 (0.0%) |
| Total | 897 (100.0%) | 219 (100.0%) |
Physical Housing Characteristics in Wellsburg
Housing Structures in Wellsburg
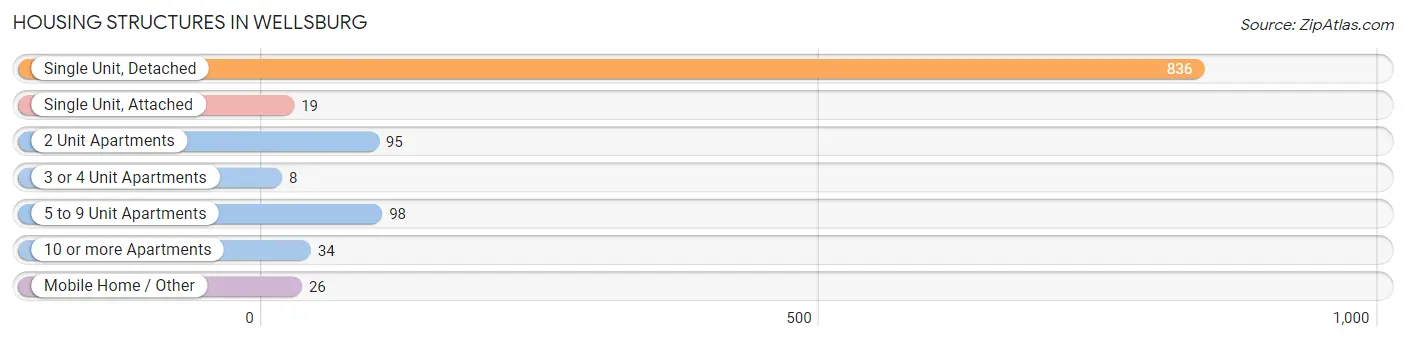
| Structure Type | # Housing Units | % Housing Units |
| Single Unit, Detached | 836 | 74.9% |
| Single Unit, Attached | 19 | 1.7% |
| 2 Unit Apartments | 95 | 8.5% |
| 3 or 4 Unit Apartments | 8 | 0.7% |
| 5 to 9 Unit Apartments | 98 | 8.8% |
| 10 or more Apartments | 34 | 3.0% |
| Mobile Home / Other | 26 | 2.3% |
| Total | 1,116 | 100.0% |
Housing Structures by Occupancy in Wellsburg
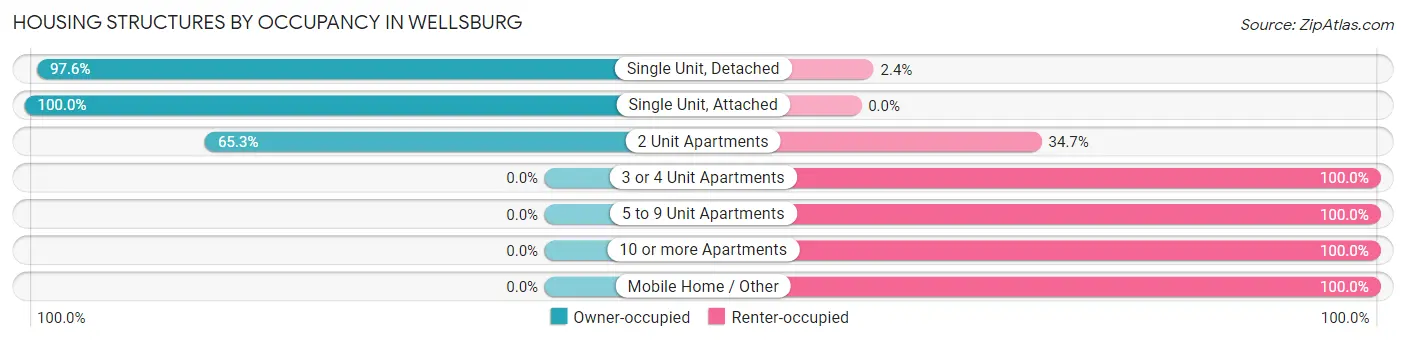
| Structure Type | Owner-occupied | Renter-occupied |
| Single Unit, Detached | 816 (97.6%) | 20 (2.4%) |
| Single Unit, Attached | 19 (100.0%) | 0 (0.0%) |
| 2 Unit Apartments | 62 (65.3%) | 33 (34.7%) |
| 3 or 4 Unit Apartments | 0 (0.0%) | 8 (100.0%) |
| 5 to 9 Unit Apartments | 0 (0.0%) | 98 (100.0%) |
| 10 or more Apartments | 0 (0.0%) | 34 (100.0%) |
| Mobile Home / Other | 0 (0.0%) | 26 (100.0%) |
| Total | 897 (80.4%) | 219 (19.6%) |
Housing Structures by Number of Rooms in Wellsburg
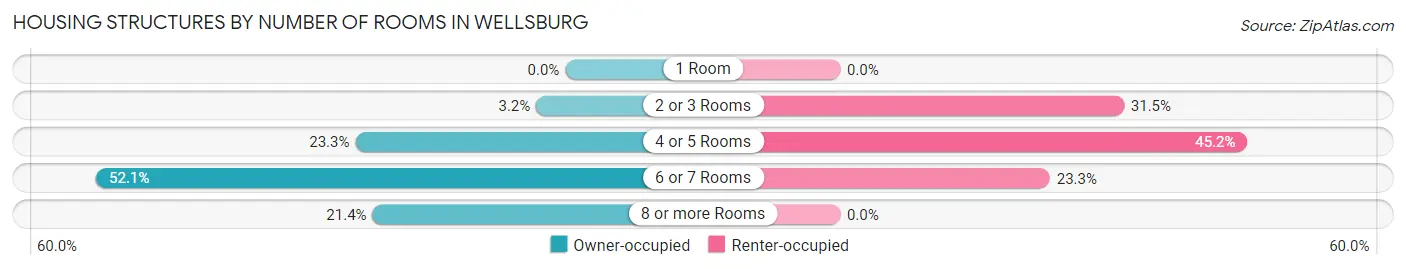
| Number of Rooms | Owner-occupied | Renter-occupied |
| 1 Room | 0 (0.0%) | 0 (0.0%) |
| 2 or 3 Rooms | 29 (3.2%) | 69 (31.5%) |
| 4 or 5 Rooms | 209 (23.3%) | 99 (45.2%) |
| 6 or 7 Rooms | 467 (52.1%) | 51 (23.3%) |
| 8 or more Rooms | 192 (21.4%) | 0 (0.0%) |
| Total | 897 (100.0%) | 219 (100.0%) |
Housing Structure by Heating Type in Wellsburg
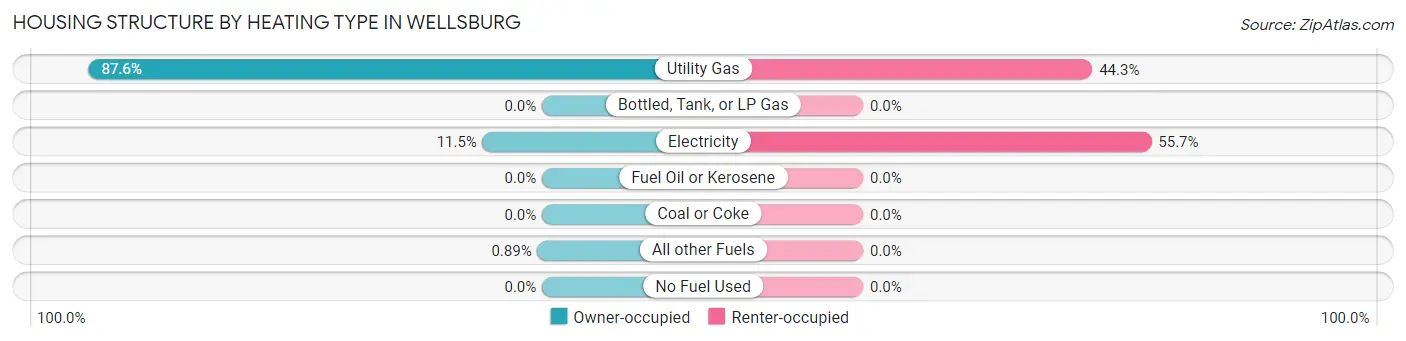
| Heating Type | Owner-occupied | Renter-occupied |
| Utility Gas | 786 (87.6%) | 97 (44.3%) |
| Bottled, Tank, or LP Gas | 0 (0.0%) | 0 (0.0%) |
| Electricity | 103 (11.5%) | 122 (55.7%) |
| Fuel Oil or Kerosene | 0 (0.0%) | 0 (0.0%) |
| Coal or Coke | 0 (0.0%) | 0 (0.0%) |
| All other Fuels | 8 (0.9%) | 0 (0.0%) |
| No Fuel Used | 0 (0.0%) | 0 (0.0%) |
| Total | 897 (100.0%) | 219 (100.0%) |
Household Vehicle Usage in Wellsburg
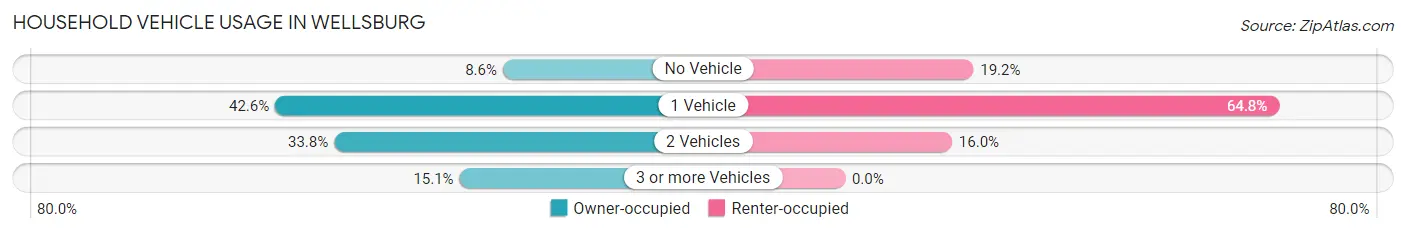
| Vehicles per Household | Owner-occupied | Renter-occupied |
| No Vehicle | 77 (8.6%) | 42 (19.2%) |
| 1 Vehicle | 382 (42.6%) | 142 (64.8%) |
| 2 Vehicles | 303 (33.8%) | 35 (16.0%) |
| 3 or more Vehicles | 135 (15.0%) | 0 (0.0%) |
| Total | 897 (100.0%) | 219 (100.0%) |
Real Estate & Mortgages in Wellsburg
Real Estate and Mortgage Overview in Wellsburg
| Characteristic | Without Mortgage | With Mortgage |
| Housing Units | 626 | 271 |
| Median Property Value | $84,000 | $109,700 |
| Median Household Income | $38,889 | $48 |
| Monthly Housing Costs | $351 | $7 |
| Real Estate Taxes | $574 | $7 |
Property Value by Mortgage Status in Wellsburg
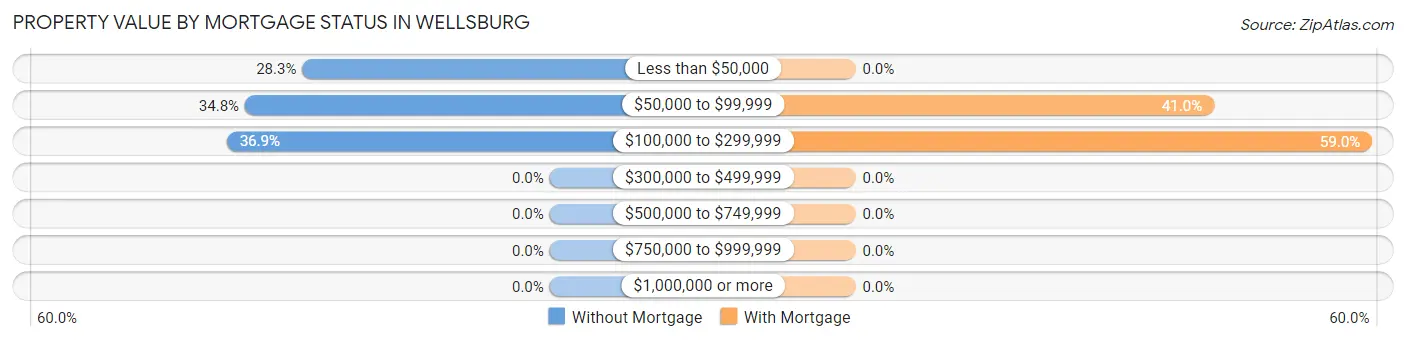
| Property Value | Without Mortgage | With Mortgage |
| Less than $50,000 | 177 (28.3%) | 0 (0.0%) |
| $50,000 to $99,999 | 218 (34.8%) | 111 (41.0%) |
| $100,000 to $299,999 | 231 (36.9%) | 160 (59.0%) |
| $300,000 to $499,999 | 0 (0.0%) | 0 (0.0%) |
| $500,000 to $749,999 | 0 (0.0%) | 0 (0.0%) |
| $750,000 to $999,999 | 0 (0.0%) | 0 (0.0%) |
| $1,000,000 or more | 0 (0.0%) | 0 (0.0%) |
| Total | 626 (100.0%) | 271 (100.0%) |
Household Income by Mortgage Status in Wellsburg
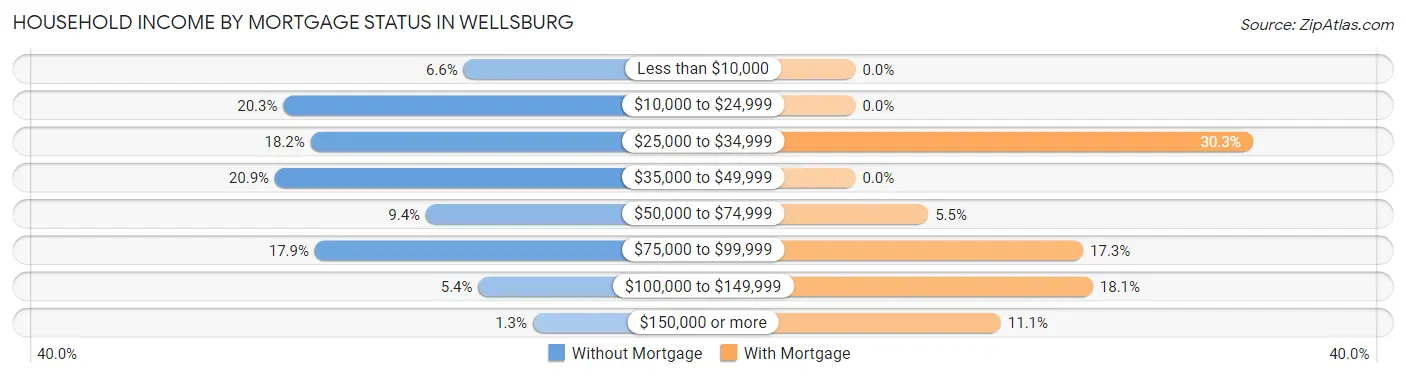
| Household Income | Without Mortgage | With Mortgage |
| Less than $10,000 | 41 (6.6%) | 0 (0.0%) |
| $10,000 to $24,999 | 127 (20.3%) | 0 (0.0%) |
| $25,000 to $34,999 | 114 (18.2%) | 82 (30.3%) |
| $35,000 to $49,999 | 131 (20.9%) | 0 (0.0%) |
| $50,000 to $74,999 | 59 (9.4%) | 15 (5.5%) |
| $75,000 to $99,999 | 112 (17.9%) | 47 (17.3%) |
| $100,000 to $149,999 | 34 (5.4%) | 49 (18.1%) |
| $150,000 or more | 8 (1.3%) | 30 (11.1%) |
| Total | 626 (100.0%) | 271 (100.0%) |
Property Value to Household Income Ratio in Wellsburg
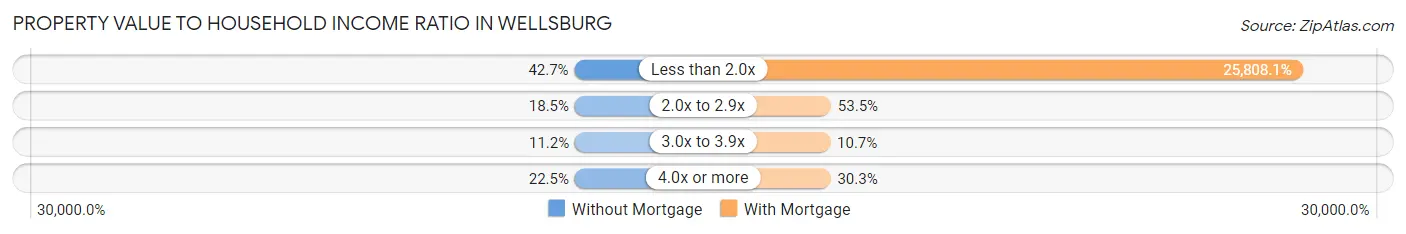
| Value-to-Income Ratio | Without Mortgage | With Mortgage |
| Less than 2.0x | 267 (42.6%) | 69,940 (25,808.1%) |
| 2.0x to 2.9x | 116 (18.5%) | 145 (53.5%) |
| 3.0x to 3.9x | 70 (11.2%) | 29 (10.7%) |
| 4.0x or more | 141 (22.5%) | 82 (30.3%) |
| Total | 626 (100.0%) | 271 (100.0%) |
Real Estate Taxes by Mortgage Status in Wellsburg
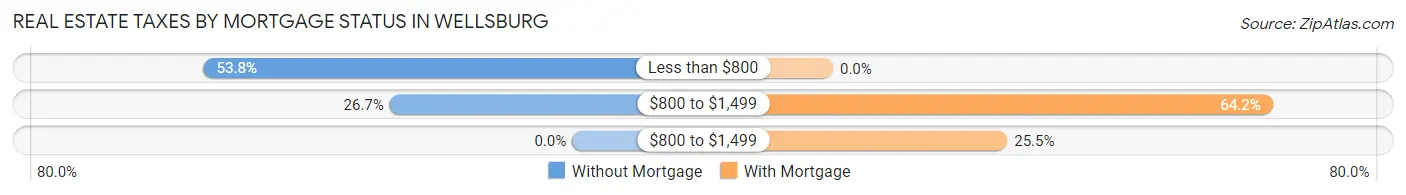
| Property Taxes | Without Mortgage | With Mortgage |
| Less than $800 | 337 (53.8%) | 0 (0.0%) |
| $800 to $1,499 | 167 (26.7%) | 174 (64.2%) |
| $800 to $1,499 | 0 (0.0%) | 69 (25.5%) |
| Total | 626 (100.0%) | 271 (100.0%) |
Health & Disability in Wellsburg
Health Insurance Coverage by Age in Wellsburg
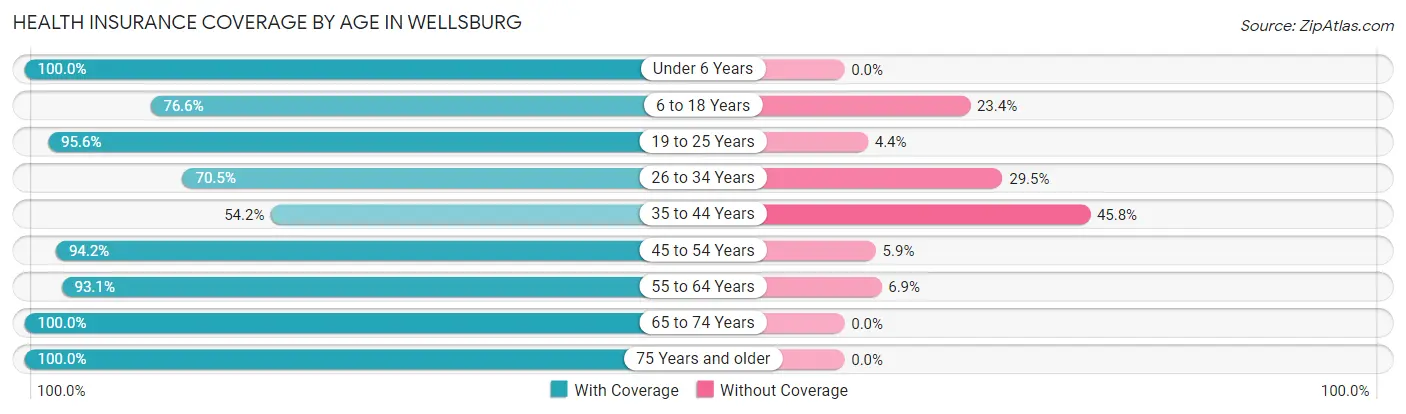
| Age Bracket | With Coverage | Without Coverage |
| Under 6 Years | 96 (100.0%) | 0 (0.0%) |
| 6 to 18 Years | 49 (76.6%) | 15 (23.4%) |
| 19 to 25 Years | 153 (95.6%) | 7 (4.4%) |
| 26 to 34 Years | 91 (70.5%) | 38 (29.5%) |
| 35 to 44 Years | 97 (54.2%) | 82 (45.8%) |
| 45 to 54 Years | 306 (94.2%) | 19 (5.9%) |
| 55 to 64 Years | 297 (93.1%) | 22 (6.9%) |
| 65 to 74 Years | 551 (100.0%) | 0 (0.0%) |
| 75 Years and older | 357 (100.0%) | 0 (0.0%) |
| Total | 1,997 (91.6%) | 183 (8.4%) |
Health Insurance Coverage by Citizenship Status in Wellsburg
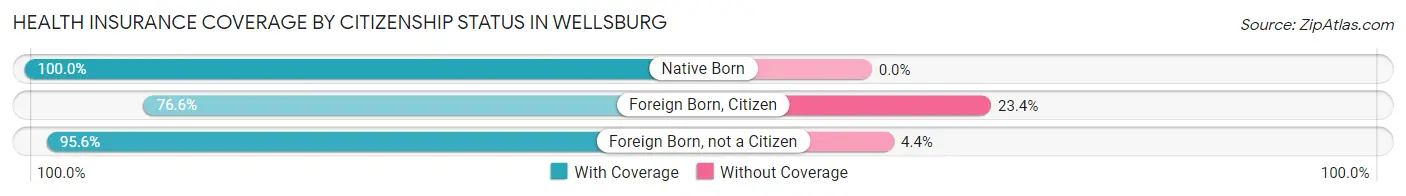
| Citizenship Status | With Coverage | Without Coverage |
| Native Born | 96 (100.0%) | 0 (0.0%) |
| Foreign Born, Citizen | 49 (76.6%) | 15 (23.4%) |
| Foreign Born, not a Citizen | 153 (95.6%) | 7 (4.4%) |
Health Insurance Coverage by Household Income in Wellsburg
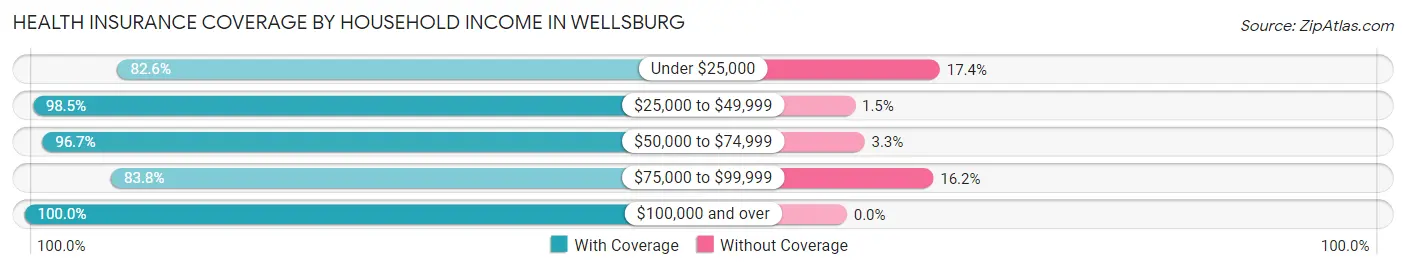
| Household Income | With Coverage | Without Coverage |
| Under $25,000 | 455 (82.6%) | 96 (17.4%) |
| $25,000 to $49,999 | 640 (98.5%) | 10 (1.5%) |
| $50,000 to $74,999 | 233 (96.7%) | 8 (3.3%) |
| $75,000 to $99,999 | 357 (83.8%) | 69 (16.2%) |
| $100,000 and over | 312 (100.0%) | 0 (0.0%) |
Public vs Private Health Insurance Coverage by Age in Wellsburg
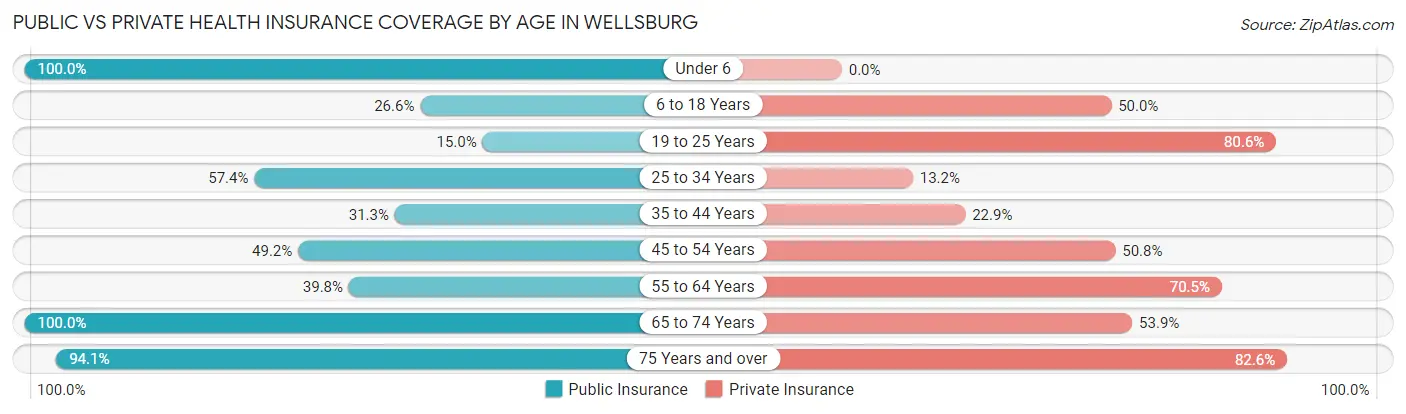
| Age Bracket | Public Insurance | Private Insurance |
| Under 6 | 96 (100.0%) | 0 (0.0%) |
| 6 to 18 Years | 17 (26.6%) | 32 (50.0%) |
| 19 to 25 Years | 24 (15.0%) | 129 (80.6%) |
| 25 to 34 Years | 74 (57.4%) | 17 (13.2%) |
| 35 to 44 Years | 56 (31.3%) | 41 (22.9%) |
| 45 to 54 Years | 160 (49.2%) | 165 (50.8%) |
| 55 to 64 Years | 127 (39.8%) | 225 (70.5%) |
| 65 to 74 Years | 551 (100.0%) | 297 (53.9%) |
| 75 Years and over | 336 (94.1%) | 295 (82.6%) |
| Total | 1,441 (66.1%) | 1,201 (55.1%) |
Disability Status by Sex by Age in Wellsburg
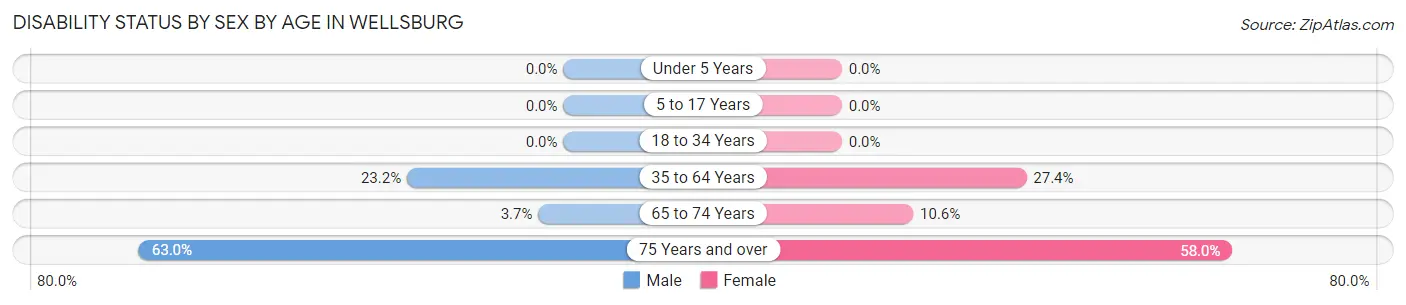
| Age Bracket | Male | Female |
| Under 5 Years | 0 (0.0%) | 0 (0.0%) |
| 5 to 17 Years | 0 (0.0%) | 0 (0.0%) |
| 18 to 34 Years | 0 (0.0%) | 0 (0.0%) |
| 35 to 64 Years | 114 (23.2%) | 91 (27.4%) |
| 65 to 74 Years | 11 (3.7%) | 27 (10.6%) |
| 75 Years and over | 75 (63.0%) | 138 (58.0%) |
Disability Class by Sex by Age in Wellsburg
Disability Class: Hearing Difficulty
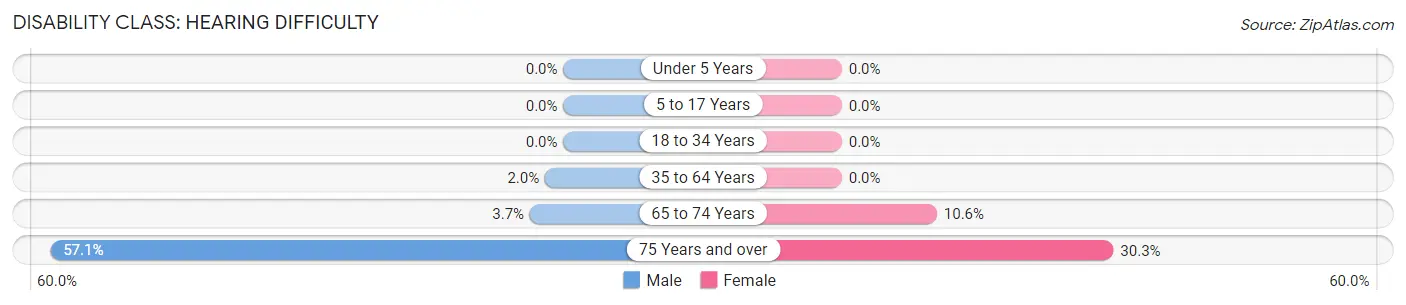
| Age Bracket | Male | Female |
| Under 5 Years | 0 (0.0%) | 0 (0.0%) |
| 5 to 17 Years | 0 (0.0%) | 0 (0.0%) |
| 18 to 34 Years | 0 (0.0%) | 0 (0.0%) |
| 35 to 64 Years | 10 (2.0%) | 0 (0.0%) |
| 65 to 74 Years | 11 (3.7%) | 27 (10.6%) |
| 75 Years and over | 68 (57.1%) | 72 (30.2%) |
Disability Class: Vision Difficulty
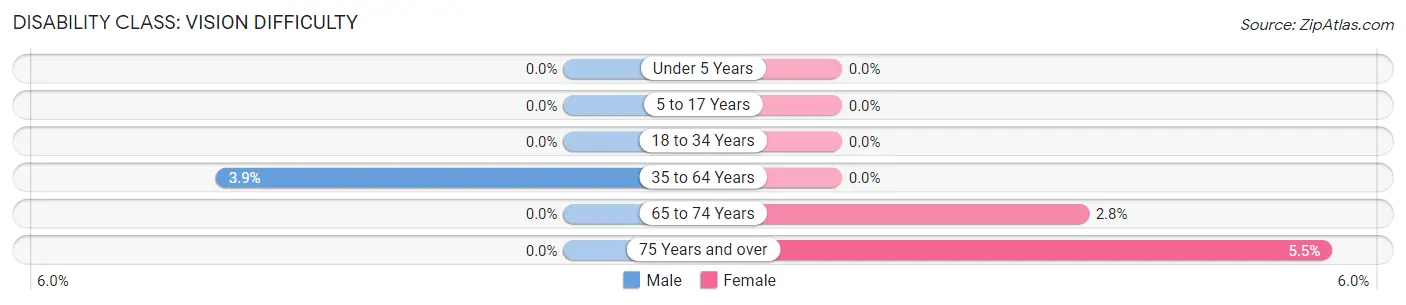
| Age Bracket | Male | Female |
| Under 5 Years | 0 (0.0%) | 0 (0.0%) |
| 5 to 17 Years | 0 (0.0%) | 0 (0.0%) |
| 18 to 34 Years | 0 (0.0%) | 0 (0.0%) |
| 35 to 64 Years | 19 (3.9%) | 0 (0.0%) |
| 65 to 74 Years | 0 (0.0%) | 7 (2.8%) |
| 75 Years and over | 0 (0.0%) | 13 (5.5%) |
Disability Class: Cognitive Difficulty
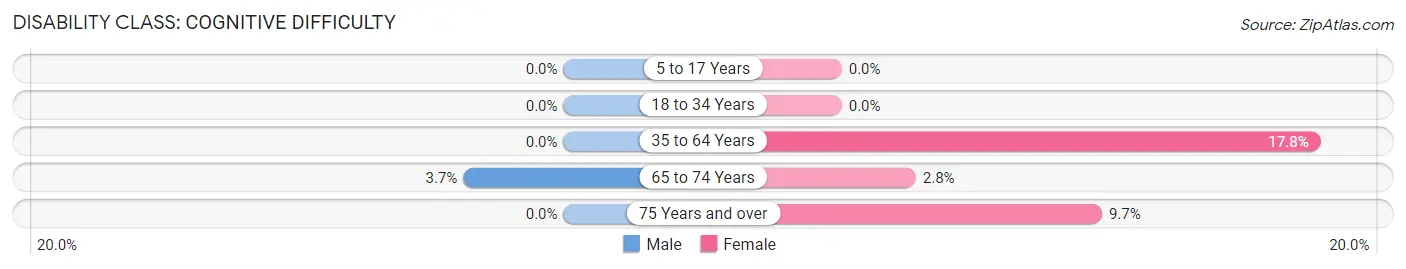
| Age Bracket | Male | Female |
| 5 to 17 Years | 0 (0.0%) | 0 (0.0%) |
| 18 to 34 Years | 0 (0.0%) | 0 (0.0%) |
| 35 to 64 Years | 0 (0.0%) | 59 (17.8%) |
| 65 to 74 Years | 11 (3.7%) | 7 (2.8%) |
| 75 Years and over | 0 (0.0%) | 23 (9.7%) |
Disability Class: Ambulatory Difficulty
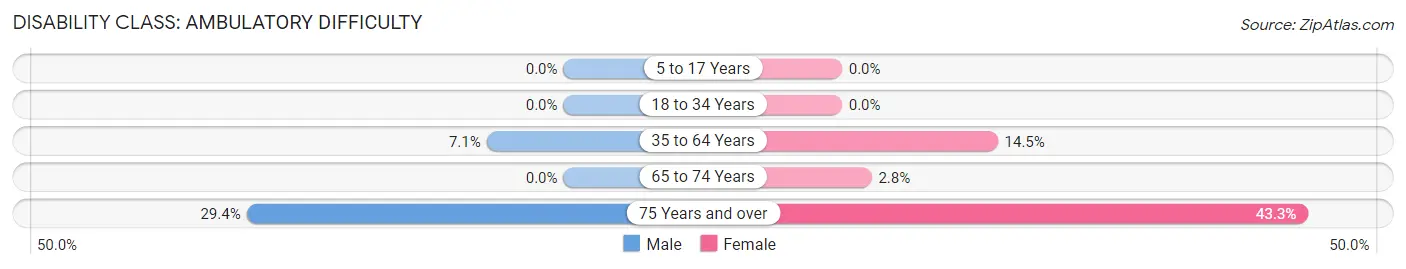
| Age Bracket | Male | Female |
| 5 to 17 Years | 0 (0.0%) | 0 (0.0%) |
| 18 to 34 Years | 0 (0.0%) | 0 (0.0%) |
| 35 to 64 Years | 35 (7.1%) | 48 (14.5%) |
| 65 to 74 Years | 0 (0.0%) | 7 (2.8%) |
| 75 Years and over | 35 (29.4%) | 103 (43.3%) |
Disability Class: Self-Care Difficulty
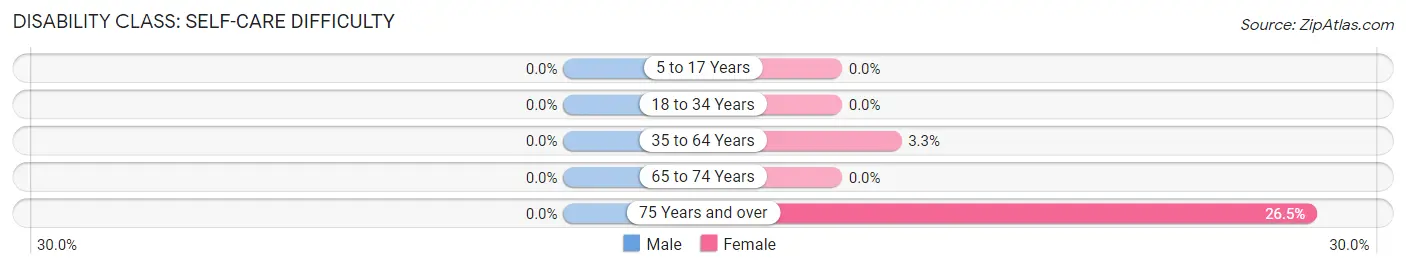
| Age Bracket | Male | Female |
| 5 to 17 Years | 0 (0.0%) | 0 (0.0%) |
| 18 to 34 Years | 0 (0.0%) | 0 (0.0%) |
| 35 to 64 Years | 0 (0.0%) | 11 (3.3%) |
| 65 to 74 Years | 0 (0.0%) | 0 (0.0%) |
| 75 Years and over | 0 (0.0%) | 63 (26.5%) |
Technology Access in Wellsburg
Computing Device Access in Wellsburg
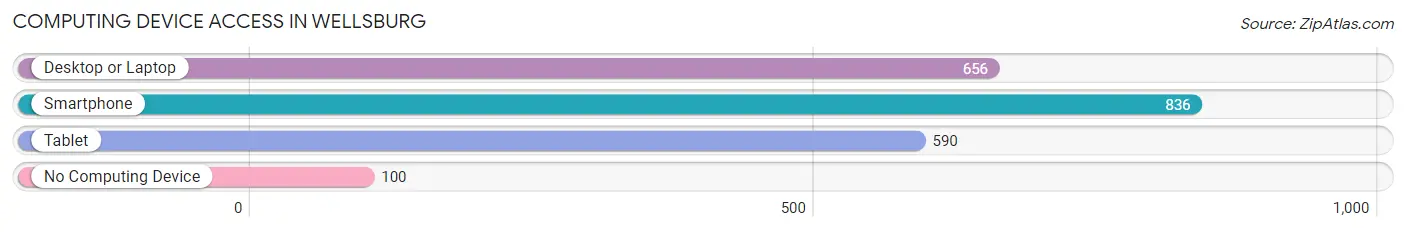
| Device Type | # Households | % Households |
| Desktop or Laptop | 656 | 58.8% |
| Smartphone | 836 | 74.9% |
| Tablet | 590 | 52.9% |
| No Computing Device | 100 | 9.0% |
| Total | 1,116 | 100.0% |
Internet Access in Wellsburg
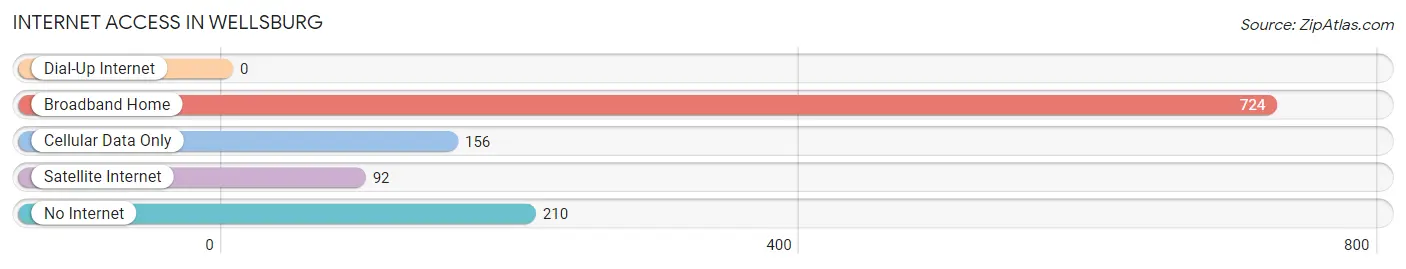
| Internet Type | # Households | % Households |
| Dial-Up Internet | 0 | 0.0% |
| Broadband Home | 724 | 64.9% |
| Cellular Data Only | 156 | 14.0% |
| Satellite Internet | 92 | 8.2% |
| No Internet | 210 | 18.8% |
| Total | 1,116 | 100.0% |
Wellsburg Summary
Wellsburg, West Virginia is a small town located in Brooke County, West Virginia. It is situated along the Ohio River, just south of Wheeling. The town was founded in 1772 and has a population of 1,743 as of the 2010 census.
History
Wellsburg was founded in 1772 by a group of settlers from Pennsylvania. The town was originally known as Wellsburg, but the name was changed to Wellsburg in 1816. The town was named after the Wells family, who were among the first settlers.
The town was an important stop on the National Road, which was the first federally funded highway in the United States. The road was built in the early 19th century and connected the east coast to the Midwest. Wellsburg was a major stop on the road, and it was also the site of the first bridge across the Ohio River.
The town was also an important stop on the Underground Railroad. It was a safe haven for escaped slaves, and many of them settled in the area.
Geography
Wellsburg is located in Brooke County, West Virginia. It is situated along the Ohio River, just south of Wheeling. The town is located in the Appalachian Mountains, and the terrain is mostly hilly. The town is located at an elevation of 845 feet above sea level.
The climate in Wellsburg is humid continental, with hot summers and cold winters. The average annual temperature is around 50 degrees Fahrenheit. The average annual precipitation is around 40 inches.
Economy
The economy of Wellsburg is largely based on manufacturing and agriculture. The town is home to several manufacturing companies, including a steel mill, a paper mill, and a glass factory. The town is also home to several farms, which produce a variety of crops, including corn, soybeans, and wheat.
The town is also home to several small businesses, including restaurants, shops, and other services. The town is also home to a few tourist attractions, including the Wellsburg Historic District and the Wellsburg National Road Museum.
Demographics
As of the 2010 census, the population of Wellsburg was 1,743. The racial makeup of the town was 97.3% White, 0.9% African American, 0.2% Native American, 0.2% Asian, 0.1% Pacific Islander, 0.2% from other races, and 0.9% from two or more races. Hispanic or Latino of any race were 0.7% of the population.
The median income for a household in Wellsburg was $30,938, and the median income for a family was $37,917. The per capita income for the town was $17,845. About 16.2% of families and 19.2% of the population were below the poverty line, including 28.3% of those under age 18 and 8.2% of those age 65 or over.
Common Questions
What is Per Capita Income in Wellsburg?
Per Capita income in Wellsburg is $27,197.
What is the Median Family Income in Wellsburg?
Median Family Income in Wellsburg is $41,861.
What is the Median Household income in Wellsburg?
Median Household Income in Wellsburg is $39,000.
What is Income or Wage Gap in Wellsburg?
Income or Wage Gap in Wellsburg is 30.5%.
Women in Wellsburg earn 69.5 cents for every dollar earned by a man.
What is Inequality or Gini Index in Wellsburg?
Inequality or Gini Index in Wellsburg is 0.42.
What is the Total Population of Wellsburg?
Total Population of Wellsburg is 2,180.
What is the Total Male Population of Wellsburg?
Total Male Population of Wellsburg is 1,132.
What is the Total Female Population of Wellsburg?
Total Female Population of Wellsburg is 1,048.
What is the Ratio of Males per 100 Females in Wellsburg?
There are 108.02 Males per 100 Females in Wellsburg.
What is the Ratio of Females per 100 Males in Wellsburg?
There are 92.58 Females per 100 Males in Wellsburg.
What is the Median Population Age in Wellsburg?
Median Population Age in Wellsburg is 59.3 Years.
What is the Average Family Size in Wellsburg
Average Family Size in Wellsburg is 2.5 People.
What is the Average Household Size in Wellsburg
Average Household Size in Wellsburg is 1.9 People.
How Large is the Labor Force in Wellsburg?
There are 974 People in the Labor Forcein in Wellsburg.
What is the Percentage of People in the Labor Force in Wellsburg?
47.2% of People are in the Labor Force in Wellsburg.
What is the Unemployment Rate in Wellsburg?
Unemployment Rate in Wellsburg is 13.1%.