Zip Codes with the Highest Percentage of Population with a Degree in Bio, Nature & Agricultural in Vermont
RELATED REPORTS & OPTIONS
Bio, Nature & Agricultural
Vermont
Compare Zip Codes
Map of Zip Codes with the Highest Percentage of Population with a Degree in Bio, Nature & Agricultural in Vermont
0.0%
100.0%
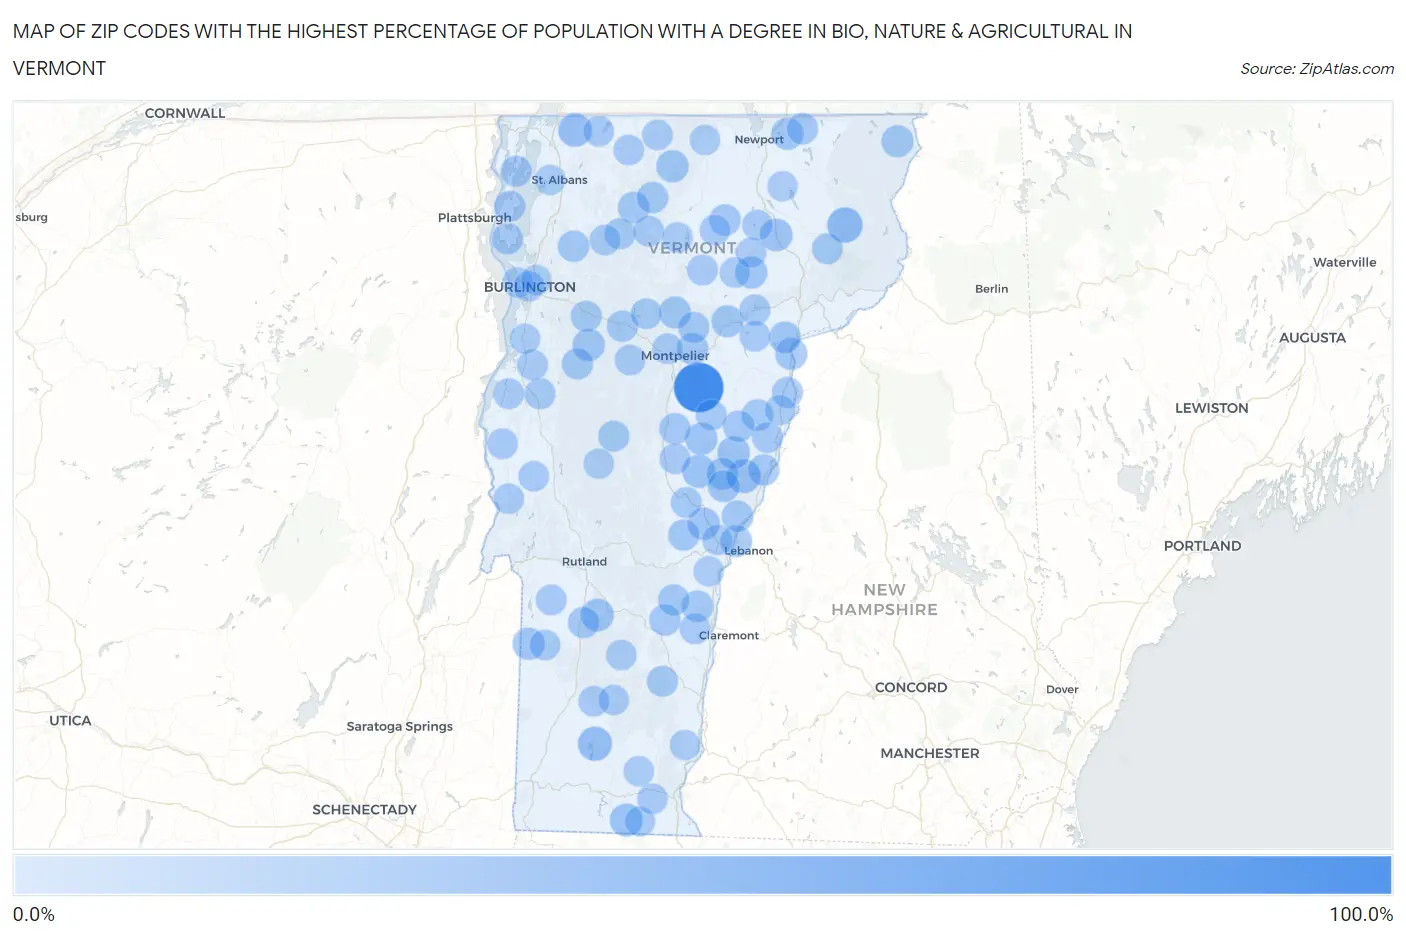
Zip Codes with the Highest Percentage of Population with a Degree in Bio, Nature & Agricultural in Vermont
| Zip Code | % Graduates | vs State | vs National | |
| 1. | 05678 | 100.0% | 8.9% (+91.1)#1 | 6.4% (+93.6)#67 |
| 2. | 05837 | 32.4% | 8.9% (+23.5)#2 | 6.4% (+26.0)#928 |
| 3. | 05360 | 27.0% | 8.9% (+18.1)#3 | 6.4% (+20.6)#1,346 |
| 4. | 05058 | 25.7% | 8.9% (+16.9)#4 | 6.4% (+19.4)#1,490 |
| 5. | 05459 | 25.2% | 8.9% (+16.3)#5 | 6.4% (+18.8)#1,553 |
| 6. | 05077 | 22.6% | 8.9% (+13.8)#6 | 6.4% (+16.3)#1,950 |
| 7. | 05342 | 21.6% | 8.9% (+12.8)#7 | 6.4% (+15.3)#2,166 |
| 8. | 05742 | 20.4% | 8.9% (+11.6)#8 | 6.4% (+14.1)#2,428 |
| 9. | 05866 | 20.0% | 8.9% (+11.1)#9 | 6.4% (+13.6)#2,518 |
| 10. | 05079 | 19.7% | 8.9% (+10.8)#10 | 6.4% (+13.3)#2,620 |
| 11. | 05462 | 19.2% | 8.9% (+10.3)#11 | 6.4% (+12.8)#2,744 |
| 12. | 05471 | 19.2% | 8.9% (+10.3)#12 | 6.4% (+12.8)#2,745 |
| 13. | 05775 | 19.0% | 8.9% (+10.2)#13 | 6.4% (+12.7)#2,776 |
| 14. | 05038 | 18.9% | 8.9% (+10.0)#14 | 6.4% (+12.5)#2,808 |
| 15. | 05836 | 18.5% | 8.9% (+9.63)#15 | 6.4% (+12.1)#2,940 |
| 16. | 05084 | 18.3% | 8.9% (+9.46)#16 | 6.4% (+12.0)#2,985 |
| 17. | 05903 | 17.6% | 8.9% (+8.80)#17 | 6.4% (+11.3)#3,205 |
| 18. | 05829 | 17.6% | 8.9% (+8.74)#18 | 6.4% (+11.2)#3,225 |
| 19. | 05050 | 17.4% | 8.9% (+8.54)#19 | 6.4% (+11.0)#3,298 |
| 20. | 05658 | 17.2% | 8.9% (+8.36)#20 | 6.4% (+10.9)#3,359 |
| 21. | 05682 | 17.1% | 8.9% (+8.25)#21 | 6.4% (+10.7)#3,403 |
| 22. | 05821 | 17.1% | 8.9% (+8.24)#22 | 6.4% (+10.7)#3,404 |
| 23. | 05072 | 16.5% | 8.9% (+7.68)#23 | 6.4% (+10.2)#3,613 |
| 24. | 05070 | 16.3% | 8.9% (+7.49)#24 | 6.4% (+9.99)#3,682 |
| 25. | 05088 | 16.1% | 8.9% (+7.25)#25 | 6.4% (+9.75)#3,772 |
| 26. | 05492 | 15.6% | 8.9% (+6.76)#26 | 6.4% (+9.25)#3,964 |
| 27. | 05040 | 15.6% | 8.9% (+6.72)#27 | 6.4% (+9.22)#3,978 |
| 28. | 05651 | 15.5% | 8.9% (+6.68)#28 | 6.4% (+9.17)#3,994 |
| 29. | 05037 | 15.4% | 8.9% (+6.59)#29 | 6.4% (+9.08)#4,031 |
| 30. | 05039 | 15.4% | 8.9% (+6.55)#30 | 6.4% (+9.05)#4,038 |
| 31. | 05055 | 15.0% | 8.9% (+6.12)#31 | 6.4% (+8.62)#4,264 |
| 32. | 05827 | 14.8% | 8.9% (+5.95)#32 | 6.4% (+8.45)#4,354 |
| 33. | 05442 | 14.8% | 8.9% (+5.93)#33 | 6.4% (+8.43)#4,364 |
| 34. | 05153 | 14.7% | 8.9% (+5.84)#34 | 6.4% (+8.34)#4,409 |
| 35. | 05036 | 14.6% | 8.9% (+5.79)#35 | 6.4% (+8.29)#4,431 |
| 36. | 05676 | 14.6% | 8.9% (+5.73)#36 | 6.4% (+8.22)#4,462 |
| 37. | 05045 | 14.4% | 8.9% (+5.59)#37 | 6.4% (+8.09)#4,527 |
| 38. | 05773 | 14.4% | 8.9% (+5.58)#38 | 6.4% (+8.08)#4,535 |
| 39. | 05067 | 14.4% | 8.9% (+5.55)#39 | 6.4% (+8.05)#4,551 |
| 40. | 05062 | 14.2% | 8.9% (+5.31)#40 | 6.4% (+7.81)#4,687 |
| 41. | 05487 | 14.1% | 8.9% (+5.25)#41 | 6.4% (+7.75)#4,715 |
| 42. | 05494 | 14.1% | 8.9% (+5.25)#42 | 6.4% (+7.75)#4,720 |
| 43. | 05830 | 13.9% | 8.9% (+5.05)#43 | 6.4% (+7.55)#4,828 |
| 44. | 05640 | 13.6% | 8.9% (+4.73)#44 | 6.4% (+7.23)#5,031 |
| 45. | 05143 | 13.5% | 8.9% (+4.63)#45 | 6.4% (+7.13)#5,085 |
| 46. | 05486 | 13.4% | 8.9% (+4.55)#46 | 6.4% (+7.05)#5,138 |
| 47. | 05747 | 13.3% | 8.9% (+4.48)#47 | 6.4% (+6.98)#5,174 |
| 48. | 05464 | 13.3% | 8.9% (+4.47)#48 | 6.4% (+6.97)#5,191 |
| 49. | 05472 | 13.1% | 8.9% (+4.20)#49 | 6.4% (+6.70)#5,351 |
| 50. | 05474 | 12.8% | 8.9% (+3.90)#50 | 6.4% (+6.40)#5,553 |
| 51. | 05477 | 12.7% | 8.9% (+3.89)#51 | 6.4% (+6.39)#5,564 |
| 52. | 05832 | 12.5% | 8.9% (+3.61)#52 | 6.4% (+6.11)#5,803 |
| 53. | 05068 | 12.4% | 8.9% (+3.58)#53 | 6.4% (+6.08)#5,815 |
| 54. | 05033 | 12.4% | 8.9% (+3.54)#54 | 6.4% (+6.03)#5,852 |
| 55. | 05873 | 12.4% | 8.9% (+3.53)#55 | 6.4% (+6.03)#5,857 |
| 56. | 05675 | 12.4% | 8.9% (+3.52)#56 | 6.4% (+6.02)#5,864 |
| 57. | 05081 | 12.4% | 8.9% (+3.52)#57 | 6.4% (+6.02)#5,866 |
| 58. | 05677 | 12.4% | 8.9% (+3.51)#58 | 6.4% (+6.01)#5,874 |
| 59. | 05734 | 12.0% | 8.9% (+3.19)#59 | 6.4% (+5.69)#6,114 |
| 60. | 05757 | 12.0% | 8.9% (+3.18)#60 | 6.4% (+5.68)#6,120 |
| 61. | 05473 | 12.0% | 8.9% (+3.16)#61 | 6.4% (+5.66)#6,135 |
| 62. | 05444 | 11.9% | 8.9% (+3.07)#62 | 6.4% (+5.57)#6,216 |
| 63. | 05656 | 11.9% | 8.9% (+3.07)#63 | 6.4% (+5.57)#6,226 |
| 64. | 05680 | 11.8% | 8.9% (+2.96)#64 | 6.4% (+5.45)#6,310 |
| 65. | 05491 | 11.8% | 8.9% (+2.94)#65 | 6.4% (+5.44)#6,327 |
| 66. | 05151 | 11.7% | 8.9% (+2.84)#66 | 6.4% (+5.34)#6,421 |
| 67. | 05061 | 11.5% | 8.9% (+2.68)#67 | 6.4% (+5.18)#6,551 |
| 68. | 05655 | 11.4% | 8.9% (+2.58)#68 | 6.4% (+5.08)#6,637 |
| 69. | 05862 | 11.4% | 8.9% (+2.56)#69 | 6.4% (+5.06)#6,657 |
| 70. | 05839 | 11.4% | 8.9% (+2.55)#70 | 6.4% (+5.05)#6,663 |
| 71. | 05408 | 11.4% | 8.9% (+2.55)#71 | 6.4% (+5.05)#6,666 |
| 72. | 05761 | 11.3% | 8.9% (+2.49)#72 | 6.4% (+4.99)#6,730 |
| 73. | 05340 | 11.3% | 8.9% (+2.46)#73 | 6.4% (+4.96)#6,763 |
| 74. | 05458 | 11.2% | 8.9% (+2.37)#74 | 6.4% (+4.87)#6,844 |
| 75. | 05602 | 11.1% | 8.9% (+2.27)#75 | 6.4% (+4.77)#6,913 |
| 76. | 05476 | 11.1% | 8.9% (+2.23)#76 | 6.4% (+4.73)#6,995 |
| 77. | 05301 | 11.0% | 8.9% (+2.16)#77 | 6.4% (+4.66)#7,052 |
| 78. | 05457 | 11.0% | 8.9% (+2.16)#78 | 6.4% (+4.66)#7,057 |
| 79. | 05401 | 10.9% | 8.9% (+2.09)#79 | 6.4% (+4.59)#7,112 |
| 80. | 05826 | 10.9% | 8.9% (+2.05)#80 | 6.4% (+4.54)#7,150 |
| 81. | 05778 | 10.8% | 8.9% (+1.92)#81 | 6.4% (+4.42)#7,281 |
| 82. | 05660 | 10.8% | 8.9% (+1.91)#82 | 6.4% (+4.41)#7,300 |
| 83. | 05450 | 10.7% | 8.9% (+1.84)#83 | 6.4% (+4.33)#7,391 |
| 84. | 05760 | 10.7% | 8.9% (+1.82)#84 | 6.4% (+4.32)#7,404 |
| 85. | 05155 | 10.5% | 8.9% (+1.64)#85 | 6.4% (+4.14)#7,583 |
| 86. | 05351 | 10.5% | 8.9% (+1.64)#86 | 6.4% (+4.14)#7,590 |
| 87. | 05001 | 10.4% | 8.9% (+1.55)#87 | 6.4% (+4.05)#7,678 |
| 88. | 05346 | 10.4% | 8.9% (+1.54)#88 | 6.4% (+4.04)#7,688 |
| 89. | 05843 | 10.4% | 8.9% (+1.53)#89 | 6.4% (+4.03)#7,708 |
| 90. | 05404 | 10.4% | 8.9% (+1.52)#90 | 6.4% (+4.02)#7,713 |
| 91. | 05445 | 10.2% | 8.9% (+1.33)#91 | 6.4% (+3.83)#7,924 |
| 92. | 05161 | 10.1% | 8.9% (+1.25)#92 | 6.4% (+3.75)#8,009 |
| 93. | 05859 | 10.0% | 8.9% (+1.15)#93 | 6.4% (+3.65)#8,111 |
| 94. | 05842 | 9.8% | 8.9% (+0.984)#94 | 6.4% (+3.48)#8,334 |
| 95. | 05048 | 9.7% | 8.9% (+0.891)#95 | 6.4% (+3.39)#8,449 |
| 96. | 05748 | 9.7% | 8.9% (+0.883)#96 | 6.4% (+3.38)#8,463 |
| 97. | 05478 | 9.7% | 8.9% (+0.871)#97 | 6.4% (+3.37)#8,472 |
| 98. | 05358 | 9.6% | 8.9% (+0.764)#98 | 6.4% (+3.26)#8,611 |
| 99. | 05860 | 9.6% | 8.9% (+0.705)#99 | 6.4% (+3.20)#8,697 |
| 100. | 05051 | 9.5% | 8.9% (+0.672)#100 | 6.4% (+3.17)#8,729 |
Common Questions
What are the Top 10 Zip Codes with the Highest Percentage of Population with a Degree in Bio, Nature & Agricultural in Vermont?
Top 10 Zip Codes with the Highest Percentage of Population with a Degree in Bio, Nature & Agricultural in Vermont are:
What zip code has the Highest Percentage of Population with a Degree in Bio, Nature & Agricultural in Vermont?
05678 has the Highest Percentage of Population with a Degree in Bio, Nature & Agricultural in Vermont with 100.0%.
What is the Percentage of Population with a Degree in Bio, Nature & Agricultural in the State of Vermont?
Percentage of Population with a Degree in Bio, Nature & Agricultural in Vermont is 8.9%.
What is the Percentage of Population with a Degree in Bio, Nature & Agricultural in the United States?
Percentage of Population with a Degree in Bio, Nature & Agricultural in the United States is 6.4%.